
Real-time AI Agent Assist Market Size 2025-2029
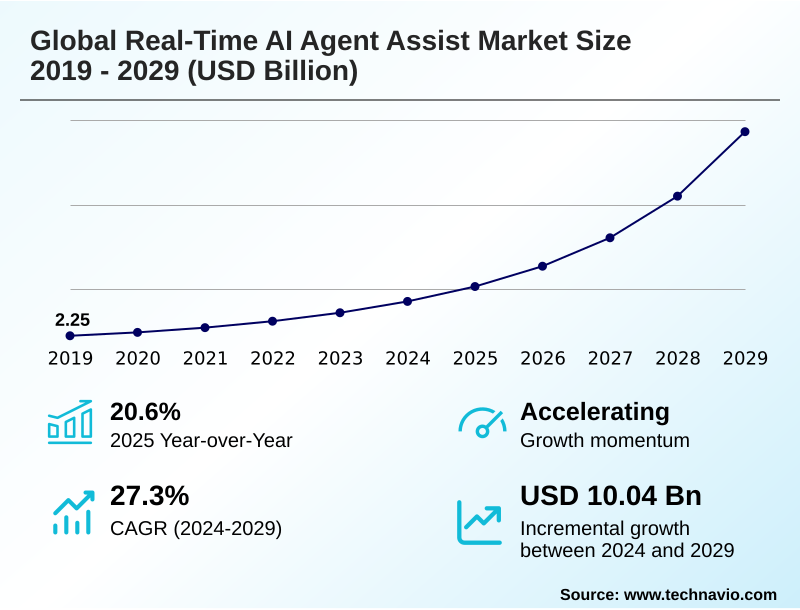
The real-time ai agent assist market size is valued to increase by USD 10.04 billion, at a CAGR of 27.3% from 2024 to 2029. Proliferation and integration of advanced generative AI will drive the real-time ai agent assist market.
Major Market Trends & Insights
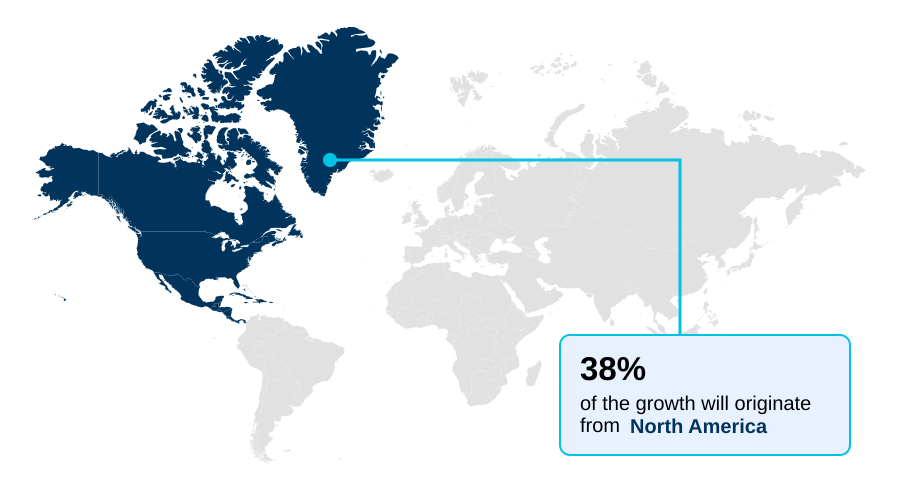
- North America dominated the market and accounted for a 37.7% growth during the forecast period.
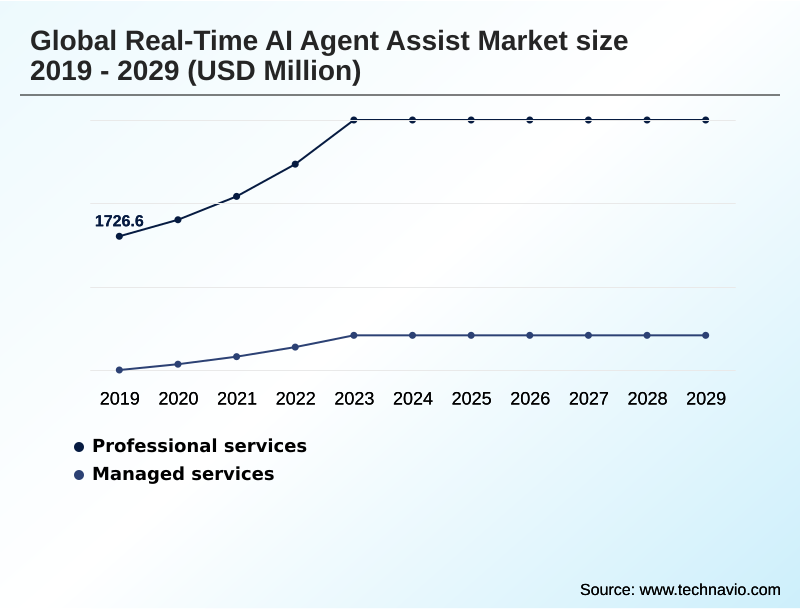
- By Service - Professional services segment was valued at USD 2.77 billion in 2023
- By Deployment - Cloud-based segment accounted for the largest market revenue share in 2023
Market Size & Forecast
- Market Opportunities: USD 12.06 billion
- Market Future Opportunities: USD 10.04 billion
- CAGR from 2024 to 2029 : 27.3%
Market Summary
- The real-time AI agent assist market is rapidly evolving, driven by the convergence of advanced natural language processing and the strategic imperative for superior customer experience. These platforms function as a real-time agent coaching layer, providing context-aware guidance and automating routine tasks to augment human capabilities.
- The integration of generative AI has transformed these tools from simple script prompters to dynamic copilots capable of automated conversation summarization and nuanced sentiment and intent recognition.
- For example, in a complex financial services interaction, an AI assistant can perform real-time compliance monitoring, ensuring the agent adheres to regulatory scripts while simultaneously pulling relevant account data, all without the agent switching screens. This workflow automation tools capability significantly reduces cognitive load.
- However, the market faces challenges related to integrating AI with CRM systems, data security, and demonstrating clear ROI, which tempers the pace of adoption despite the clear benefits of AI-driven operational efficiency and enhanced AI for first contact resolution.
- The focus is now on creating a seamless unified agent desktop that enhances, rather than disrupts, the agent's workflow through sophisticated agent copilot integration.
What will be the Size of the Real-time AI Agent Assist Market during the forecast period?
Get Key Insights on Market Forecast (PDF) Get Free Sample
How is the Real-time AI Agent Assist Market Segmented?
The real-time ai agent assist industry research report provides comprehensive data (region-wise segment analysis), with forecasts and estimates in "USD million" for the period 2025-2029, as well as historical data from 2019-2023 for the following segments.
- Service
- Professional services
- Managed services
- Deployment
- Cloud-based
- On-premises
- End-user
- BFSI
- IT and telecom
- Retail and e-commerce
- Healthcare
- Automotive
- Geography
- North America
- US
- Canada
- Mexico
- APAC
- China
- India
- Japan
- Europe
- UK
- Germany
- France
- South America
- Brazil
- Argentina
- Colombia
- Middle East and Africa
- UAE
- South Africa
- Saudi Arabia
- Rest of World (ROW)
- North America
By Service Insights
The professional services segment is estimated to witness significant growth during the forecast period.
Professional services are integral to the real-time AI agent assist market, ensuring organizations effectively deploy and optimize conversational AI platforms.
This segment focuses on specialized consulting for AI-driven knowledge management, machine learning models customization, and complex system integration, which is critical for achieving a high return on investment.
Service providers deliver context-aware guidance on implementation, helping clients navigate multimodal AI interactions and establish intelligent routing systems. These services are essential for tailoring AI-driven diagnostic tools to specific industry verticals and ensuring omnichannel communication support.
Effective professional services can improve the success rate of initial deployments by over 30%, by aligning the technology, such as natural language processing, with core business workflows from the outset, thus maximizing the benefits of human-in-the-loop assistance and AI-powered automation features.
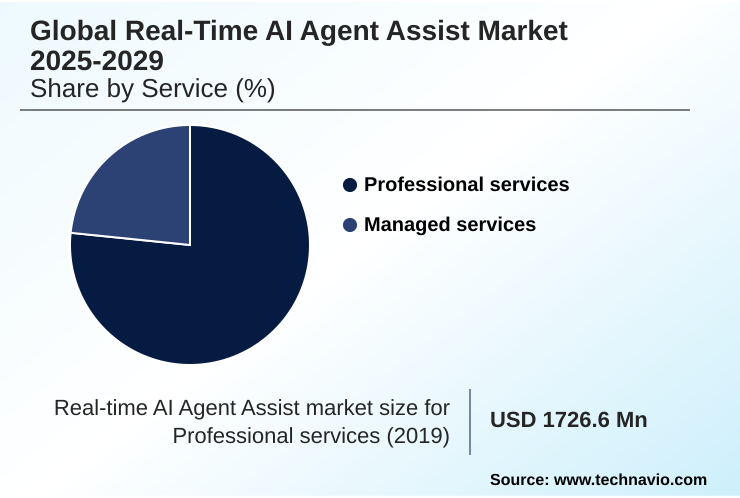
The Professional services segment was valued at USD 2.77 billion in 2023 and showed a gradual increase during the forecast period.
Regional Analysis
North America is estimated to contribute 37.7% to the growth of the global market during the forecast period.Technavio’s analysts have elaborately explained the regional trends and drivers that shape the market during the forecast period.
See How Real-time AI Agent Assist Market Demand is Rising in North America Get Free Sample
The geographic landscape is led by North America, which is poised to contribute over 37% of the market's incremental growth, driven by high adoption of contact center AI platforms and cloud-based agent assist technologies.
In this region, a mature focus on customer experience fuels demand for AI for customer service agents with advanced sentiment and intent recognition.
In contrast, the APAC region is the fastest-growing market, characterized by large-scale deployments in BPO hubs aimed at AI-powered agent productivity and leveraging real-time call guidance software.
Europe's market is heavily shaped by regulation, prioritizing solutions with strong real-time compliance monitoring.
For instance, the market in the US is projected to reach a significant scale by 2024, nearly double that of the next largest country market, demonstrating the region's advanced adoption of automated workflow orchestration.
Market Dynamics
Our researchers analyzed the data with 2024 as the base year, along with the key drivers, trends, and challenges. A holistic analysis of drivers will help companies refine their marketing strategies to gain a competitive advantage.
- Strategic deployment of real-time AI agent assist is moving beyond basic efficiency gains toward highly specialized applications. For instance, real-time AI agent assist for complex sales is being used to guide representatives through nuanced negotiations, providing competitive intelligence and pricing suggestions on the fly.
- A critical focus area is using generative AI to reduce agent training time, where platforms act as perpetual mentors, a method shown to improve new hire proficiency twice as fast as traditional classroom settings.
- Demonstrating the ROI of agent assist in financial services remains a key executive priority, often hinging on AI-powered compliance monitoring for healthcare call centers and financial institutions to mitigate risk.
- The technical hurdle of overcoming integration challenges with AI agent assist is being addressed through composable architectures, but a best practices for integrating AI copilot with legacy CRM framework is still emerging. Advanced platforms are improving FCR rates with predictive agent guidance and using real-time sentiment analysis for customer retention strategies.
- A key capability is automating post-call work with AI agent assist, which frees up significant agent capacity. For global operations, agent assist platforms for multilingual support with real-time translation features in agent assist tools are essential. The debate over on-premises versus cloud deployment for AI agent assist often centers on securing sensitive data in real-time AI analysis.
- Ultimately, the goal is to discover how AI agent assist improves employee satisfaction by using AI to guide agents through complex workflows, which is crucial for long-term success when measuring the impact of AI agent assist on CSAT.
What are the key market drivers leading to the rise in the adoption of Real-time AI Agent Assist Industry?
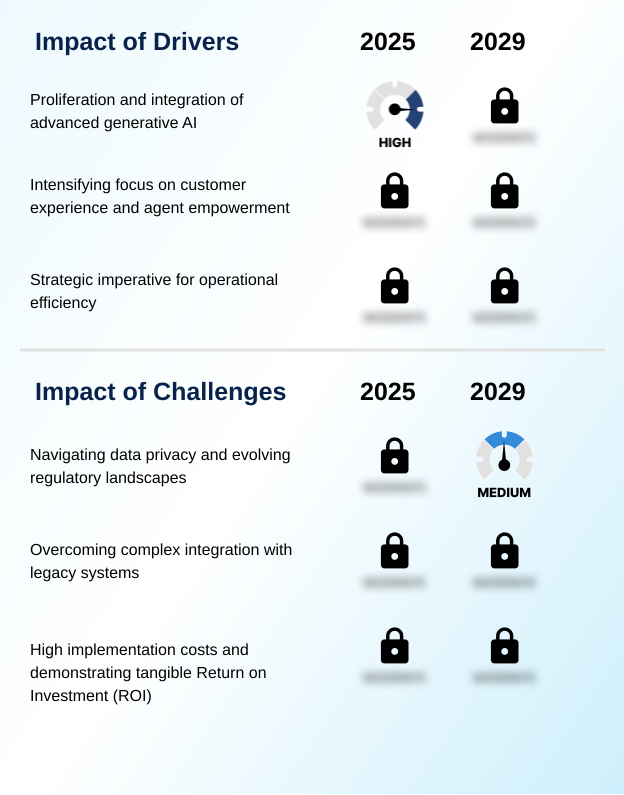
- The proliferation and integration of advanced generative AI technologies is a key driver fueling the growth and evolution of the market.
- The primary driver is the pervasive adoption of generative AI in customer support, which is fundamentally improving agent experience with AI.
- This generative AI integration facilitates advanced capabilities like automated conversation summarization and AI-powered response generation, directly contributing to AI-driven operational efficiency. By automating routine tasks, organizations can reduce average handle time with AI by over 20%.
- The strategic focus on agent empowerment technologies also fuels growth, as businesses recognize that managing agent burnout with AI is critical for retention.
- This is evident in the deployment of real-time agent coaching systems, which have been shown to decrease new agent onboarding time by up to 50%, highlighting the clear agent assist ROI measurement.
- These customer interaction analysis tools transform service centers into strategic assets.
What are the market trends shaping the Real-time AI Agent Assist Industry?
- Hyper-personalization at scale is an emerging market trend, driven by the move from reactive support to proactive and predictive assistance that anticipates customer needs.
- The market is shifting toward AI-driven hyper-personalization and proactive customer engagement, where predictive engagement platforms anticipate needs before they are articulated. This evolution is powered by agentic AI experience engine technology, which enables proactive service recovery and moves beyond reactive support.
- Deep agent copilot integration into the unified agent desktop is becoming standard, with some platforms achieving a 40% reduction in agent screen-switching. Furthermore, the development of vertical-specific AI models tailored for sectors like healthcare and finance is a significant trend, as these specialized systems can improve compliance-related accuracy by up to 25%.
- These verticalized AI models in telecommunications and other sectors use retrieval-augmented generation to provide highly relevant, context-specific guidance, improving first-contact resolution rates by 15%.
What challenges does the Real-time AI Agent Assist Industry face during its growth?
- Navigating the complex landscape of data privacy and evolving global regulations presents a primary challenge that affects market growth and adoption.
- Key challenges revolve around AI ethics and governance and the complexities of integrating AI with CRM systems, particularly legacy platforms. A significant portion, around 40% of enterprises, cite integration as a primary barrier to adoption for on-premises agent assist solutions.
- The necessity for robust data anonymization techniques to comply with stringent AI compliance solutions for contact centers adds another layer of complexity. Furthermore, the high initial cost makes it difficult to demonstrate a quantifiable return, with many projects struggling to prove value beyond indirect metrics. This is especially true when securing sensitive data in real-time AI analysis.
- Organizations must navigate these hurdles in AI for regulated industries like AI for financial services compliance and AI for healthcare patient support to unlock the full potential of AI for agent training and onboarding and AI-powered technical support.
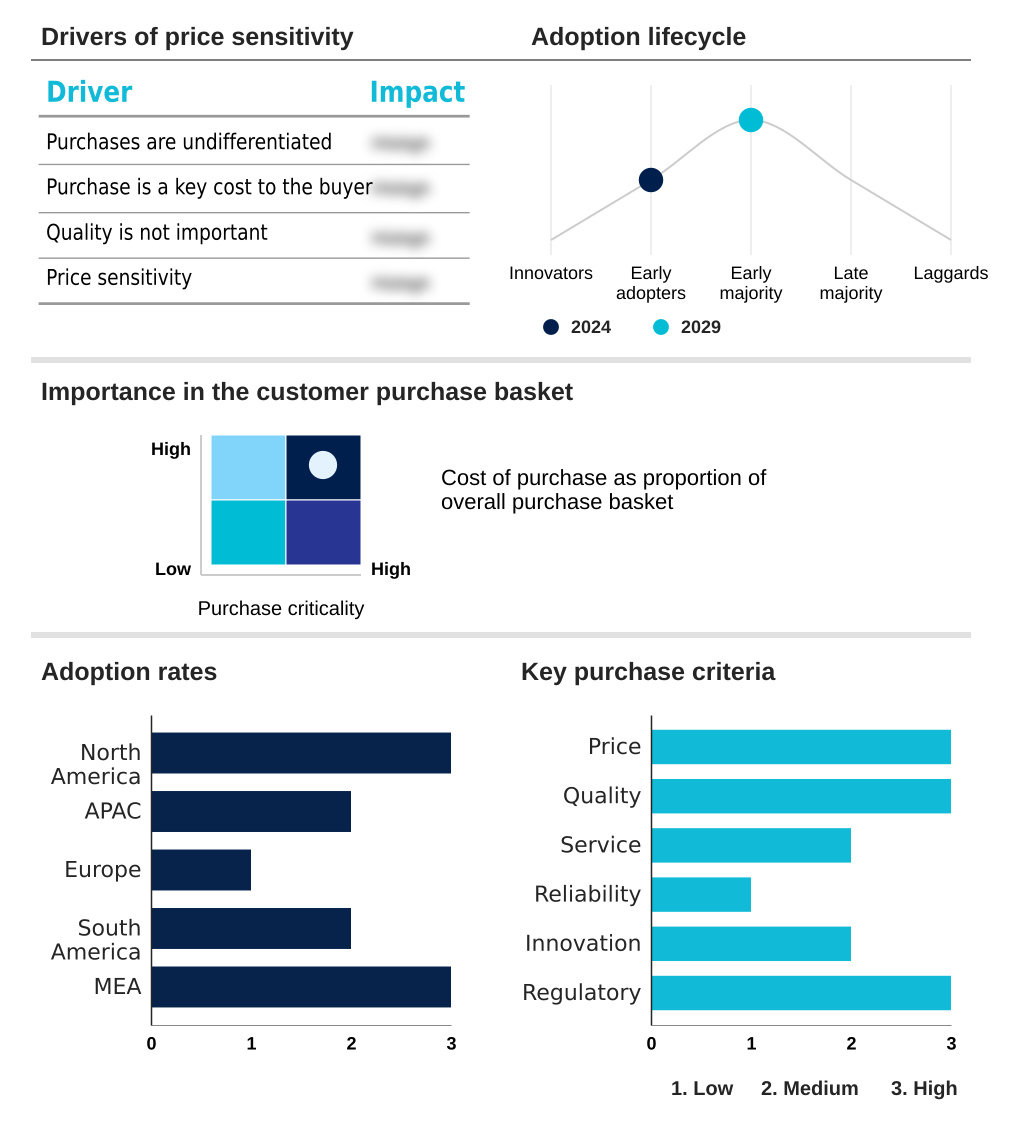
Exclusive Technavio Analysis on Customer Landscape
The real-time ai agent assist market forecasting report includes the adoption lifecycle of the market, covering from the innovator’s stage to the laggard’s stage. It focuses on adoption rates in different regions based on penetration. Furthermore, the real-time ai agent assist market report also includes key purchase criteria and drivers of price sensitivity to help companies evaluate and develop their market growth analysis strategies.
Customer Landscape of Real-time AI Agent Assist Industry
Competitive Landscape
Companies are implementing various strategies, such as strategic alliances, real-time ai agent assist market forecast, partnerships, mergers and acquisitions, geographical expansion, and product/service launches, to enhance their presence in the industry.
10Clouds - An integrated conversational AI platform automates interactions and offers agents real-time insights and recommendations, enhancing performance and customer experience.
The industry research and growth report includes detailed analyses of the competitive landscape of the market and information about key companies, including:
- 10Clouds
- Azumo
- Balto Software Inc.
- Code Brew Labs
- Cognigy GmbH
- Deviniti
- Emerline
- Google LLC
- HatchWorks
- Help Scout
- Imobisoft Ltd.
- IBM Corp.
- Microsoft Corp.
- Netomi
- SoluLab
- Stepwise
- Tidio LLC
- Vstorm Sp. z o.o.
- Zendesk Inc.
Qualitative and quantitative analysis of companies has been conducted to help clients understand the wider business environment as well as the strengths and weaknesses of key industry players. Data is qualitatively analyzed to categorize companies as pure play, category-focused, industry-focused, and diversified; it is quantitatively analyzed to categorize companies as dominant, leading, strong, tentative, and weak.
Recent Development and News in Real-time ai agent assist market
- In October, 2024, Talkdesk announced the integration of agentic AI across its entire AI platform, branded as Talkdesk Ascend AI, to allow AI agents to perform complex tasks more independently.
- In October, 2024, Avaya released new bundles for its on-premise Avaya Experience Platform (AXP), enabling customers to layer AI capabilities like real-time transcription and agent-assist onto existing infrastructure.
- In January, 2025, ServiceNow launched its AI Agent Orchestrator to coordinate AI agents across different business functions and systems from the cloud.
- In April, 2025, Cisco announced customer trials for its Webex AI Agent for on-premise customers, demonstrating a continued commitment to hybrid deployments.
Dive into Technavio’s robust research methodology, blending expert interviews, extensive data synthesis, and validated models for unparalleled Real-time AI Agent Assist Market insights. See full methodology.
| Market Scope | |
|---|---|
| Page number | 296 |
| Base year | 2024 |
| Historic period | 2019-2023 |
| Forecast period | 2025-2029 |
| Growth momentum & CAGR | Accelerate at a CAGR of 27.3% |
| Market growth 2025-2029 | USD 10036.6 million |
| Market structure | Fragmented |
| YoY growth 2024-2025(%) | 20.6% |
| Key countries | US, Canada, Mexico, China, India, Japan, South Korea, Australia, Indonesia, UK, Germany, France, Spain, Italy, The Netherlands, Brazil, Argentina, Colombia, UAE, South Africa, Saudi Arabia, Turkey and Israel |
| Competitive landscape | Leading Companies, Market Positioning of Companies, Competitive Strategies, and Industry Risks |
Research Analyst Overview
- The market is defined by a rapid maturation of machine learning models, enabling a shift from reactive guidance to proactive customer engagement. The core value proposition centers on AI-driven knowledge management and sophisticated automated case categorization, which directly impacts operational efficiency.
- Boardroom decisions are increasingly influenced by the need for robust real-time compliance monitoring, a capability inherent in modern platforms that can reduce compliance-related errors by over 30%. Innovations in AI-powered response generation and dynamic conversational analysis are making human-in-the-loop assistance more seamless.
- Technologies like retrieval-augmented generation and agentic AI experience engine are no longer theoretical; they are being embedded into conversational AI platforms to deliver contextual AI recommendations. This generative AI integration into the unified agent desktop is creating a new standard for omnichannel communication support, where next-best-action prediction and automated workflow orchestration are key differentiators.
- The focus is on leveraging customer journey mapping and AI-driven diagnostic tools to refine intelligent routing systems and provide unparalleled agent-facing search functionalities.
What are the Key Data Covered in this Real-time AI Agent Assist Market Research and Growth Report?
-
What is the expected growth of the Real-time AI Agent Assist Market between 2025 and 2029?
-
USD 10.04 billion, at a CAGR of 27.3%
-
-
What segmentation does the market report cover?
-
The report is segmented by Service (Professional services, Managed services), Deployment (Cloud-based, On-premises), End-user (BFSI, IT and telecom, Retail and e-commerce, Healthcare, Automotive) and Geography (North America, APAC, Europe, South America, Middle East and Africa)
-
-
Which regions are analyzed in the report?
-
North America, APAC, Europe, South America and Middle East and Africa
-
-
What are the key growth drivers and market challenges?
-
Proliferation and integration of advanced generative AI, Navigating data privacy and evolving regulatory landscapes
-
-
Who are the major players in the Real-time AI Agent Assist Market?
-
10Clouds, Azumo, Balto Software Inc., Code Brew Labs, Cognigy GmbH, Deviniti, Emerline, Google LLC, HatchWorks, Help Scout, Imobisoft Ltd., IBM Corp., Microsoft Corp., Netomi, SoluLab, Stepwise, Tidio LLC, Vstorm Sp. z o.o. and Zendesk Inc.
-
Market Research Insights
- The market dynamic is defined by a push for AI-driven operational efficiency, with platforms demonstrating capabilities to improve first contact resolution by up to 15%. A major focus is on improving agent experience with AI, as solutions that reduce cognitive load can lower agent attrition rates by 20%.
- Agent empowerment technologies are no longer a luxury but a necessity for AI-powered agent productivity. Despite clear benefits, adoption is tempered by integration challenges, as nearly 40% of organizations report difficulties connecting modern contact center AI platforms with legacy infrastructure.
- The demand for real-time call guidance software that provides immediate, actionable insights is surging as businesses seek to leverage generative AI in customer support to gain a competitive edge through superior service delivery and AI-driven upselling and cross-selling.
We can help! Our analysts can customize this real-time ai agent assist market research report to meet your requirements.
 RIA -
RIA - 
