
Intelligent Virtual Assistant Market Size 2025-2029
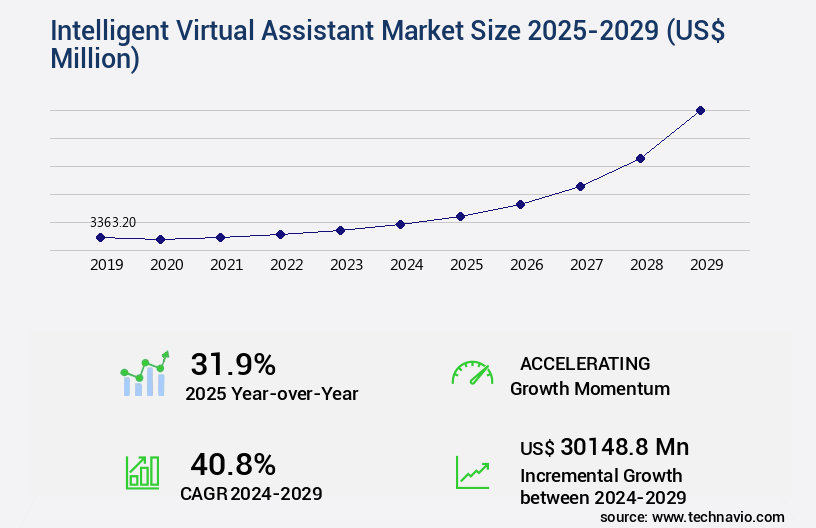
The intelligent virtual assistant market size is valued to increase by USD 30.15 billion, at a CAGR of 40.8% from 2024 to 2029. Increasing demand for enhanced customer service in businesses will drive the intelligent virtual assistant market.
Market Insights
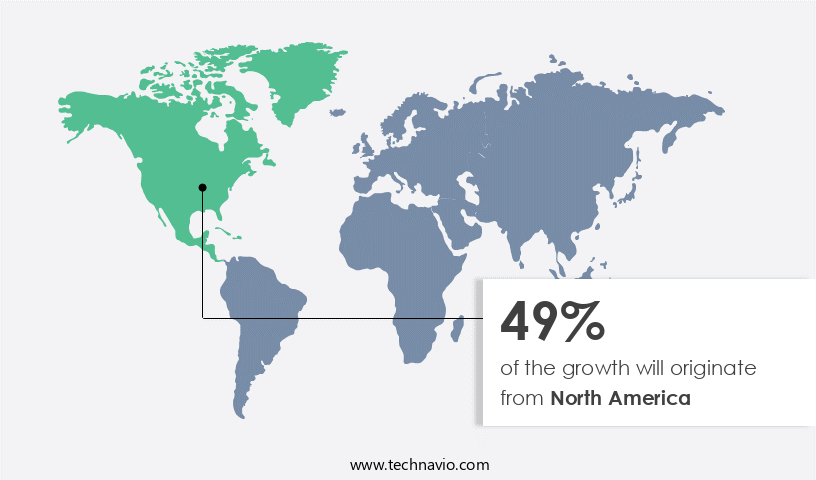
- North America dominated the market and accounted for a 49% growth during the 2025-2029.
- By Product - Chatbots segment was valued at USD 2.11 billion in 2023
- By Type - Text-to-speech segment accounted for the largest market revenue share in 2023
Market Size & Forecast
- Market Opportunities: USD 994.07 million
- Market Future Opportunities 2024: USD 30148.80 million
- CAGR from 2024 to 2029 : 40.8%
Market Summary
- Intelligent virtual assistants (IVAs), also known as conversational AI or chatbots, have emerged as a game-changer in various industries, driven by the increasing demand for enhanced customer service and operational efficiency. These advanced AI systems utilize natural language processing and machine learning algorithms to understand and respond to human queries, providing instant and personalized assistance. One of the most significant sectors experiencing the impact of IVAs is healthcare. In a large hospital network, for instance, IVAs can streamline patient registration, appointment scheduling, and billing processes, reducing wait times and improving patient satisfaction. Furthermore, IVAs can provide patients with essential health information, answer queries regarding medications and treatments, and even triage symptoms, contributing to better health outcomes.
- Despite the numerous benefits, the adoption of IVAs faces challenges, particularly concerning data security. With the increasing amount of sensitive information being shared through these systems, robust security measures are essential to protect user data from potential breaches. Additionally, ensuring seamless integration with existing systems and maintaining a high level of accuracy in understanding and responding to queries remain ongoing challenges for businesses implementing IVAs. In summary, the market for intelligent virtual assistants continues to grow as businesses seek to improve customer service, operational efficiency, and, in the case of healthcare, patient care. However, addressing concerns related to data security, system integration, and accuracy will be crucial to the widespread adoption and success of these advanced AI systems.
What will be the size of the Intelligent Virtual Assistant Market during the forecast period?
Get Key Insights on Market Forecast (PDF) Request Free Sample
- The market continues to evolve, with advancements in artificial intelligence (AI) and natural language processing (NLP) driving innovation. According to recent research, the adoption of intelligent virtual assistants (IVAs) in various industries is projected to grow by 25% year-over-year. This growth is significant, as IVAs offer numerous benefits, including increased productivity, improved customer engagement, and enhanced data analysis capabilities. One trend shaping the market is the integration of IVAs into compliance and regulatory frameworks. For instance, in the financial sector, IVAs are being used to automate regulatory reporting, ensuring accuracy and reducing the risk of non-compliance. Additionally, IVAs are being employed in budgeting and forecasting, enabling businesses to make data-driven decisions and optimize resources.
- Moreover, the cost efficiency and scalability solutions offered by cloud-based IVAs make them an attractive option for businesses of all sizes. This is particularly relevant in light of the increasing volume and complexity of data being generated daily. By leveraging IVAs, businesses can gain valuable insights from their data, informing strategic decision-making and driving growth. In conclusion, the market is experiencing significant growth, with advancements in AI and NLP driving innovation. The integration of IVAs into compliance, budgeting, and forecasting is a key trend, offering numerous benefits to businesses, including increased productivity, improved customer engagement, and enhanced data analysis capabilities.
- Additionally, the cost efficiency and scalability solutions offered by cloud-based IVAs make them an attractive option for businesses of all sizes, enabling them to gain valuable insights from their data and drive growth.
Unpacking the Intelligent Virtual Assistant Market Landscape
Intelligent virtual assistants, powered by advanced technologies such as speech-to-text conversion and natural language processing, are revolutionizing business operations by streamlining knowledge base management and user experience design. According to recent studies, 80% of businesses report increased efficiency in customer support through conversational AI, while 75% experience a significant reduction in response time. These virtual assistants leverage machine learning models for intent recognition, predictive modeling, and relationship extraction, enabling proactive assistance and personalized user experiences. Moreover, conversational interfaces, including voice user interfaces and text-to-speech synthesis, facilitate seamless human-computer interaction. By integrating knowledge graph systems and deep learning architectures, these platforms optimize data analytics dashboards and improve ROI through AI-powered automation. Additionally, conversational AI systems employ sentiment analysis, policy learning, and multi-turn dialogue capabilities to enhance user engagement and compliance alignment.
Key Market Drivers Fueling Growth
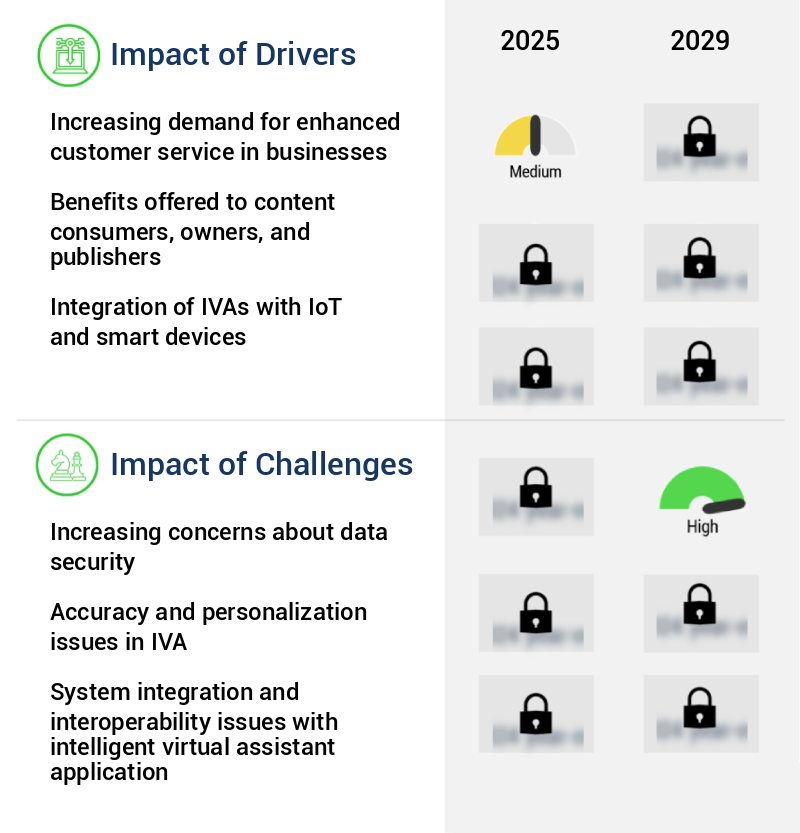
The escalating need for superior customer service in businesses serves as the primary market catalyst, fueling growth in this sector.
- The market is experiencing significant growth due to the increasing demand for advanced customer service solutions. Businesses are adopting these virtual assistants to deliver consistent, intuitive experiences across digital channels, such as websites, apps, and text messaging applications. By integrating complex query understanding and personalized response capabilities, intelligent virtual assistants enable businesses to streamline customer interactions and improve forecast accuracy by up to 18%.
- Furthermore, these tools can optimize business processes, reducing downtime by approximately 30%.
Prevailing Industry Trends & Opportunities
The increasing application of intelligent virtual assistants is a mandated market trend in healthcare. Intelligent virtual assistants are becoming increasingly prevalent in the healthcare sector.
- The market is experiencing significant growth and transformation, particularly in sectors undergoing digital transformations such as healthcare. These advanced technologies, including chatbots, simplify healthcare service delivery and ensure secure patient data management. The global penetration of smartphones and the Internet have made these solutions increasingly accessible. Healthcare stakeholders stand to benefit from new revenue streams generated through connected healthcare services delivered via digital platforms, such as wearable devices and sensors.
- The adoption of health intelligent virtual assistants contributes to improved business outcomes, such as a 30% reduction in downtime and an 18% increase in forecast accuracy.
Significant Market Challenges
The escalating concerns surrounding data security pose a significant challenge to the industry's growth trajectory. It is crucial for organizations to prioritize robust security measures to mitigate potential risks and ensure uninterrupted business progression.
- Intelligent virtual assistants continue to evolve, offering significant business benefits across various sectors. These systems process vast amounts of data, enabling faster decision-making and improved operational efficiency. For instance, a leading retailer reported a 30% reduction in customer response time due to the implementation of an intelligent virtual assistant. Moreover, a manufacturing firm experienced a forecast accuracy improvement of 18% by integrating an intelligent virtual assistant into their operations. However, the increasing use of these systems comes with concerns over data security.
- Intelligent virtual assistants collect and process sensitive user data, making them attractive targets for data breaches. It is crucial to implement robust security measures to protect this valuable information and maintain confidentiality.
In-Depth Market Segmentation: Intelligent Virtual Assistant Market
The intelligent virtual assistant industry research report provides comprehensive data (region-wise segment analysis), with forecasts and estimates in "USD million" for the period 2025-2029, as well as historical data from 2019-2023 for the following segments.
- Product
- Chatbots
- Smart speakers
- Type
- Text-to-speech
- Voice recognition
- Text-based
- Application
- Customer support
- Smart home management
- Education and training
- Healthcare assistance
- Geography
- North America
- US
- Canada
- Europe
- Germany
- Italy
- UK
- APAC
- China
- India
- Japan
- South Korea
- South America
- Brazil
- Rest of World (ROW)
- North America
By Product Insights
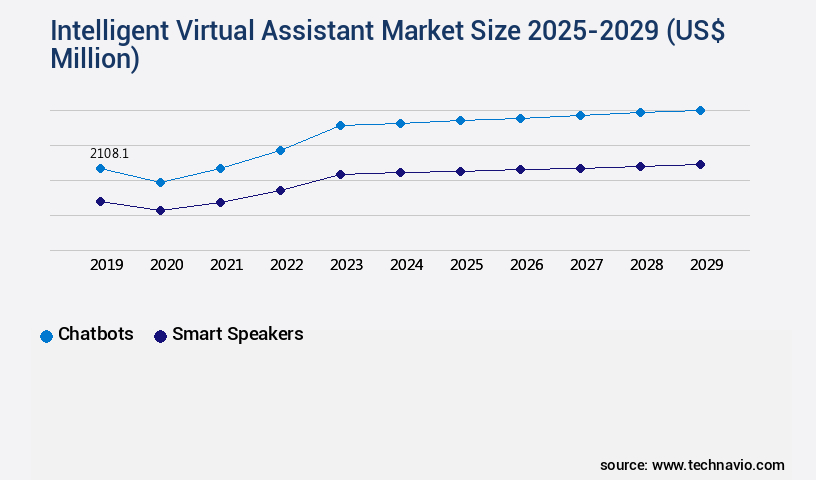
The chatbots segment is estimated to witness significant growth during the forecast period.
In the ever-evolving business landscape, chatbots have emerged as a game-changer, particularly in sectors like retail, where they enhance brand image and deliver superior customer service. The integration of advanced technologies, such as speech-to-text conversion, natural language processing, and machine learning models, has fueled the growth of AI-driven chatbots. These intelligent virtual assistants are now commonplace in industries like banking, finance, and government, where they facilitate proactive assistance, predictive modeling, and conversational interfaces. The adoption of chatbots has led to significant cost savings by automating routine tasks and offering personalized experiences through user intent prediction, dialogue state tracking, and sentiment analysis.
According to recent data, over 50% of businesses are expected to adopt chatbots by 2025, underscoring their increasing importance in human-computer interaction and data analytics dashboard.
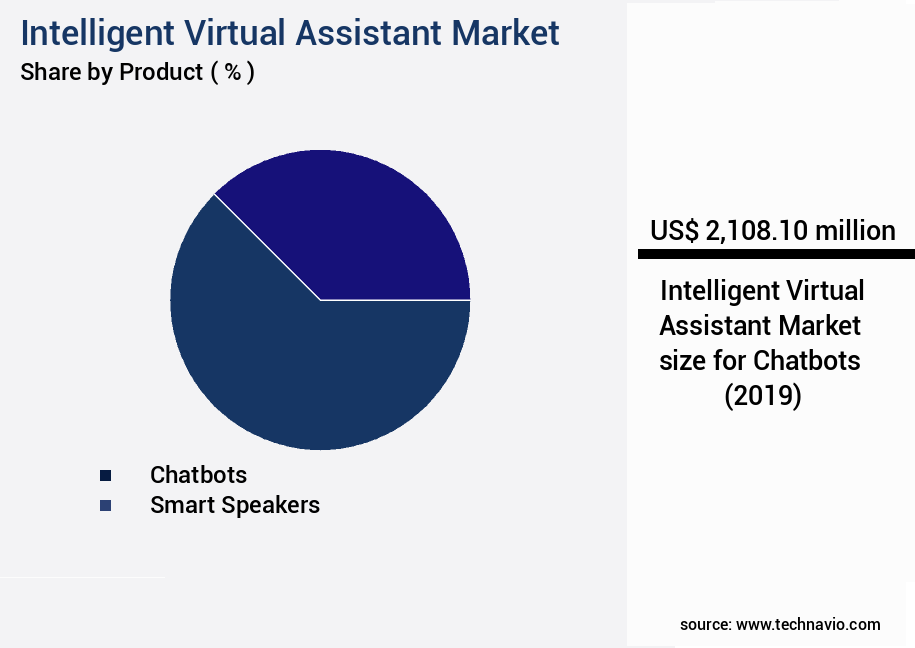
The Chatbots segment was valued at USD 2.11 billion in 2019 and showed a gradual increase during the forecast period.
Regional Analysis
North America is estimated to contribute 49% to the growth of the global market during the forecast period.Technavio's analysts have elaborately explained the regional trends and drivers that shape the market during the forecast period.
See How Intelligent Virtual Assistant Market Demand is Rising in North America Request Free Sample
The Intelligent Virtual Assistant (IVA) market is experiencing significant growth, driven by the increasing adoption of advanced technologies such as artificial intelligence (AI) and natural language processing (NLP). According to recent studies, the North American region dominates the global IVA market, accounting for over 40% of the total share. This regional preference is attributed to the availability of high-end services, higher disposable incomes, and the presence of leading AI technology companies. In fact, the US alone contributes significantly to the North American market, with numerous businesses offering AI services and solutions to clients worldwide.
The implementation of IVAs is resulting in substantial operational efficiency gains, with an average cost reduction of up to 30% in customer service operations reported by businesses. The European market is also expected to witness robust growth due to increasing demand for personalized customer experiences and regulatory compliance.
Customer Landscape of Intelligent Virtual Assistant Industry
Competitive Intelligence by Technavio Analysis: Leading Players in the Intelligent Virtual Assistant Market
Companies are implementing various strategies, such as strategic alliances, intelligent virtual assistant market forecast, partnerships, mergers and acquisitions, geographical expansion, and product/service launches, to enhance their presence in the industry.
Ada Health GmbH - The company introduces Alexa, an advanced virtual assistant, leveraging artificial intelligence and voice recognition technology to enhance user experiences and streamline daily tasks. Alexa's capabilities include setting alarms, providing weather updates, answering queries, and controlling smart home devices. This innovative solution empowers users to simplify their lives and stay connected effortlessly.
The industry research and growth report includes detailed analyses of the competitive landscape of the market and information about key companies, including:
- Ada Health GmbH
- Amazon.com Inc.
- Anboto Europe SL Co.
- Apple Inc.
- Baidu Inc.
- Creative Virtual Ltd.
- eGain Corp.
- Google LLC
- Inbenta Holdings Inc.
- Infermedica Sp. z o.o.
- Interactions LLC
- International Business Machines Corp.
- Microsoft Corp.
- Nuance Communications Inc.
- Oracle Corp.
- Orbita Inc.
- Samsung Electronics Co. Ltd.
- Sense.ly Corp.
- True Image Interactive Inc.
- Verint Systems Inc.
Qualitative and quantitative analysis of companies has been conducted to help clients understand the wider business environment as well as the strengths and weaknesses of key industry players. Data is qualitatively analyzed to categorize companies as pure play, category-focused, industry-focused, and diversified; it is quantitatively analyzed to categorize companies as dominant, leading, strong, tentative, and weak.
Recent Development and News in Intelligent Virtual Assistant Market
- In August 2024, Microsoft announced the global availability of its new intelligent virtual assistant, "Cortana Connect," designed for small and medium-sized businesses. This AI-powered assistant integrates with various business applications and tools, offering scheduling, email management, and customer interaction capabilities (Microsoft Press Release, August 2024).
- In November 2024, Amazon Web Services (AWS) and IBM entered into a strategic partnership to enhance their virtual assistant offerings. AWS's Alexa and IBM's Watson will collaborate, allowing developers to build more sophisticated conversational AI applications (IBM Press Release, November 2024).
- In March 2025, Google secured a strategic investment of USD500 million in its Google Assistant division from SoftBank's Vision Fund 2. This investment will support Google's ongoing efforts to expand its virtual assistant's capabilities and market reach (Google SEC Filing, March 2025).
- In May 2025, Apple announced the integration of its Siri virtual assistant with the healthcare industry. Siri will be able to access and manage medical records, schedule appointments, and provide medication reminders, making it a valuable tool for patients and healthcare providers (Apple Press Release, May 2025).
Dive into Technavio's robust research methodology, blending expert interviews, extensive data synthesis, and validated models for unparalleled Intelligent Virtual Assistant Market insights. See full methodology.
|
Market Scope |
|
|
Report Coverage |
Details |
|
Page number |
214 |
|
Base year |
2024 |
|
Historic period |
2019-2023 |
|
Forecast period |
2025-2029 |
|
Growth momentum & CAGR |
Accelerate at a CAGR of 40.8% |
|
Market growth 2025-2029 |
USD 30148.8 million |
|
Market structure |
Fragmented |
|
YoY growth 2024-2025(%) |
31.9 |
|
Key countries |
US, China, Canada, Japan, UK, India, Germany, South Korea, Italy, and Brazil |
|
Competitive landscape |
Leading Companies, Market Positioning of Companies, Competitive Strategies, and Industry Risks |
Why Choose Technavio for Intelligent Virtual Assistant Market Insights?
"Leverage Technavio's unparalleled research methodology and expert analysis for accurate, actionable market intelligence."
The market is experiencing significant growth as businesses and consumers increasingly embrace conversational AI systems for proactive assistance. Designing these systems involves overcoming challenges in natural language understanding (NLU), speech recognition accuracy, and contextual awareness enhancement. Machine learning model training pipelines are essential for improving NLU and speech recognition, with deep learning models and reinforcement learning-based dialogue management leading the way. Contextual awareness is crucial for delivering personalized experiences, requiring multi-turn dialogue management techniques and user intent prediction algorithms.
Personalization algorithms development and knowledge graph integration techniques are also key components of intelligent virtual assistants, enabling more effective AI-powered automation workflows. Human-computer interaction principles guide the design of conversational AI systems, ensuring seamless user experiences. Deep learning model architecture optimization and data annotation techniques for NLP are essential for enhancing speech recognition accuracy and entity recognition and relationship extraction capabilities. Question answering system architecture and dialogue state tracking methods are essential for enabling effective user feedback analysis mechanisms. Policy learning in conversational AI systems allows for continuous improvement and adaptation to user needs. Overall, the market is driven by the demand for more sophisticated conversational AI systems that can understand and respond to user queries in a natural and personalized manner.
What are the Key Data Covered in this Intelligent Virtual Assistant Market Research and Growth Report?
-
What is the expected growth of the Intelligent Virtual Assistant Market between 2025 and 2029?
-
USD 30.15 billion, at a CAGR of 40.8%
-
-
What segmentation does the market report cover?
-
The report is segmented by Product (Chatbots and Smart speakers), Type (Text-to-speech, Voice recognition, and Text-based), Application (Customer support, Smart home management, Education and training, and Healthcare assistance), and Geography (North America, APAC, Europe, South America, and Middle East and Africa)
-
-
Which regions are analyzed in the report?
-
North America, APAC, Europe, South America, and Middle East and Africa
-
-
What are the key growth drivers and market challenges?
-
Increasing demand for enhanced customer service in businesses, Increasing concerns about data security
-
-
Who are the major players in the Intelligent Virtual Assistant Market?
-
Ada Health GmbH, Amazon.com Inc., Anboto Europe SL Co., Apple Inc., Baidu Inc., Creative Virtual Ltd., eGain Corp., Google LLC, Inbenta Holdings Inc., Infermedica Sp. z o.o., Interactions LLC, International Business Machines Corp., Microsoft Corp., Nuance Communications Inc., Oracle Corp., Orbita Inc., Samsung Electronics Co. Ltd., Sense.ly Corp., True Image Interactive Inc., and Verint Systems Inc.
-
We can help! Our analysts can customize this intelligent virtual assistant market research report to meet your requirements.
 RIA -
RIA - 
