Reciprocating Compressor Market Size 2026-2030
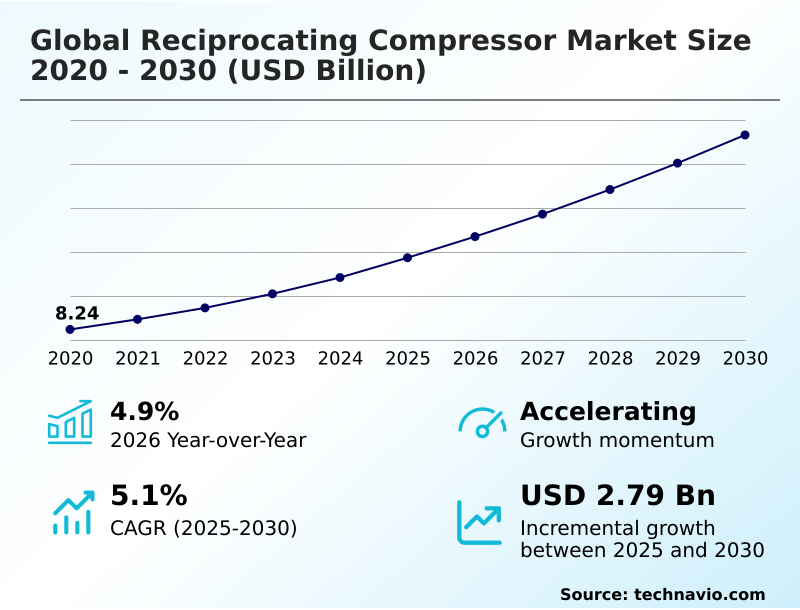
The reciprocating compressor market size is valued to increase by USD 2.79 billion, at a CAGR of 5.1% from 2025 to 2030. Accelerated expansion of global hydrogen infrastructure and processing facilities will drive the reciprocating compressor market.
Major Market Trends & Insights
- APAC dominated the market and accounted for a 45.1% growth during the forecast period.
- By Product - Lubricated segment was valued at USD 6.17 billion in 2024
- By End-user - Oil and gas segment accounted for the largest market revenue share in 2024
Market Size & Forecast
- Market Opportunities: USD 4.42 billion
- Market Future Opportunities: USD 2.79 billion
- CAGR from 2025 to 2030 : 5.1%
Market Summary
- The reciprocating compressor market is integral to heavy industry, defined by the essential role of these positive displacement devices in achieving high-pressure gas compression. These machines, which use a crankshaft-driven piston mechanism, are fundamental to operations in petroleum refining, natural gas transportation, and chemical processing. Market dynamics are increasingly shaped by a dual focus on operational efficiency and environmental compliance.
- A key driver is the expansion of energy infrastructure, especially in emerging economies, which requires robust equipment for applications like gas gathering and pipeline transmission. Concurrently, a significant trend is the industry's adaptation to the energy transition, with strong demand for compressors capable of handling hydrogen and captured carbon dioxide.
- For instance, a midstream gas company can leverage predictive maintenance algorithms integrated into its compressor fleet. This allows them to monitor thermodynamic efficiency and component wear in real time, reducing unplanned downtime and optimizing maintenance schedules.
- This proactive approach prevents costly disruptions to their gas transmission network, minimizes fugitive emissions, and ensures compliance with increasingly stringent environmental regulations, showcasing a direct link between technological adoption and operational resilience.
What will be the Size of the Reciprocating Compressor Market during the forecast period?
Get Key Insights on Market Forecast (PDF) Get Free Sample
How is the Reciprocating Compressor Market Segmented?
The reciprocating compressor industry research report provides comprehensive data (region-wise segment analysis), with forecasts and estimates in "USD million" for the period 2026-2030, as well as historical data from 2020-2024 for the following segments.
- Product
- Lubricated
- Oil-free
- End-user
- Oil and gas
- Petrochemicals and chemicals
- Manufacturing
- Power generation
- Others
- Type
- Multi-stage
- Single-stage
- Geography
- APAC
- China
- India
- Japan
- North America
- US
- Canada
- Mexico
- Europe
- Germany
- UK
- France
- Middle East and Africa
- Saudi Arabia
- UAE
- South Africa
- South America
- Brazil
- Argentina
- Colombia
- Rest of World (ROW)
- APAC
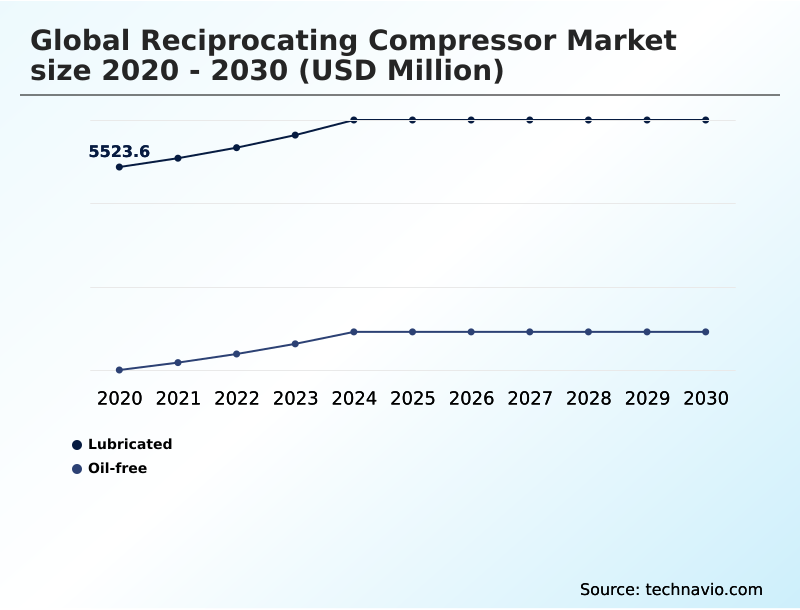
By Product Insights
The lubricated segment is estimated to witness significant growth during the forecast period.
The lubricated segment forms a foundational component of the reciprocating compressor market, where oil is essential for minimizing friction, sealing piston rings and rider bands, and managing thermal loads.
These machines, including both single-stage reciprocating compressor and multi-stage reciprocating units, are indispensable in heavy-duty applications across various process industries.
Their design offers exceptional thermodynamic efficiency and durability, making them a preferred choice for general industrial air compressors and heavy-duty reciprocating compressors. While they require diligent maintenance, their lower initial cost and robust performance ensure continued relevance.
Deployments in sectors like natural gas processing show that proper lubrication management can reduce unscheduled downtime by over 15%, reinforcing their economic viability and strong market position for reciprocating air compressors.
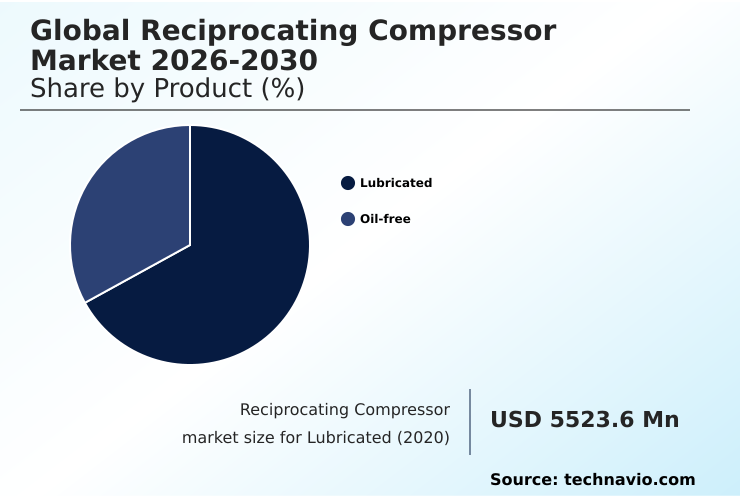
The Lubricated segment was valued at USD 6.17 billion in 2024 and showed a gradual increase during the forecast period.
Regional Analysis
APAC is estimated to contribute 45.1% to the growth of the global market during the forecast period.Technavio’s analysts have elaborately explained the regional trends and drivers that shape the market during the forecast period.
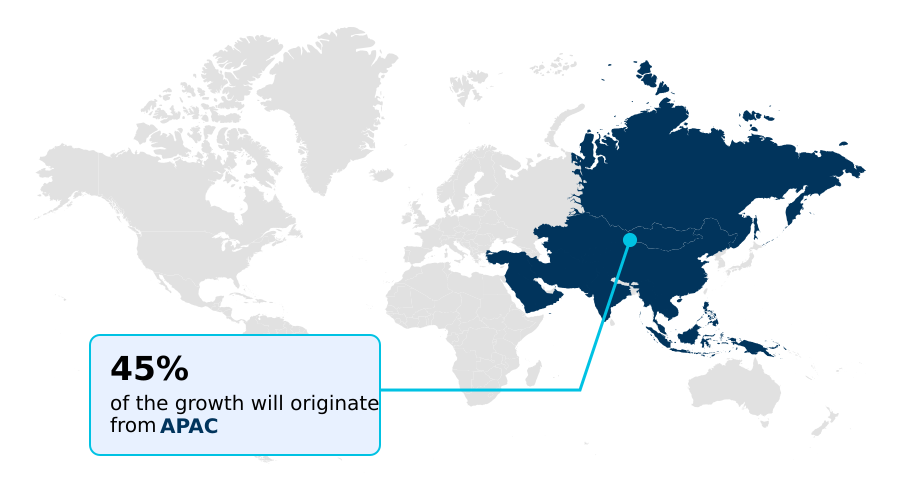
See How Reciprocating Compressor Market Demand is Rising in APAC Get Free Sample
The geographic landscape is dominated by the APAC region, which accounts for over 45% of the market's incremental growth. This is driven by rapid industrialization and massive investments in energy infrastructure, from gas gathering to pipeline transmission.
The demand for positive displacement devices, specifically the crankshaft-driven piston type, is immense. Both industrial air compressors and heavy-duty reciprocating compressors are seeing high adoption.
Advanced features like stepless capacity control are becoming critical to managing energy costs in new facilities, where thermodynamic efficiency is paramount.
For instance, new natural gas compressors in the region have demonstrated up to a 10% improvement in energy efficiency over older models.
The region's focus on expanding LNG capabilities also boosts demand for specialized boil-off gas compressors and robust reciprocating compressor systems.
Market Dynamics
Our researchers analyzed the data with 2025 as the base year, along with the key drivers, trends, and challenges. A holistic analysis of drivers will help companies refine their marketing strategies to gain a competitive advantage.
- Strategic decision-making in the industry hinges on a detailed understanding of diverse applications, from reciprocating compressors for hydrogen applications to reciprocating compressors for carbon capture. The selection process requires a thorough reciprocating vs centrifugal compressor analysis, weighing the benefits of each for specific tasks like biogas upgrading with reciprocating units.
- For sectors demanding high purity, oil-free reciprocating compressor maintenance protocols are non-negotiable. Key considerations include the total lifecycle cost of lubricated compressors and the specifics of compressor design for sour gas service, where material resilience is paramount. Optimizing compressor performance with VFDs is a common strategy to enhance energy efficiency in multi-stage compressors.
- Furthermore, achieving API 618 compliance in petrochemicals is a critical requirement. Innovations in digital monitoring of reciprocating compressors and predictive analytics for compressor failure are transforming maintenance protocols for reciprocating units. This digital shift has enabled some operators to reduce diagnostic time by over 50% compared to traditional manual inspections, directly improving operational planning.
- Other critical areas include advanced materials for compressor durability, noise reduction in reciprocating compressors, and effective thermal management in reciprocating compressors. The move toward compact modular skid-mounted compressors addresses the need for rapid deployment, especially in natural gas processing, while managing fugitive emissions from compressors remains a core challenge.
What are the key market drivers leading to the rise in the adoption of Reciprocating Compressor Industry?
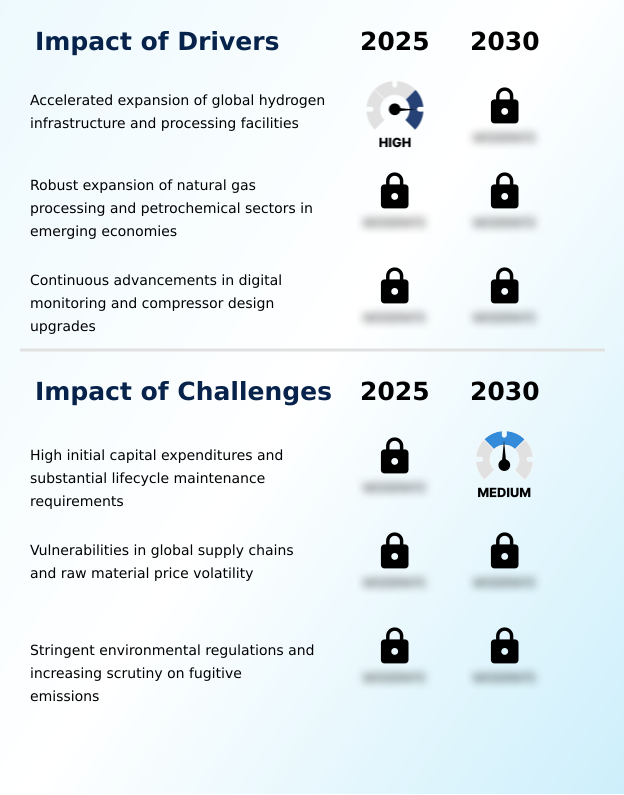
- The accelerated expansion of global hydrogen infrastructure and processing facilities is a key driver propelling market growth for specialized compression technologies.
- The accelerated expansion of hydrogen infrastructure is a primary market driver, demanding specialized gas and process compressors. Reciprocating units are crucial for this transition, requiring solutions that mitigate hydrogen embrittlement through advanced materials and non-lubricated cylinder designs for purity.
- These systems are deployed at hydrogen refueling stations and integrated into the downstream petrochemical industry for desulfurization processes. The need for operational flexibility is met with stepless volume control mechanisms, enhancing industrial gas compression efficiency.
- In related applications like gas gathering, the use of modern boil-off gas compressors has reduced product loss by up to 10%, while advanced hermetic reciprocating compressors in controlled environments achieve a 99.8% containment rate, showcasing significant operational gains.
What are the market trends shaping the Reciprocating Compressor Industry?
- The prominent adoption of carbon capture utilization and storage mechanisms is emerging as a significant trend, influencing equipment design and creating new market opportunities.
- A defining trend is the prominent adoption of carbon capture utilization, creating demand for reciprocating compressor systems designed for unique gas properties. These machines must handle CO2 in supercritical states for injection into carbon sequestration hubs, driving innovation in advanced sealing technologies. This supports the build-out of extensive carbon dioxide transportation networks.
- Simultaneously, the push for zero-emission transportation and robust hydrogen infrastructure is boosting demand for high-pressure hydrogen compressors and API 618 reciprocating compressors at green hydrogen hubs. This trend has led to a 20% improvement in gas transmission efficiency in pilot projects, with some facilities seeing a 25% faster deployment time for new capture units.
What challenges does the Reciprocating Compressor Industry face during its growth?
- High initial capital expenditures and substantial lifecycle maintenance requirements present a key challenge affecting industry growth and broader market adoption.
- Significant challenges in the reciprocating compressor market stem from high initial capital costs and stringent environmental regulations concerning fugitive emissions. Operators must invest in advanced systems to comply, often adopting predictive maintenance algorithms and predictive analytics software to extend equipment life and reduce lifecycle costs. Innovations in polymer compounds for seals are helping reduce leaks, but the financial burden remains.
- In industrial refrigeration, facilities have seen maintenance overheads constitute up to 40% of the total cost of ownership, compared to just 25% for other machinery.
- However, the adoption of modular gas compressor packages and skid-mounted reciprocating compressors for industrial reciprocating compressors is helping reduce installation costs by 15%, offering a partial solution to the high initial investment barrier for these reciprocating variants.
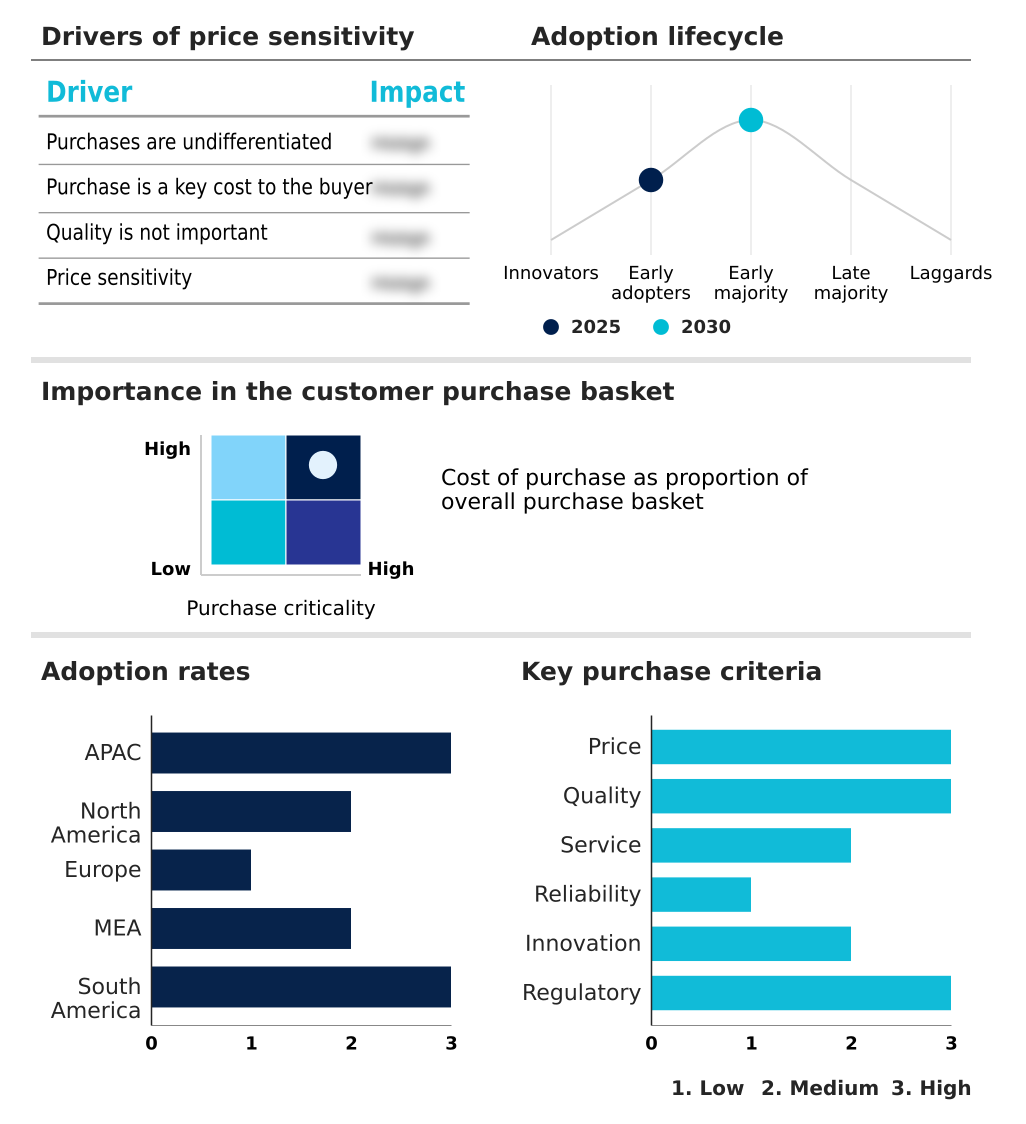
Exclusive Technavio Analysis on Customer Landscape
The reciprocating compressor market forecasting report includes the adoption lifecycle of the market, covering from the innovator’s stage to the laggard’s stage. It focuses on adoption rates in different regions based on penetration. Furthermore, the reciprocating compressor market report also includes key purchase criteria and drivers of price sensitivity to help companies evaluate and develop their market growth analysis strategies.
Customer Landscape of Reciprocating Compressor Industry
Competitive Landscape
Companies are implementing various strategies, such as strategic alliances, reciprocating compressor market forecast, partnerships, mergers and acquisitions, geographical expansion, and product/service launches, to enhance their presence in the industry.
Ariel Corp - Analysts highlight specialization in separable reciprocating gas compressors, crucial for demanding applications in the global energy infrastructure and natural gas processing industries.
The industry research and growth report includes detailed analyses of the competitive landscape of the market and information about key companies, including:
- Ariel Corp
- Atlas Copco AB
- Baker Hughes Co.
- BITZER
- Burckhardt Compression AG
- Chart Industries Inc.
- Copeland LP
- Danfoss AS
- Embraco LLC
- GEA Group AG
- IDEX Corp.
- Ingersoll Rand Inc.
- Kobe Steel Ltd.
- KwangShin Machine Ind.
- MAYEKAWA MFG. Co Ltd
- NEUMAN and ESSER
- Secop GmbH
- SIAD S.p.A.
- Siemens Energy AG
- Tecumseh Products Co. LLC
Qualitative and quantitative analysis of companies has been conducted to help clients understand the wider business environment as well as the strengths and weaknesses of key industry players. Data is qualitatively analyzed to categorize companies as pure play, category-focused, industry-focused, and diversified; it is quantitatively analyzed to categorize companies as dominant, leading, strong, tentative, and weak.
Recent Development and News in Reciprocating compressor market
- In January 2025, Cooper Machinery Services announced the acquisition of ACI Services Inc., a move aimed at strengthening its engineering, maintenance, and reliability solutions for reciprocating compressors in the oil and gas and process industries.
- In September 2025, OJUS Power and Technologies formed a strategic partnership with Hitachi Industrial Equipment Systems to introduce a new range of industrial compressors in India, targeting sectors such as pharmaceuticals, automotive, and food processing.
- In July 2025, Ingersoll Rand announced the acquisition of TMIC and Adicomp for approximately USD 170 million to bolster its industrial gas compression portfolio, with a focus on energy transition applications like hydrogen and biomethane.
- In September 2025, Burckhardt Compression acquired Advanced Compressor Technology (ACT) in the United States to expand its local aftermarket services, spare parts manufacturing, and maintenance support for reciprocating compressors in the refinery and petrochemical sectors.
Dive into Technavio’s robust research methodology, blending expert interviews, extensive data synthesis, and validated models for unparalleled Reciprocating Compressor Market insights. See full methodology.
| Market Scope | |
|---|---|
| Page number | 302 |
| Base year | 2025 |
| Historic period | 2020-2024 |
| Forecast period | 2026-2030 |
| Growth momentum & CAGR | Accelerate at a CAGR of 5.1% |
| Market growth 2026-2030 | USD 2793.0 million |
| Market structure | Fragmented |
| YoY growth 2025-2026(%) | 4.9% |
| Key countries | China, India, Japan, South Korea, Australia, Indonesia, US, Canada, Mexico, Germany, UK, France, Italy, Spain, The Netherlands, Saudi Arabia, UAE, South Africa, Turkey, Israel, Brazil, Argentina and Colombia |
| Competitive landscape | Leading Companies, Market Positioning of Companies, Competitive Strategies, and Industry Risks |
Research Analyst Overview
- The market is defined by the critical function of the positive displacement device, specifically the crankshaft-driven piston model, across industrial applications. A significant focus is on enhancing thermodynamic efficiency and developing advanced sealing technologies to mitigate risks like hydrogen embrittlement.
- The adoption of non-lubricated cylinder designs is pivotal for industries requiring gas purity, while innovations in polymer compounds for piston rings and rider bands extend equipment life. We observe a clear trend towards digitalization, with predictive maintenance algorithms becoming standard. Stepless capacity control and stepless volume control mechanisms are key for managing variable loads efficiently.
- The industry is also responding to new demands from the energy transition, engineering API 618 reciprocating compressors for carbon dioxide transportation networks and high-pressure hydrogen compressors for green energy projects. For example, deploying advanced process gas compressors with integrated digital twins has been shown to reduce commissioning time by up to 30%.
- This shift impacts everything from single-stage and multi-stage reciprocating units to specialized boil-off gas compressors, hermetic, and semi-hermetic reciprocating compressors for industrial air compressors.
What are the Key Data Covered in this Reciprocating Compressor Market Research and Growth Report?
-
What is the expected growth of the Reciprocating Compressor Market between 2026 and 2030?
-
USD 2.79 billion, at a CAGR of 5.1%
-
-
What segmentation does the market report cover?
-
The report is segmented by Product (Lubricated, and Oil-free), End-user (Oil and gas, Petrochemicals and chemicals, Manufacturing, Power generation, and Others), Type (Multi-stage, and Single-stage) and Geography (APAC, North America, Europe, Middle East and Africa, South America)
-
-
Which regions are analyzed in the report?
-
APAC, North America, Europe, Middle East and Africa and South America
-
-
What are the key growth drivers and market challenges?
-
Accelerated expansion of global hydrogen infrastructure and processing facilities, High initial capital expenditures and substantial lifecycle maintenance requirements
-
-
Who are the major players in the Reciprocating Compressor Market?
-
Ariel Corp, Atlas Copco AB, Baker Hughes Co., BITZER, Burckhardt Compression AG, Chart Industries Inc., Copeland LP, Danfoss AS, Embraco LLC, GEA Group AG, IDEX Corp., Ingersoll Rand Inc., Kobe Steel Ltd., KwangShin Machine Ind., MAYEKAWA MFG. Co Ltd, NEUMAN and ESSER, Secop GmbH, SIAD S.p.A., Siemens Energy AG and Tecumseh Products Co. LLC
-
Market Research Insights
- Market dynamics are heavily influenced by the expansion of hydrogen infrastructure and the need for advanced gas compressor packages. In the downstream petrochemical industry, new reciprocating compressor systems have enabled process intensification, leading to a 15% increase in production yields.
- The adoption of predictive analytics software for gas compression systems has proven to reduce unscheduled maintenance by up to 30%, a significant improvement in operational uptime. Furthermore, in industrial refrigeration, modern compressors are delivering a 12% improvement in energy efficiency over five-year-old models, directly impacting bottom-line costs and supporting sustainability goals across various process industries.
We can help! Our analysts can customize this reciprocating compressor market research report to meet your requirements.
 RIA -
RIA - 
