Industrial Refrigeration Market Size 2025-2029
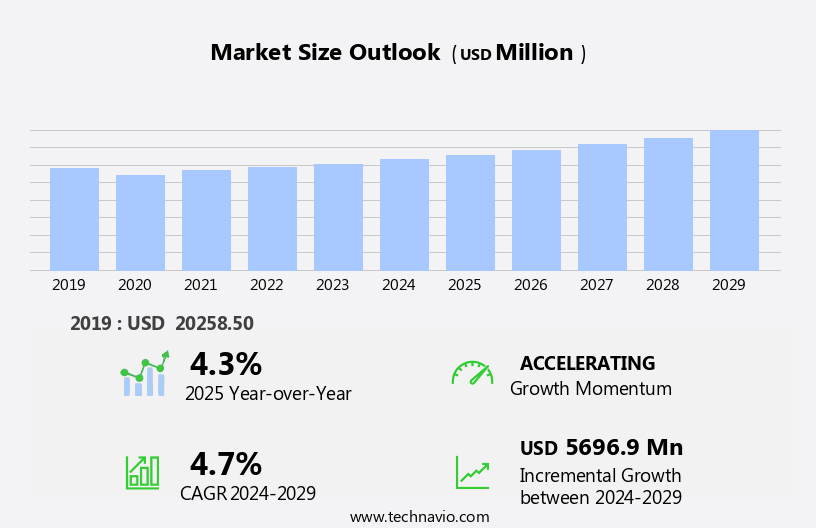
The industrial refrigeration market size is forecast to increase by USD 5.7 billion at a CAGR of 4.7% between 2024 and 2029.
- The market is experiencing significant growth, driven primarily by the rapid industrialization in emerging economies. This trend is expected to continue as these regions invest in infrastructure development and expand their manufacturing sectors. Another key driver for the market is the increasing number of mergers and acquisitions among industry players, leading to consolidation and increased competition. Technological advancements, such as big data, AI, and machine learning (ML), are revolutionizing industrial refrigeration systems, enhancing efficiency and optimizing performance. However, the market also faces challenges from stringent environmental regulations, which are becoming increasingly more rigorous in many regions. These regulations require companies to adopt more sustainable refrigeration technologies and reduce their carbon footprint, presenting both opportunities and obstacles for market participants.
- Companies seeking to capitalize on market opportunities should focus on developing innovative, eco-friendly refrigeration solutions, while also navigating the complex regulatory landscape to ensure compliance. Effective strategic planning and operational flexibility will be essential for companies looking to succeed in this dynamic market.
What will be the Size of the Industrial Refrigeration Market during the forecast period?
- The market continues to evolve, driven by the diverse demands of various sectors. Refrigeration capacity and humidity control are essential for cold storage applications in food processing and pharmaceutical manufacturing, where product quality is paramount. In data centers, precise temperature control is crucial for maintaining optimal operating conditions. Centrifugal and scroll chillers, powered by energy-efficient variable speed drives, dominate the market. Energy management systems and smart refrigeration solutions are increasingly integrated, optimizing performance and reducing emissions. artificial intelligence (AI) and remote monitoring enable predictive maintenance, ensuring uninterrupted operations. Chemical processing and industrial freezing applications rely on a range of refrigeration technologies, including ammonia and CO2 refrigeration, absorption chillers, and reciprocating chillers.
- Heat pumps and cooling water systems offer additional efficiency gains. Quick freezing and blast freezing require specialized evaporator designs and temperature control systems. Process cooling applications benefit from plate heat exchangers and cooling towers. Refrigerant management, including recovery and recycling, is a critical concern for sustainability and cost savings. Fan systems ensure efficient heat rejection, while compressor types cater to varying application requirements. Food safety and leak detection systems are essential for maintaining regulatory compliance. The market's continuous dynamism reflects the evolving needs of its diverse applications, from food processing to data centers, pharmaceutical manufacturing, and beyond.
How is this Industrial Refrigeration Industry segmented?
The industrial refrigeration industry research report provides comprehensive data (region-wise segment analysis), with forecasts and estimates in "USD million" for the period 2025-2029, as well as historical data from 2019-2023 for the following segments.
- Component
- Compressor
- Evaporator
- Condenser
- Control
- Others
- Type
- Ammonia
- CO2
- Others
- Application
- Fruit and vegetable processing
- Refrigerated warehouse
- Capacity
- Less than 100kW
- 100-500kW
- 500-1000kW
- 1000-5000kW
- More than 5000kW
- Geography
- North America
- US
- Canada
- Europe
- France
- Germany
- Italy
- The Netherlands
- UK
- APAC
- China
- India
- South America
- Brazil
- Middle East and Africa
- UAE
- Rest of World (ROW)
- North America
By Component Insights
The compressor segment is estimated to witness significant growth during the forecast period.
Industrial refrigeration systems play a crucial role in various sectors, including food processing, pharmaceutical manufacturing, data centers, and cold storage. Thermal energy storage and quick freezing are essential processes in these systems, requiring advanced technologies such as CO2 refrigeration and ammonia refrigeration. Compressors, a vital component, come in various types, including reciprocating, screw, centrifugal, and scroll compressors. Reciprocating compressors, popular in cold storage and food processing, use pistons driven by a crankshaft to compress refrigerant gas. Key players in this segment include Bitzer, Johnson Controls, and GEA Group, offering solutions compatible with different refrigerants. Screw compressors, known for their energy efficiency, are widely used in large-scale industrial applications.
Variable speed drives and temperature control systems ensure optimal performance and energy savings. Smart refrigeration and energy management systems enable predictive maintenance and remote monitoring, enhancing system reliability and reducing downtime. Cooling water systems, heat pumps, and refrigerant management systems are other essential components, ensuring efficient heat rejection and refrigerant circulation. Absorption chillers, an eco-friendly alternative, use thermal energy to generate chilled water. Humidity control and blast freezing are crucial for maintaining product quality in specific applications. Food safety, emissions reduction, and refrigerant charge management are critical considerations in the market. Plate heat exchangers and cooling towers facilitate efficient heat transfer, while fan systems and evaporator designs optimize cooling capacity.
Air-cooled condensers and water-cooled condensers cater to different cooling requirements. Artificial intelligence (AI) and cloud computing technologies are revolutionizing industrial refrigeration systems, improving refrigeration efficiency and enabling real-time monitoring and analysis. Leak detection systems ensure safety and minimize refrigerant losses. The market continues to evolve, focusing on energy efficiency, food safety, and sustainability.
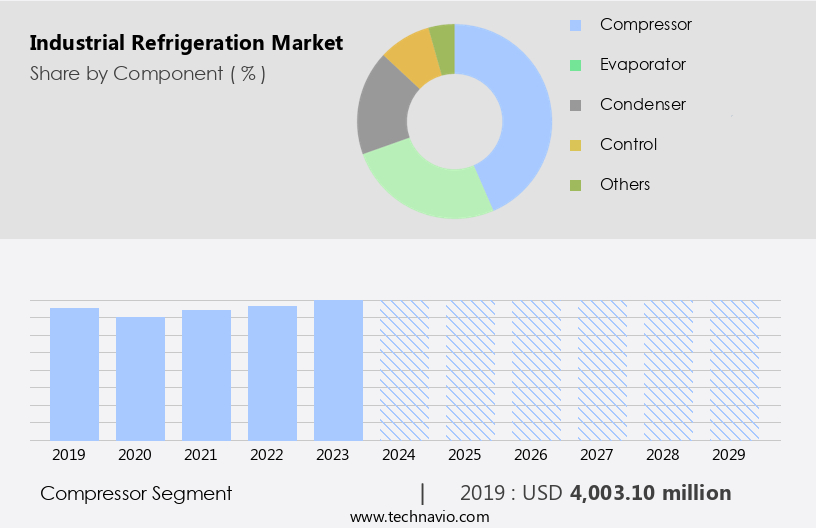
The Compressor segment was valued at USD 4 billion in 2019 and showed a gradual increase during the forecast period.
Regional Analysis
North America is estimated to contribute 45% to the growth of the global market during the forecast period.Technavio's analysts have elaborately explained the regional trends and drivers that shape the market during the forecast period.
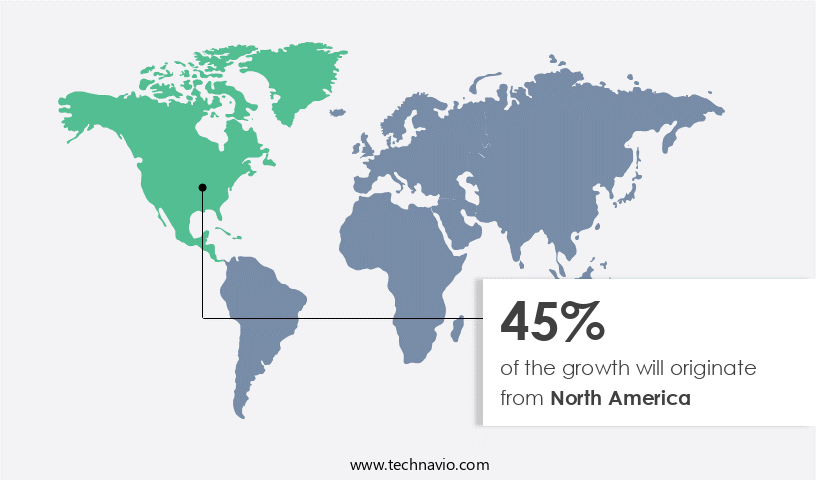
The market in North America, with a significant presence in the US, is a crucial segment of the global industry. Driven by advanced cold chain infrastructure, major food processing industries, and sophisticated pharmaceutical storage solutions, the US dominates this market. In the US, the cold storage and logistics sector plays a pivotal role, with major players like Americold, Lineage Logistics, and United States Cold Storage operating extensive refrigerated warehouse networks. These facilities ensure the safe and high-quality transportation and storage of perishable goods, which is essential for the food processing industry's success. With over 42,700 food and beverage processing establishments as of 2023, the industry's scale is evident.
In the realm of refrigeration technologies, CO2 refrigeration and ammonia refrigeration are gaining popularity due to their energy efficiency and environmental benefits. Smart refrigeration systems, incorporating energy management systems, variable speed drives, and remote monitoring, are increasingly being adopted for their ability to optimize energy usage and reduce emissions. Additionally, the use of compressor types like screw chillers, centrifugal chillers, and scroll chillers, along with absorption chillers, contributes to the market's growth. Chemical processing industries rely on industrial freezing and quick freezing for their operations, while pharmaceutical manufacturing requires precise temperature control for product quality. Humidity control is essential for various applications, including food processing and data centers.
Heat pumps and cooling water systems are integral components of the industrial refrigeration landscape, while refrigerant management and refrigerant recycling are crucial for sustainability. Energy efficiency is a significant concern, with artificial intelligence (AI) and cloud computing playing a role in optimizing refrigeration systems' performance. Heat rejection and emissions reduction are essential considerations for environmentally conscious operations. Leak detection and refrigerant charge management are essential for maintaining system efficiency and safety. frozen food storage is a substantial application area, with refrigeration capacity a key factor in meeting the growing demand for convenient and long-lasting food products. Food safety is paramount, with blast freezing and temperature control essential for maintaining product quality.
Cooling capacity is a critical consideration for various industries, including data centers and pharmaceutical manufacturing. In conclusion, the market in North America is a dynamic and evolving landscape, driven by the cold storage and logistics sector, advanced technologies, and the growing demand for energy efficiency and sustainability. Companies operating in this market must stay abreast of the latest trends and technologies to remain competitive.
Market Dynamics
The Industrial Refrigeration Market is propelled by industrial refrigeration market trends emphasizing energy-efficient refrigeration systems and natural refrigerants like ammonia refrigeration systems and CO2 refrigeration technology. IoT in refrigeration and AI refrigeration solutions drive refrigeration system automation, enhancing cold chain logistics for e-commerce cold chain and pharmaceutical cold storage. Food safety regulations and rising refrigeration maintenance costs boost demand for sustainable cooling solutions. The refrigeration market forecast predicts strong growth, fueled by innovations addressing efficiency and environmental concerns.
Our researchers analyzed the data with 2024 as the base year, along with the key drivers, trends, and challenges. A holistic analysis of drivers will help companies refine their marketing strategies to gain a competitive advantage.
What are the key market drivers leading to the rise in the adoption of Industrial Refrigeration Industry?
- The process of rapid industrialization in emerging markets serves as the primary catalyst for market growth.
- The market is experiencing significant growth due to the rapid industrialization in emerging economies, particularly in China, India, and Brazil. This expansion in the industrial sector, as reported by the National Bureau of Statistics of China with a 5.8% year-on-year increase in industrial production in 2024, is driving the demand for advanced refrigeration solutions. The manufacturing sector, which accounted for a growth rate of 6.1%, is a major contributor to this trend. Refrigeration systems are essential for various manufacturing processes, cold storage, and logistics operations to ensure product quality and safety, especially in sectors like food processing, pharmaceutical manufacturing, and data centers.
- Advanced refrigeration technologies, such as centrifugal and scroll chillers, air-cooled condensers, fan systems, and humidity control solutions, are increasingly being adopted for their energy efficiency and ability to maintain precise temperature and humidity levels. Furthermore, the integration of artificial intelligence (AI) and automation technologies in industrial refrigeration systems is enhancing their performance and reducing operational costs.
What are the market trends shaping the Industrial Refrigeration Industry?
- Mergers and acquisitions are increasingly common in today's market, representing a significant trend in business growth.
- The market is experiencing a notable trend of consolidation, with companies merging to expand their service capabilities, enhance technical expertise, and align with sustainability goals. This dynamic is transforming the market, enabling organizations to provide more comprehensive and advanced refrigeration solutions. For instance, on April 12, 2023, Daikin Applied Europe S.P.A, a subsidiary of the global Daikin Group, acquired Brooktherm Refrigeration Ltd, a leading industrial refrigeration and HVAC service provider in the UK. This acquisition allows Brooktherm to operate under Daikin Applied (UK) Ltd, thereby strengthening Daikin's service and maintenance capabilities across the UK. The move supports turnkey projects, bespoke maintenance, and a full portfolio of spares, ultimately enhancing the industrial HVAC and refrigeration solutions of Daikin.
- Key trends in the market include the adoption of energy-efficient technologies such as evaporator design innovations, cooling towers, plate heat exchangers, and water-cooled condensers. Additionally, there is a growing emphasis on emissions reduction, refrigerant charge optimization, refrigeration efficiency improvements, heat rejection techniques, food safety, leak detection, and cloud computing for remote monitoring and predictive maintenance.
What challenges does the Industrial Refrigeration Industry face during its growth?
- Strict environmental regulations pose a significant challenge to the industry's growth. By implementing sustainable business practices and adhering to regulatory requirements, companies can mitigate this challenge and foster long-term success.
- The market is facing increasing regulatory pressure to reduce the environmental impact of refrigerants. Governments and regulatory bodies worldwide are implementing policies to phase out high-global warming potential (GWP) refrigerants such as hydrofluorocarbons (HFCs) and chlorofluorocarbons (CFCs). One notable regulation is the Kigali Amendment to the Montreal Protocol, which mandates a 85% reduction of HFC consumption by 2047 in participating countries. This regulation has led industries in sectors like food processing, cold storage, and pharmaceuticals to transition towards low-GWP alternatives such as ammonia (NH3), carbon dioxide (CO2), and hydrocarbons.
- The shift towards natural refrigerants and energy-efficient systems is a significant trend in the market, driven by growing environmental concerns and regulatory compliance.
Exclusive Customer Landscape
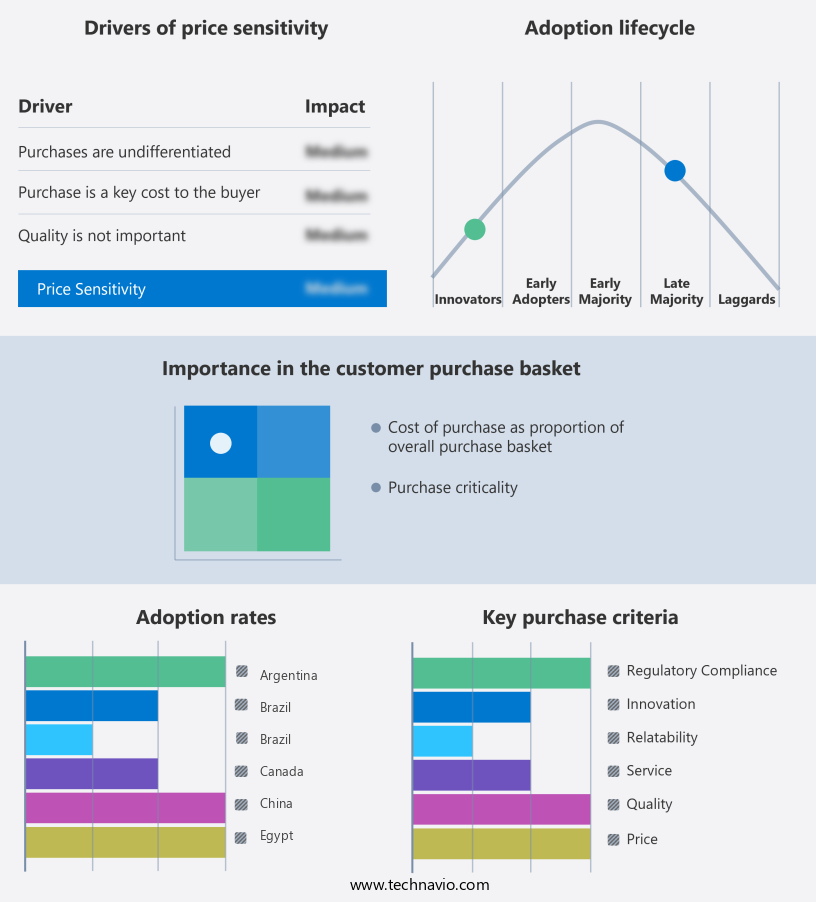
The industrial refrigeration market forecasting report includes the adoption lifecycle of the market, covering from the innovator's stage to the laggard's stage. It focuses on adoption rates in different regions based on penetration. Furthermore, the industrial refrigeration market report also includes key purchase criteria and drivers of price sensitivity to help companies evaluate and develop their market growth analysis strategies.
Customer Landscape
Key Companies & Market Insights
Companies are implementing various strategies, such as strategic alliances, industrial refrigeration market forecast, partnerships, mergers and acquisitions, geographical expansion, and product/service launches, to enhance their presence in the industry.
Baltimore Aircoil Company Inc. - This company specializes in designing and implementing advanced industrial refrigeration systems.
The industry research and growth report includes detailed analyses of the competitive landscape of the market and information about key companies, including:
- Baltimore Aircoil Company Inc.
- Bitzer Group
- Carrier Global Corporation
- Daikin Industries Ltd.
- Danfoss A/S
- Dorin S.p.A.
- Dover Corporation
- Emerson Electric Co.
- EVAPCO Inc.
- Frick 1 India Ltd.
- GEA Group AG
- Hussmann Corporation
- Ingersoll Rand Inc.
- Johnson Controls International plc
- Kirby HVAC&R Pty Ltd.
- LU-VE Group
- Mayekawa Mfg. Co. Ltd.
- Munters
- Rivacold srl
- Swegon AB
Qualitative and quantitative analysis of companies has been conducted to help clients understand the wider business environment as well as the strengths and weaknesses of key industry players. Data is qualitatively analyzed to categorize companies as pure play, category-focused, industry-focused, and diversified; it is quantitatively analyzed to categorize companies as dominant, leading, strong, tentative, and weak.
Recent Development and News in Industrial Refrigeration Market
- In February 2023, Carrier Global Corporation, a leading HVAC, refrigeration, and building automation technology provider, introduced its new AquaEdge 19DV centrifugal chiller, designed specifically for industrial refrigeration applications (Carrier Global Corporation Press Release, 2023). This innovative chiller is expected to deliver up to 20% greater cooling capacity and 10% lower energy consumption compared to previous models, addressing the growing demand for energy-efficient solutions in the industrial refrigeration sector (Carrier Global Corporation, 2023).
- In October 2024, Danfoss, a leading manufacturer of industrial components and solutions, announced a strategic partnership with Microsoft to develop digital solutions for the market (Danfoss Press Release, 2024). This collaboration aims to leverage Microsoft's Azure IoT and AI capabilities to create advanced, data-driven solutions for optimizing energy consumption, predicting maintenance needs, and improving overall operational efficiency in industrial refrigeration systems.
- In January 2025, Emerson, a technology and engineering company, completed the acquisition of AspenTech, a leading software supplier for process industries, for approximately USD 11 billion (Emerson Press Release, 2025). This acquisition is expected to significantly expand Emerson's capabilities in digital transformation and automation solutions for the market, enabling the company to offer more comprehensive, end-to-end solutions for optimizing energy usage, improving operational efficiency, and enhancing overall performance.
- In March 2025, the European Union passed the F-Gas Regulation amendment, which sets stricter emission limits for fluorinated greenhouse gases (F-Gases), commonly used in industrial refrigeration systems (European Commission, 2025). The new regulation aims to reduce the EU's greenhouse gas emissions by 75% by 2030, compared to 2015 levels, and will significantly impact the market as manufacturers and operators will need to adopt more energy-efficient and low-emission technologies to meet the new regulations.
Research Analyst Overview
The market is driven by various factors, including code compliance with food safety standards and safety regulations. To minimize lifecycle costs, companies are increasingly adopting system optimization through refrigeration controls, predictive modeling, and remote diagnostics. renewable energy integration and smart grid connection are key trends, enabling energy savings and carbon footprint reduction. Industry standards mandate thermal design, energy audits, and the use of low-gwp refrigerants.
Building automation systems and district cooling are also gaining popularity for process optimization and performance benchmarking. Regulatory compliance, environmental impact assessment, and maintenance agreements are essential for sustainable operations. Refrigeration engineering and digital twins facilitate system efficiency and enable real-time monitoring and analysis of data.
Dive into Technavio's robust research methodology, blending expert interviews, extensive data synthesis, and validated models for unparalleled Industrial Refrigeration Market insights. See full methodology.
|
Market Scope |
|
|
Report Coverage |
Details |
|
Page number |
255 |
|
Base year |
2024 |
|
Historic period |
2019-2023 |
|
Forecast period |
2025-2029 |
|
Growth momentum & CAGR |
Accelerate at a CAGR of 4.7% |
|
Market growth 2025-2029 |
USD 5696.9 million |
|
Market structure |
Fragmented |
|
YoY growth 2024-2025(%) |
4.3 |
|
Key countries |
US, China, Germany, Canada, UK, France, Italy, India, The Netherlands, and Brazil |
|
Competitive landscape |
Leading Companies, Market Positioning of Companies, Competitive Strategies, and Industry Risks |
What are the Key Data Covered in this Industrial Refrigeration Market Research and Growth Report?
- CAGR of the Industrial Refrigeration industry during the forecast period
- Detailed information on factors that will drive the growth and forecasting between 2025 and 2029
- Precise estimation of the size of the market and its contribution of the industry in focus to the parent market
- Accurate predictions about upcoming growth and trends and changes in consumer behaviour
- Growth of the market across North America, Europe, APAC, Middle East and Africa, and South America
- Thorough analysis of the market's competitive landscape and detailed information about companies
- Comprehensive analysis of factors that will challenge the industrial refrigeration market growth of industry companies
We can help! Our analysts can customize this industrial refrigeration market research report to meet your requirements.
 RIA -
RIA - 
