Recording Chart Paper Market Analysis North America, Europe, Asia, Rest of World (ROW) - US, Canada, UK, Germany, China - Size and Forecast 2024-2028

Recording Chart Paper Market Analysis North America, Europe, Asia, Rest of World (ROW) - US, Canada, UK, Germany, China - Size and Forecast 2024-2028

Published: Mar 2024 154 Pages SKU: IRTNTR77688

Market Overview at a Glance

$753.71 Mn
Market Opportunity
6.01%
CAGR
5.39
YoY growth 2023-2024(%)

Recording Chart Paper Market Size 2024-2028

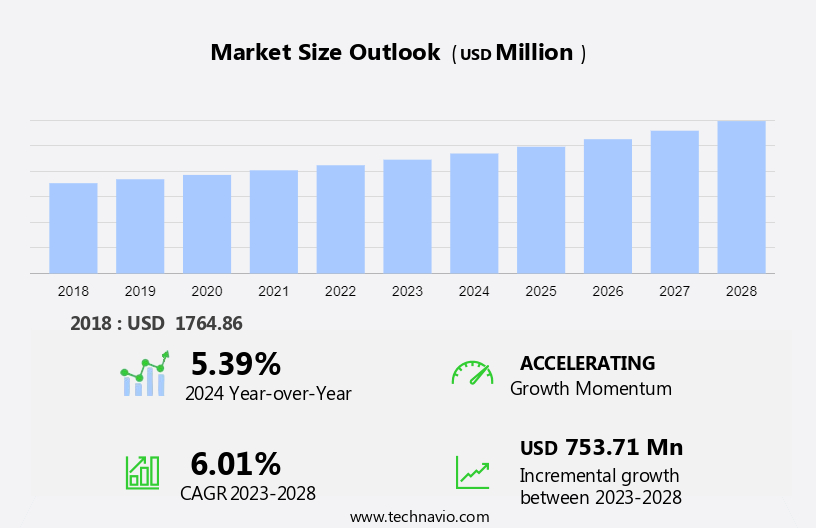
The recording chart paper market size is forecast to increase by USD 753.71 million at a CAGR of 6.01% between 2023 and 2028.

  • The market is witnessing significant growth due to several key trends. The increasing adoption of automated systems across various industries is driving market growth. Automation in the healthcare, finance, and education sectors is leading to the replacement of traditional paper-based recording methods with digital alternatives. Another major trend is the increasing adoption of digital healthcare services, which is expected to boost the demand for electronic health records and digital chart papers. The internet has also facilitated remote patient monitoring and telemedicine, further expanding the market's scope. However, there are challenges that could hinder market growth. Resistance to change and reliance on traditional paper-based recording methods remain prevalent, particularly in certain industries and regions. Ensuring data security and privacy in digital recording systems is also a significant challenge that needs to be addressed to gain widespread acceptance.

What will be the Size of the Recording Chart Paper Market During the Forecast Period?

Recording Chart Paper Market Size

 Request Free Sample

  • The market encompasses a range of products utilized in various healthcare facilities, including hospitals, diagnostic centers, clinics, labs, and diagnostic centres, for documenting and analyzing vital signs and physiological characteristics of patients. These charts are integral to cardiovascular disease management, with an estimated 17.9 million CVD deaths worldwide each year, necessitating constant monitoring for heart attacks and strokes. The market is driven by the growing geriatric population, who are more susceptible to cardiovascular conditions. Digital monitoring devices, such as ultrasound transducers and digital ECG sheets, are increasingly replacing traditional printed documents due to their convenience and accuracy.
  • Medical instruments and gadgets, including chart sheets for electrocardiography (ECG) and electroencephalography (EEG) papers, remain essential tools for healthcare professionals in managing and documenting patients' medical states.

How is this Recording Chart Paper Industry segmented and which is the largest segment?

The recording chart paper industry research report provides comprehensive data (region-wise segment analysis), with forecasts and estimates in "USD million" for the period 2024-2028, as well as historical data from 2018-2022 for the following segments.

  • Application
    • Hospitals
    • Diagnostic centers
    • Clinics
  • Type
    • Cardiology monitoring recording
    • Ambulatory and EMS recording
    • Ultrasound and OB-GYN recording
    • Fetal monitoring recording
  • Geography
    • North America
      • Canada
      • US
    • Europe
      • Germany
      • UK
    • Asia
      • China
    • Rest of World (ROW)

By Application Insights

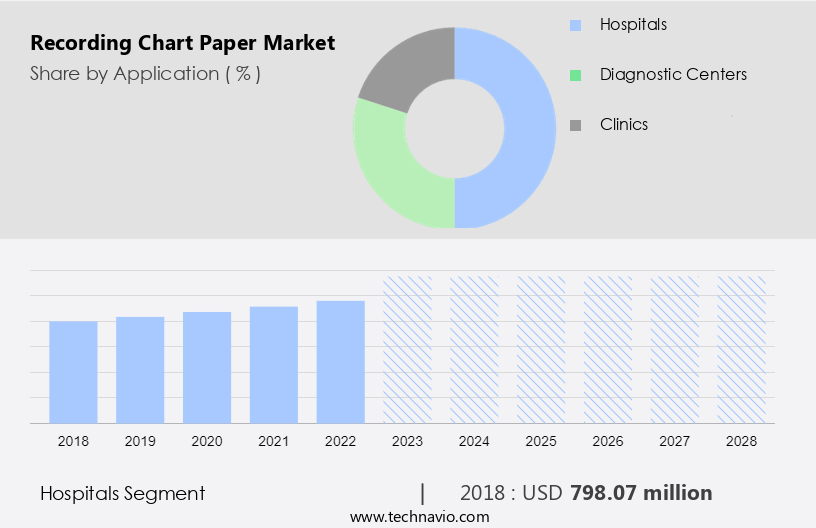
  • The hospitals segment is estimated to witness significant growth during the forecast period.

In the healthcare industry, chart paper plays a significant role in various medical departments and devices. In cardiology, it is used in electrocardiography (ECG) machines to document heart activity, contributing to the diagnosis and monitoring of cardiovascular diseases, including heart attacks and strokes. Neurology departments employ chart paper in electroencephalography (EEG) devices to measure brain electrical activity, essential for diagnosing conditions like epilepsy and other neurological disorders. Respiratory care units utilize chart paper in spirometry equipment for pulmonary function tests, aiding In the diagnosis of respiratory diseases such as asthma and Chronic Obstructive Pulmonary Disease (COPD). Surgical suites incorporate chart paper in anesthesia monitors to record vital signs during procedures, ensuring patient safety.

Recording Chart Paper Market Size

Get a glance at the Recording Chart Paper Industry report of share of various segments Request Free Sample

The hospitals segment was valued at USD 798.07 million in 2018 and showed a gradual increase during the forecast period.

Regional Analysis

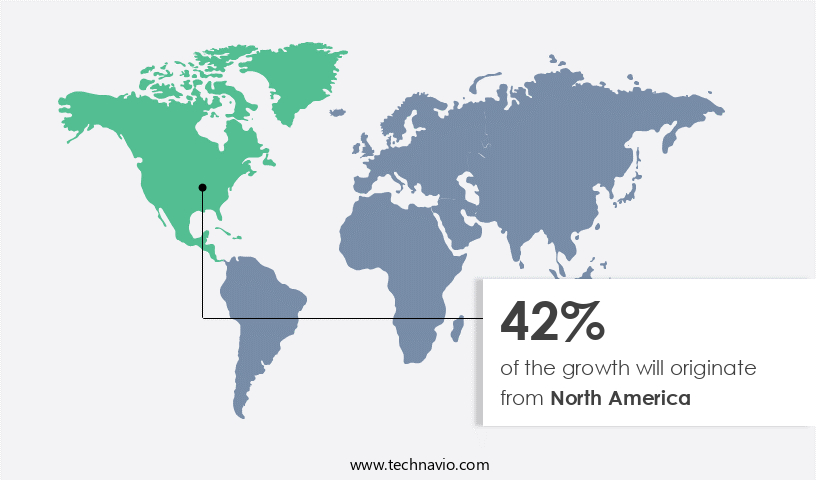
  • North America is estimated to contribute 42% to the growth of the global market during the forecast period.

Technavio's analysts have elaborately explained the regional trends and drivers that shape the market during the forecast period.

Recording Chart Paper Market Share by Geography

For more insights on the market share of various regions, Request Free Sample

The North American market holds a substantial share In the market due to advanced healthcare infrastructure, technological innovations, an aging population, and rising fertility rates. Cardiovascular diseases, including heart attacks and strokes, are major health concerns, driving the demand for recording chart papers in this region. Favorable government policies and research collaborations are expected to boost market growth, given the developed healthcare sector, high patient and birth rates, and supportive healthcare policies. Key applications include fetal monitoring, geriatric population care, and digital monitoring devices. Ultrasound transducers, hospitals, diagnostic centers, clinics, and healthcare facilities are significant end-users. The United States and Canada are major contributors due to the presence of leading healthcare facilities, research institutions, and investments in healthcare technology.

Market Dynamics

Our researchers analyzed the data with 2023 as the base year, along with the key drivers, trends, and challenges. A holistic analysis of drivers will help companies refine their marketing strategies to gain a competitive advantage.

What are the key market drivers leading to the rise In the adoption of Recording Chart Paper Industry?

Increasing adoption of automated systems across various industries is the key driver of the market.

  • The market experiences significant growth due to the increasing utilization of automated systems across various sectors, including healthcare and manufacturing. In healthcare, automated medical devices and diagnostic equipment generate vast amounts of data, which are logged and analyzed on chart paper for patient monitoring and diagnosis. Cardiovascular diseases, such as heart attacks and strokes, are major applications of recording chart paper in healthcare. The geriatric population and fetal monitoring also contribute to the market's expansion. Digital monitoring devices, including ultrasound transducers, electrocardiography (ECG) sheets, and electroencephalography (EEG) papers, are essential components of healthcare facilities, labs, diagnostic centers, and clinics. The market is further driven by the need to address public health challenges, such as the rising number of CVD deaths, cancer cases, diabetes, and autoimmune illnesses.
  • Healthcare policies and expenditure also play a crucial role in market growth. The market encompasses various diagnostic procedures, including spirometry chart papers, and medical instruments, such as gadgets used for physiological characteristics monitoring. Overall, the market is a vital component of the healthcare industry, facilitating efficient data collection, analysis, and decision-making.

What are the market trends shaping the Recording Chart Paper Industry?

Increasing adoption of digital healthcare services is the upcoming market trend.

  • The market is driven by the growing adoption of digital healthcare services worldwide. Digital healthcare services encompass various technologies and platforms, including telemedicine, remote patient monitoring, mobile health apps, and electronic health records (EHRs), which necessitate precise and efficient data recording and management. Recording chart systems are essential in facilitating the seamless integration and operation of these digital healthcare services by offering a centralized platform for capturing, storing, and accessing patient data. These systems enable real-time monitoring of patients' health metrics, remote consultations between healthcare providers and patients, and secure sharing of medical information across different healthcare facilities. The increasing prevalence of cardiovascular diseases, such as heart attacks and strokes, among the geriatric population and the high number of births and fetal monitoring requirements further fuel the demand for recording chart paper systems.
  • Additionally, healthcare policies and public health challenges, including the rising number of cancer cases, diabetes, autoimmune illnesses, and milder conditions, necessitate the adoption of advanced medical diagnostic procedures and medical instruments, such as electrocardiography (ECG) sheets, electroencephalography (EEG) papers, and spirometry chart papers. Healthcare expenditure continues to increase as healthcare facilities, including hospitals, diagnostic centers, clinics, labs, and diagnostic centres, invest in medical gadgets and physiological characteristics monitoring solutions, such as ultra-premium ultrasound innovations, to enhance patient care and improve clinical outcomes. The Internet and printed documents, including research papers and industrial magazines, serve as vital resources for healthcare professionals to stay updated on the latest medical advancements and best practices.

What challenges does the Recording Chart Paper Industry face during its growth?

Resistance to change and reliance on traditional paper-based recording is a key challenge affecting the industry growth.

  • The market faces a notable obstacle due to resistance to change and preference for traditional paper-based methods. Despite the advent of digital technology and advanced data management systems, several industries remain hesitant to adopt digital alternatives like chart papers. This reluctance stems from the comfort and familiarity associated with conventional paper-based systems, particularly in industries that have long utilized chart recorders and paper data logging. Transitioning to digital solutions presents challenges such as technology integration, training requirements, and potential disruptions to established workflows. Cardiovascular diseases, including heart attacks and strokes, account for a significant portion of this market. Fetal monitoring, geriatric population care, and healthcare facilities like hospitals, clinics, diagnostic centers, labs, and diagnostic centres, extensively use recording chart papers for various physiological characteristics monitoring.
  • However, the increasing prevalence of cardiovascular diseases, births, and the growing elderly population necessitates innovative solutions to address public health challenges. Digital monitoring devices, such as ultrasound transducers, are gaining traction In the medical diagnostic procedures arena. Ultra-premium ultrasound innovations and medical gadgets are revolutionizing healthcare, offering more accurate and efficient diagnostic procedures. Simultaneously, the rise in chronic conditions like cancer, diabetes, autoimmune illnesses, and milder conditions necessitates increased healthcare expenditure. Healthcare policies and research papers, published in industrial magazines and accessed via the Internet, contribute to the dissemination of knowledge and awareness about the latest medical advancements.

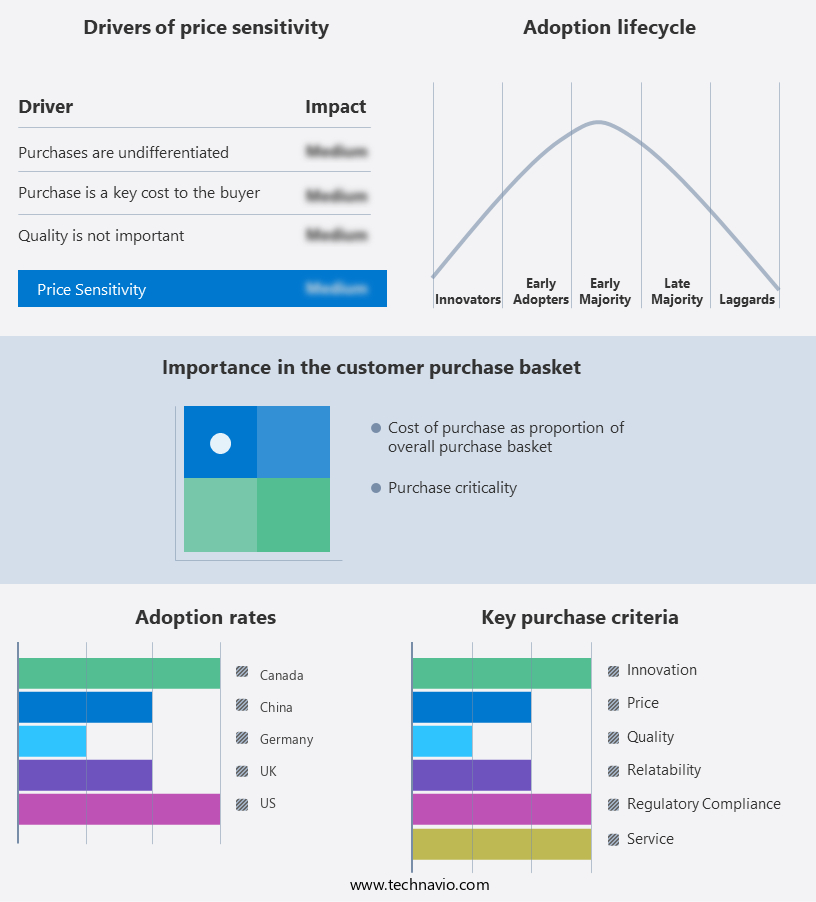
Exclusive Customer Landscape

The recording chart paper market forecasting report includes the adoption lifecycle of the market, covering from the innovator's stage to the laggard's stage. It focuses on adoption rates in different regions based on penetration. Furthermore, the recording chart paper market report also includes key purchase criteria and drivers of price sensitivity to help companies evaluate and develop their market growth analysis strategies.

Recording Chart Paper Market Share by Geography

 Customer Landscape

Key Companies & Market Insights

Companies are implementing various strategies, such as strategic alliances, recording chart paper market forecast, partnerships, mergers and acquisitions, geographical expansion, and product/service launches, to enhance their presence in the industry.

The industry research and growth report includes detailed analyses of the competitive landscape of the market and information about key companies, including:

  • Avantor Inc
  • Cardinal Health Inc.
  • CompareNetworks Inc.
  • Dickson Inc.
  • GeoCorp Inc.
  • Honeywell International Inc.
  • Merck KGaA
  • Precision Charts Inc.
  • Shandong Ultra Paper Co. Ltd.
  • Thermo Fisher Scientific Inc.
  • Yokogawa Electric Corp.

Qualitative and quantitative analysis of companies has been conducted to help clients understand the wider business environment as well as the strengths and weaknesses of key industry players. Data is qualitatively analyzed to categorize companies as pure play, category-focused, industry-focused, and diversified; it is quantitatively analyzed to categorize companies as dominant, leading, strong, tentative, and weak.

Research Analyst Overview

The market encompasses a diverse range of products utilized in various healthcare settings for documenting and analyzing vital health data. These charts serve as essential tools for medical professionals to monitor physiological characteristics and diagnose a multitude of conditions. Heart diseases, including cardiovascular diseases (CVD), remain a significant concern worldwide, leading to a high demand for chart papers in hospitals, diagnostic centers, clinics, and labs. CVDs are responsible for a substantial number of deaths each year, with heart attacks and strokes being among the most common manifestations. The aging population is another crucial factor driving the growth of the chart paper market.

In addition, the elderly population's increased susceptibility to various health conditions necessitates frequent monitoring and documentation. Digital monitoring devices, such as electrocardiography (ECG) sheets and electroencephalography (EEG) papers, have gained popularity due to their convenience and accuracy. Besides cardiovascular diseases, chart papers are also extensively used in obstetrics monitoring solutions for fetal monitoring during pregnancy and childbirth. The fertility rate and births continue to influence the demand for these products, particularly in healthcare facilities. Healthcare policies and public health challenges further contribute to the market's growth. As the need for efficient and accurate diagnostic procedures increases, medical diagnostic procedures rely heavily on chart papers for recording and analyzing data.

Moreover, medical patients with conditions like cancer, Type 2 diabetes, autoimmune illnesses, and milder conditions require continuous monitoring and documentation. The healthcare industry's digital transformation has led to the widespread use of the Internet and printed documents for sharing and accessing medical records. Research papers, industrial magazines, and other publications often feature articles and studies based on data collected using chart papers. The market for chart papers includes various types of medical instruments and gadgets, such as ultrasound transducers, spirometry chart papers, and diagnostic procedures. The market's competitive landscape is diverse, with numerous players offering innovative solutions to cater to the evolving needs of healthcare professionals and patients.

Furthermore, healthcare expenditure continues to rise as the demand for advanced medical technologies and treatments increases. The chart paper market is expected to grow in response to this trend, as these products remain an essential component of healthcare delivery and diagnosis.

Market Scope

Report Coverage

Details

Page number

154

Base year

2023

Historic period

2018-2022

Forecast period

2024-2028

Growth momentum & CAGR

Accelerate at a CAGR of 6.01%

Market growth 2024-2028

USD 753.71 million

Market structure

Concentrated

YoY growth 2023-2024(%)

5.39

Key countries

US, Canada, UK, Germany, and China

Competitive landscape

Leading Companies, market growth and forecasting, Market Positioning of Companies, Competitive Strategies, and Industry Risks

Request Free Sample

What are the Key Data Covered in this Recording Chart Paper Market Research and Growth Report?

  • CAGR of the Recording Chart Paper industry during the forecast period
  • Detailed information on factors that will drive the growth and forecasting between 2024 and 2028
  • Precise estimation of the size of the market and its contribution of the industry in focus to the parent market
  • Accurate predictions about upcoming growth and trends and changes in consumer behaviour
  • Growth of the market across North America, Europe, Asia, and Rest of World (ROW)
  • Thorough analysis of the market's competitive landscape and detailed information about companies
  • Comprehensive analysis of factors that will challenge the recording chart paper market growth of industry companies

We can help! Our analysts can customize this recording chart paper market research report to meet your requirements.

Get in touch

1 Executive Summary

  • 1.1 Market overview
    • Exhibit 01: Executive Summary – Chart on Market Overview
    • Exhibit 02: Executive Summary – Data Table on Market Overview
    • Exhibit 03: Executive Summary – Chart on Global Market Characteristics
    • Exhibit 04: Executive Summary – Chart on Market by Geography
    • Exhibit 05: Executive Summary – Chart on Market Segmentation by Application
    • Exhibit 06: Executive Summary – Chart on Market Segmentation by Type
    • Exhibit 07: Executive Summary – Chart on Incremental Growth
    • Exhibit 08: Executive Summary – Data Table on Incremental Growth
    • Exhibit 09: Executive Summary – Chart on Vendor Market Positioning

2 Market Landscape

  • 2.1 Market ecosystem
    • Exhibit 10: Parent market
    • Exhibit 11: Market Characteristics

3 Market Sizing

  • 3.1 Market definition
    • Exhibit 12: Offerings of vendors included in the market definition
  • 3.2 Market segment analysis
    • Exhibit 13: Market segments
  • 3.3 Market size 2023
    • 3.4 Market outlook: Forecast for 2023-2028
      • Exhibit 14: Chart on Global - Market size and forecast 2023-2028 ($ million)
      • Exhibit 15: Data Table on Global - Market size and forecast 2023-2028 ($ million)
      • Exhibit 16: Chart on Global Market: Year-over-year growth 2023-2028 (%)
      • Exhibit 17: Data Table on Global Market: Year-over-year growth 2023-2028 (%)

    4 Historic Market Size

    • 4.1 Global recording chart paper market 2018 - 2022
      • Exhibit 18: Historic Market Size – Data Table on global recording chart paper market 2018 - 2022 ($ million)
    • 4.2 Application Segment Analysis 2018 - 2022
      • Exhibit 19: Historic Market Size – Application Segment 2018 - 2022 ($ million)
    • 4.3 Type Segment Analysis 2018 - 2022
      • Exhibit 20: Historic Market Size – Type Segment 2018 - 2022 ($ million)
    • 4.4 Geography Segment Analysis 2018 - 2022
      • Exhibit 21: Historic Market Size – Geography Segment 2018 - 2022 ($ million)
    • 4.5 Country Segment Analysis 2018 - 2022
      • Exhibit 22: Historic Market Size – Country Segment 2018 - 2022 ($ million)

    5 Five Forces Analysis

    • 5.1 Five forces summary
      • Exhibit 23: Five forces analysis - Comparison between 2023 and 2028
    • 5.2 Bargaining power of buyers
      • Exhibit 24: Chart on Bargaining power of buyers – Impact of key factors 2023 and 2028
    • 5.3 Bargaining power of suppliers
      • Exhibit 25: Bargaining power of suppliers – Impact of key factors in 2023 and 2028
    • 5.4 Threat of new entrants
      • Exhibit 26: Threat of new entrants – Impact of key factors in 2023 and 2028
    • 5.5 Threat of substitutes
      • Exhibit 27: Threat of substitutes – Impact of key factors in 2023 and 2028
    • 5.6 Threat of rivalry
      • Exhibit 28: Threat of rivalry – Impact of key factors in 2023 and 2028
    • 5.7 Market condition
      • Exhibit 29: Chart on Market condition - Five forces 2023 and 2028

    6 Market Segmentation by Application

    • 6.1 Market segments
      • Exhibit 30: Chart on Application - Market share 2023-2028 (%)
      • Exhibit 31: Data Table on Application - Market share 2023-2028 (%)
    • 6.2 Comparison by Application
      • Exhibit 32: Chart on Comparison by Application
      • Exhibit 33: Data Table on Comparison by Application
    • 6.3 Hospitals - Market size and forecast 2023-2028
      • Exhibit 34: Chart on Hospitals - Market size and forecast 2023-2028 ($ million)
      • Exhibit 35: Data Table on Hospitals - Market size and forecast 2023-2028 ($ million)
      • Exhibit 36: Chart on Hospitals - Year-over-year growth 2023-2028 (%)
      • Exhibit 37: Data Table on Hospitals - Year-over-year growth 2023-2028 (%)
    • 6.4 Diagnostic centers - Market size and forecast 2023-2028
      • Exhibit 38: Chart on Diagnostic centers - Market size and forecast 2023-2028 ($ million)
      • Exhibit 39: Data Table on Diagnostic centers - Market size and forecast 2023-2028 ($ million)
      • Exhibit 40: Chart on Diagnostic centers - Year-over-year growth 2023-2028 (%)
      • Exhibit 41: Data Table on Diagnostic centers - Year-over-year growth 2023-2028 (%)
    • 6.5 Clinics - Market size and forecast 2023-2028
      • Exhibit 42: Chart on Clinics - Market size and forecast 2023-2028 ($ million)
      • Exhibit 43: Data Table on Clinics - Market size and forecast 2023-2028 ($ million)
      • Exhibit 44: Chart on Clinics - Year-over-year growth 2023-2028 (%)
      • Exhibit 45: Data Table on Clinics - Year-over-year growth 2023-2028 (%)
    • 6.6 Market opportunity by Application
      • Exhibit 46: Market opportunity by Application ($ million)
      • Exhibit 47: Data Table on Market opportunity by Application ($ million)

    7 Market Segmentation by Type

    • 7.1 Market segments
      • Exhibit 48: Chart on Type - Market share 2023-2028 (%)
      • Exhibit 49: Data Table on Type - Market share 2023-2028 (%)
    • 7.2 Comparison by Type
      • Exhibit 50: Chart on Comparison by Type
      • Exhibit 51: Data Table on Comparison by Type
    • 7.3 Cardiology monitoring recording - Market size and forecast 2023-2028
      • Exhibit 52: Chart on Cardiology monitoring recording - Market size and forecast 2023-2028 ($ million)
      • Exhibit 53: Data Table on Cardiology monitoring recording - Market size and forecast 2023-2028 ($ million)
      • Exhibit 54: Chart on Cardiology monitoring recording - Year-over-year growth 2023-2028 (%)
      • Exhibit 55: Data Table on Cardiology monitoring recording - Year-over-year growth 2023-2028 (%)
    • 7.4 Ambulatory and EMS recording - Market size and forecast 2023-2028
      • Exhibit 56: Chart on Ambulatory and EMS recording - Market size and forecast 2023-2028 ($ million)
      • Exhibit 57: Data Table on Ambulatory and EMS recording - Market size and forecast 2023-2028 ($ million)
      • Exhibit 58: Chart on Ambulatory and EMS recording - Year-over-year growth 2023-2028 (%)
      • Exhibit 59: Data Table on Ambulatory and EMS recording - Year-over-year growth 2023-2028 (%)
    • 7.5 Ultrasound and OB-GYN recording - Market size and forecast 2023-2028
      • Exhibit 60: Chart on Ultrasound and OB-GYN recording - Market size and forecast 2023-2028 ($ million)
      • Exhibit 61: Data Table on Ultrasound and OB-GYN recording - Market size and forecast 2023-2028 ($ million)
      • Exhibit 62: Chart on Ultrasound and OB-GYN recording - Year-over-year growth 2023-2028 (%)
      • Exhibit 63: Data Table on Ultrasound and OB-GYN recording - Year-over-year growth 2023-2028 (%)
    • 7.6 Fetal monitoring recording - Market size and forecast 2023-2028
      • Exhibit 64: Chart on Fetal monitoring recording - Market size and forecast 2023-2028 ($ million)
      • Exhibit 65: Data Table on Fetal monitoring recording - Market size and forecast 2023-2028 ($ million)
      • Exhibit 66: Chart on Fetal monitoring recording - Year-over-year growth 2023-2028 (%)
      • Exhibit 67: Data Table on Fetal monitoring recording - Year-over-year growth 2023-2028 (%)
    • 7.7 Market opportunity by Type
      • Exhibit 68: Market opportunity by Type ($ million)
      • Exhibit 69: Data Table on Market opportunity by Type ($ million)

    8 Customer Landscape

    • 8.1 Customer landscape overview
      • Exhibit 70: Analysis of price sensitivity, lifecycle, customer purchase basket, adoption rates, and purchase criteria

    9 Geographic Landscape

    • 9.1 Geographic segmentation
      • Exhibit 71: Chart on Market share by geography 2023-2028 (%)
      • Exhibit 72: Data Table on Market share by geography 2023-2028 (%)
    • 9.2 Geographic comparison
      • Exhibit 73: Chart on Geographic comparison
      • Exhibit 74: Data Table on Geographic comparison
    • 9.3 North America - Market size and forecast 2023-2028
      • Exhibit 75: Chart on North America - Market size and forecast 2023-2028 ($ million)
      • Exhibit 76: Data Table on North America - Market size and forecast 2023-2028 ($ million)
      • Exhibit 77: Chart on North America - Year-over-year growth 2023-2028 (%)
      • Exhibit 78: Data Table on North America - Year-over-year growth 2023-2028 (%)
    • 9.4 Europe - Market size and forecast 2023-2028
      • Exhibit 79: Chart on Europe - Market size and forecast 2023-2028 ($ million)
      • Exhibit 80: Data Table on Europe - Market size and forecast 2023-2028 ($ million)
      • Exhibit 81: Chart on Europe - Year-over-year growth 2023-2028 (%)
      • Exhibit 82: Data Table on Europe - Year-over-year growth 2023-2028 (%)
    • 9.5 Asia - Market size and forecast 2023-2028
      • Exhibit 83: Chart on Asia - Market size and forecast 2023-2028 ($ million)
      • Exhibit 84: Data Table on Asia - Market size and forecast 2023-2028 ($ million)
      • Exhibit 85: Chart on Asia - Year-over-year growth 2023-2028 (%)
      • Exhibit 86: Data Table on Asia - Year-over-year growth 2023-2028 (%)
    • 9.6 Rest of World (ROW) - Market size and forecast 2023-2028
      • Exhibit 87: Chart on Rest of World (ROW) - Market size and forecast 2023-2028 ($ million)
      • Exhibit 88: Data Table on Rest of World (ROW) - Market size and forecast 2023-2028 ($ million)
      • Exhibit 89: Chart on Rest of World (ROW) - Year-over-year growth 2023-2028 (%)
      • Exhibit 90: Data Table on Rest of World (ROW) - Year-over-year growth 2023-2028 (%)
    • 9.7 US - Market size and forecast 2023-2028
      • Exhibit 91: Chart on US - Market size and forecast 2023-2028 ($ million)
      • Exhibit 92: Data Table on US - Market size and forecast 2023-2028 ($ million)
      • Exhibit 93: Chart on US - Year-over-year growth 2023-2028 (%)
      • Exhibit 94: Data Table on US - Year-over-year growth 2023-2028 (%)
    • 9.8 UK - Market size and forecast 2023-2028
      • Exhibit 95: Chart on UK - Market size and forecast 2023-2028 ($ million)
      • Exhibit 96: Data Table on UK - Market size and forecast 2023-2028 ($ million)
      • Exhibit 97: Chart on UK - Year-over-year growth 2023-2028 (%)
      • Exhibit 98: Data Table on UK - Year-over-year growth 2023-2028 (%)
    • 9.9 China - Market size and forecast 2023-2028
      • Exhibit 99: Chart on China - Market size and forecast 2023-2028 ($ million)
      • Exhibit 100: Data Table on China - Market size and forecast 2023-2028 ($ million)
      • Exhibit 101: Chart on China - Year-over-year growth 2023-2028 (%)
      • Exhibit 102: Data Table on China - Year-over-year growth 2023-2028 (%)
    • 9.10 Germany - Market size and forecast 2023-2028
      • Exhibit 103: Chart on Germany - Market size and forecast 2023-2028 ($ million)
      • Exhibit 104: Data Table on Germany - Market size and forecast 2023-2028 ($ million)
      • Exhibit 105: Chart on Germany - Year-over-year growth 2023-2028 (%)
      • Exhibit 106: Data Table on Germany - Year-over-year growth 2023-2028 (%)
    • 9.11 Canada - Market size and forecast 2023-2028
      • Exhibit 107: Chart on Canada - Market size and forecast 2023-2028 ($ million)
      • Exhibit 108: Data Table on Canada - Market size and forecast 2023-2028 ($ million)
      • Exhibit 109: Chart on Canada - Year-over-year growth 2023-2028 (%)
      • Exhibit 110: Data Table on Canada - Year-over-year growth 2023-2028 (%)
    • 9.12 Market opportunity by geography
      • Exhibit 111: Market opportunity by geography ($ million)
      • Exhibit 112: Data Tables on Market opportunity by geography ($ million)

    10 Drivers, Challenges, and Trends

    • 10.1 Market drivers
      • 10.2 Market challenges
        • 10.3 Impact of drivers and challenges
          • Exhibit 113: Impact of drivers and challenges in 2023 and 2028
        • 10.4 Market trends

          11 Vendor Landscape

          • 11.1 Overview
            • 11.2 Vendor landscape
              • Exhibit 114: Overview on Criticality of inputs and Factors of differentiation
            • 11.3 Landscape disruption
              • Exhibit 115: Overview on factors of disruption
            • 11.4 Industry risks
              • Exhibit 116: Impact of key risks on business

            12 Vendor Analysis

            • 12.1 Vendors covered
              • Exhibit 117: Vendors covered
            • 12.2 Market positioning of vendors
              • Exhibit 118: Matrix on vendor position and classification
            • 12.3 Avantor Inc
              • Exhibit 119: Avantor Inc - Overview
              • Exhibit 120: Avantor Inc - Business segments
              • Exhibit 121: Avantor Inc - Key news
              • Exhibit 122: Avantor Inc - Key offerings
              • Exhibit 123: Avantor Inc - Segment focus
            • 12.4 Cardinal Health Inc.
              • Exhibit 124: Cardinal Health Inc. - Overview
              • Exhibit 125: Cardinal Health Inc. - Business segments
              • Exhibit 126: Cardinal Health Inc. - Key offerings
              • Exhibit 127: Cardinal Health Inc. - Segment focus
            • 12.5 CompareNetworks Inc.
              • Exhibit 128: CompareNetworks Inc. - Overview
              • Exhibit 129: CompareNetworks Inc. - Product / Service
              • Exhibit 130: CompareNetworks Inc. - Key offerings
            • 12.6 Dickson Inc.
              • Exhibit 131: Dickson Inc. - Overview
              • Exhibit 132: Dickson Inc. - Product / Service
              • Exhibit 133: Dickson Inc. - Key offerings
            • 12.7 GeoCorp Inc.
              • Exhibit 134: GeoCorp Inc. - Overview
              • Exhibit 135: GeoCorp Inc. - Product / Service
              • Exhibit 136: GeoCorp Inc. - Key offerings
            • 12.8 Honeywell International Inc.
              • Exhibit 137: Honeywell International Inc. - Overview
              • Exhibit 138: Honeywell International Inc. - Business segments
              • Exhibit 139: Honeywell International Inc. - Key news
              • Exhibit 140: Honeywell International Inc. - Key offerings
              • Exhibit 141: Honeywell International Inc. - Segment focus
            • 12.9 Merck KGaA
              • Exhibit 142: Merck KGaA - Overview
              • Exhibit 143: Merck KGaA - Business segments
              • Exhibit 144: Merck KGaA - Key news
              • Exhibit 145: Merck KGaA - Key offerings
              • Exhibit 146: Merck KGaA - Segment focus
            • 12.10 Precision Charts Inc.
              • Exhibit 147: Precision Charts Inc. - Overview
              • Exhibit 148: Precision Charts Inc. - Product / Service
              • Exhibit 149: Precision Charts Inc. - Key offerings
            • 12.11 Shandong Ultra Paper Co. Ltd.
              • Exhibit 150: Shandong Ultra Paper Co. Ltd. - Overview
              • Exhibit 151: Shandong Ultra Paper Co. Ltd. - Key offerings
            • 12.12 Thermo Fisher Scientific Inc.
              • Exhibit 152: Thermo Fisher Scientific Inc. - Overview
              • Exhibit 153: Thermo Fisher Scientific Inc. - Business segments
              • Exhibit 154: Thermo Fisher Scientific Inc. - Key news
              • Exhibit 155: Thermo Fisher Scientific Inc. - Key offerings
              • Exhibit 156: Thermo Fisher Scientific Inc. - Segment focus
            • 12.13 Yokogawa Electric Corp.
              • Exhibit 157: Yokogawa Electric Corp. - Overview
              • Exhibit 158: Yokogawa Electric Corp. - Business segments
              • Exhibit 159: Yokogawa Electric Corp. - Key offerings
              • Exhibit 160: Yokogawa Electric Corp. - Segment focus

            13 Appendix

            • 13.1 Scope of the report
              • 13.2 Inclusions and exclusions checklist
                • Exhibit 161: Inclusions checklist
                • Exhibit 162: Exclusions checklist
              • 13.3 Currency conversion rates for US$
                • Exhibit 163: Currency conversion rates for US$
              • 13.4 Research methodology
                • Exhibit 164: Research methodology
                • Exhibit 165: Validation techniques employed for market sizing
                • Exhibit 166: Information sources
              • 13.5 List of abbreviations
                • Exhibit 167: List of abbreviations

              Research Methodology

              Technavio presents a detailed picture of the market by way of study, synthesis, and summation of data from multiple sources. The analysts have presented the various facets of the market with a particular focus on identifying the key industry influencers. The data thus presented is comprehensive, reliable, and the result of extensive research, both primary and secondary.

              INFORMATION SOURCES

              Primary sources

              • Manufacturers and suppliers
              • Channel partners
              • Industry experts
              • Strategic decision makers

              Secondary sources

              • Industry journals and periodicals
              • Government data
              • Financial reports of key industry players
              • Historical data
              • Press releases

              DATA ANALYSIS

              Data Synthesis

              • Collation of data
              • Estimation of key figures
              • Analysis of derived insights

              Data Validation

              • Triangulation with data models
              • Reference against proprietary databases
              • Corroboration with industry experts

              REPORT WRITING

              Qualitative

              • Market drivers
              • Market challenges
              • Market trends
              • Five forces analysis

              Quantitative

              • Market size and forecast
              • Market segmentation
              • Geographical insights
              • Competitive landscape

              Interested in this report?

              Get your sample now to see our research methodology and insights!

              Download Now

              Frequently Asked Questions

              Recording Chart Paper market growth will increase by $ 753.71 mn during 2024-2028 .

              The Recording Chart Paper market is expected to grow at a CAGR of 6.01% during 2024-2028 .

              Recording Chart Paper market is segmented by Application( Hospitals, Diagnostic centers, Clinics) Type( Cardiology monitoring recording, Ambulatory and EMS recording, Ultrasound and OB-GYN recording, Fetal monitoring recording)

              Avantor Inc, Cardinal Health Inc., CompareNetworks Inc., Dickson Inc., GeoCorp Inc., Honeywell International Inc., Merck KGaA, Precision Charts Inc., Shandong Ultra Paper Co. Ltd., Thermo Fisher Scientific Inc., Yokogawa Electric Corp. are a few of the key vendors in the Recording Chart Paper market.

              North America will register the highest growth rate of 42% among the other regions. Therefore, the Recording Chart Paper market in North America is expected to garner significant business opportunities for the vendors during the forecast period.

              US, Canada, UK, Germany, China

              • Increasing adoption of automated systems across various industriesThe increasing adoption of automated systems across various industries serves as a significant driver for the global recording chart paper market. As industries embrace automation to streamline processes is the driving factor this market.
              • improve efficiency is the driving factor this market.
              • and enhance productivity is the driving factor this market.
              • there arises a heightened demand for recording chart paper used in monitoring and analyzing critical parameters. Automated systems in sectors such as manufacturing is the driving factor this market.
              • healthcare is the driving factor this market.
              • transportation is the driving factor this market.
              • and energy rely on recording chart paper for data logging and analysis. For instance is the driving factor this market.
              • in manufacturing is the driving factor this market.
              • automated production lines utilize chart recorders to monitor variables like temperature is the driving factor this market.
              • pressure is the driving factor this market.
              • and flow rates to ensure optimal operation and quality control. Similarly is the driving factor this market.
              • in healthcare settings is the driving factor this market.
              • automated medical devices and diagnostic equipment generate data that is recorded on chart paper for patient monitoring and analysis. The adoption of automation often entails compliance with stringent regulatory requirements is the driving factor this market.
              • necessitating accurate and reliable data recording methods. Recording chart paper serves as a trusted medium for compliance purposes is the driving factor this market.
              • ensuring that industry standards and regulations are met effectively. Thus is the driving factor this market.
              • the rise in the adoption of automated systems across industries is expected to boost the growth of the global recording chart paper market during the forecast period. is the driving factor this market.

              The Recording Chart Paper market vendors should focus on grabbing business opportunities from the Hospitals segment as it accounted for the largest market share in the base year.