Refurbished Medical Imaging Equipment Market Analysis, Size, and Forecast 2025-2029: North America (US and Canada), Europe (France, Germany, Italy, and UK), APAC (China, India, and Japan), South America (Brazil), and Rest of World (ROW)

Refurbished Medical Imaging Equipment Market Analysis, Size, and Forecast 2025-2029:
North America (US and Canada), Europe (France, Germany, Italy, and UK), APAC (China, India, and Japan), South America (Brazil), and Rest of World (ROW)

Published: May 2025 230 Pages SKU: IRTNTR46575

Market Overview at a Glance

$7.68 B
Market Opportunity
8.5%
CAGR
7.7
YoY growth 2024-2025(%)

Refurbished Medical Imaging Equipment Market Size 2025-2029

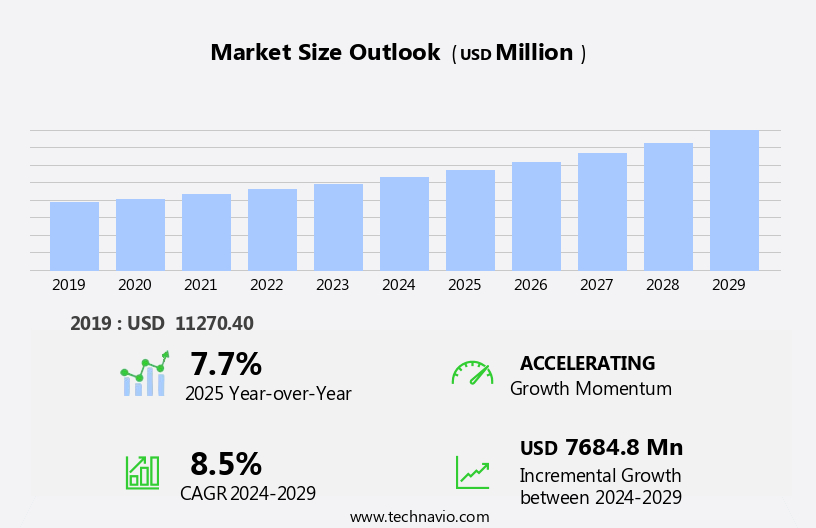
The refurbished medical imaging equipment market size is forecast to increase by USD 7.68 billion, at a CAGR of 8.5% between 2024 and 2029.

  • The market is driven by the increasing demand for cost-effective and efficient medical imaging devices. As healthcare costs continue to rise, the affordability of refurbished equipment becomes an attractive option for healthcare providers. Furthermore, the adoption of eco-friendly practices in the healthcare industry is fueling the market's growth, as refurbished equipment offers a sustainable solution to reducing the environmental impact of medical waste. However, the market faces challenges, including the negative perception of end-users about refurbished medical equipment. Some healthcare providers may view refurbished equipment as less reliable or less advanced than new equipment. Addressing these concerns through certification programs and ensuring the highest quality standards can help alleviate these concerns and expand the market's reach.
  • Companies seeking to capitalize on market opportunities should focus on providing top-notch customer service, offering flexible financing options, and ensuring the highest quality standards for their refurbished medical imaging equipment. By addressing the challenges and leveraging the market's drivers, companies can effectively navigate the competitive landscape and capture a significant share of the market.

What will be the Size of the Refurbished Medical Imaging Equipment Market during the forecast period?

Refurbished Medical Imaging Equipment Market Size

Explore in-depth regional segment analysis with market size data - historical 2019-2023 and forecasts 2025-2029 - in the full report.  
Request Free Sample

The market continues to evolve, driven by the ever-changing dynamics of technology and healthcare sector requirements. MRI machines, CT scanners, and X-ray systems are continually upgraded to enhance image quality and enable advanced applications such as precision medicine, image registration, and personalized medicine. Efficiency improvements are a key focus, with equipment financing, quality assurance, and asset management solutions facilitating cost optimization and seamless hospital workflow. CE marking and regulatory compliance ensure the safe and effective use of refurbished imaging equipment. Advancements in medical imaging technology, including 3D imaging, image segmentation, and image analysis, are revolutionizing disease diagnosis and interventional radiology.

Big data analytics and artificial intelligence (AI) are increasingly integrated into medical imaging software for early detection and treatment planning. Emerging technologies like image fusion, contrast agents, noise reduction, and machine learning are transforming the industry, offering significant benefits in terms of spatial resolution, contrast resolution, and diagnostic accuracy. Preventive screening and patient monitoring are also gaining importance, with remote diagnostics and real-time image interpretation becoming essential components of the healthcare ecosystem. The ongoing adoption of technology in healthcare is leading to the obsolescence of traditional imaging systems. Maintenance and repair services, along with upgrade options, are crucial for extending the life cycle of refurbished medical imaging equipment.

In the realm of cardiovascular imaging, advancements in image acquisition, image processing, and image optimization are enabling more accurate and timely diagnosis. Radiation shielding and image interpretation tools are also essential for ensuring the safety and effectiveness of diagnostic imaging. The integration of medical imaging with healthcare informatics, DICOM standards, and cloud computing is streamlining the management and sharing of medical images, making them more accessible and valuable for clinical trials and research purposes. In conclusion, the market is a dynamic and evolving landscape, characterized by continuous innovation and adaptation to the changing needs of the healthcare sector.

From image acquisition and processing to diagnostic accuracy and patient care, refurbished medical imaging equipment plays a crucial role in enhancing the quality and accessibility of healthcare services.

How is this Refurbished Medical Imaging Equipment Industry segmented?

The refurbished medical imaging equipment industry research report provides comprehensive data (region-wise segment analysis), with forecasts and estimates in "USD million" for the period 2025-2029, as well as historical data from 2019-2023 for the following segments.

  • Product
    • X-ray imaging
    • Ultrasound systems
    • MRI
    • CT scanner imaging
    • SPECT/ PET scanners
  • End-user
    • Hospitals
    • Diagnostic centers
  • Application
    • Cardiovascular
    • Oncology
    • Orthopedics
    • Gynecology
    • Others
  • Geography
    • North America
      • US
      • Canada
    • Europe
      • France
      • Germany
      • Italy
      • UK
    • APAC
      • China
      • India
      • Japan
    • South America
      • Brazil
    • Rest of World (ROW)

    By Product Insights

    The x-ray imaging segment is estimated to witness significant growth during the forecast period.

    Digital radiography, a type of X-ray imaging technology, has gained significant traction in the healthcare industry due to its advantages over traditional film-based methods. The Food and Drug Administration (FDA) has approved numerous digital radiography systems, driving their adoption in hospitals and diagnostic centers. Ultrasound equipment, another essential diagnostic tool, is also seeing a surge in demand for refurbished models, particularly in the context of healthcare informatics and regulatory compliance. Advanced image enhancement technologies, such as deep learning and artificial intelligence (AI), are revolutionizing diagnostic imaging. These technologies enable image analysis, segmentation, and fusion, leading to improved image quality and more accurate disease diagnosis.

    MRI machines, CT scanners, and PET scanners are integral to cardiovascular imaging, musculoskeletal imaging, and cancer diagnosis, respectively. Maintenance and repair services are crucial for ensuring the longevity and optimal performance of imaging equipment. Obsolescence management and equipment upgrading are essential strategies for healthcare institutions to maintain regulatory compliance and stay updated with emerging technologies. Remote diagnostics and cloud computing facilitate efficient image acquisition, storage, retrieval, and interpretation, enabling early detection and personalized medicine. Efficiency improvements and cost optimization are significant factors driving the adoption of refurbished imaging equipment. DICOM standards ensure seamless data transfer and compatibility between various imaging systems, while image processing, optimization, and interpretation tools enhance diagnostic accuracy and productivity.

    In the realm of interventional radiology, image-guided surgery and precision medicine are transforming patient care. Minimally invasive procedures, such as image-guided biopsies and minimally invasive surgeries, require advanced imaging systems that offer high spatial and contrast resolution. Radiation shielding and preventive screening are essential components of patient safety and early disease detection strategies. In summary, the market is characterized by a growing demand for advanced imaging technologies, regulatory compliance, and cost optimization. Digital radiography, ultrasound equipment, MRI machines, CT scanners, and PET scanners are integral to various diagnostic and therapeutic applications. Emerging technologies, such as deep learning, AI, and 3D imaging, are transforming diagnostic imaging, while maintenance and repair services ensure the longevity and optimal performance of imaging equipment.

    Refurbished Medical Imaging Equipment Market Size

    Request Free Sample

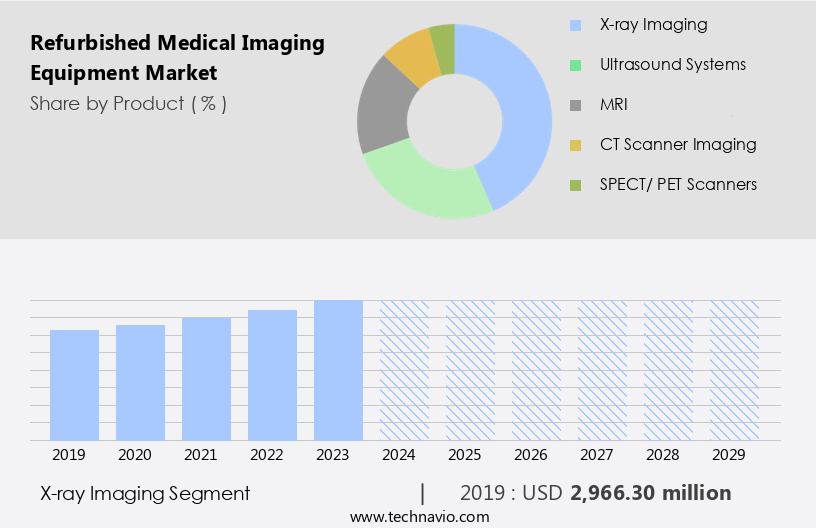
    The X-ray imaging segment was valued at USD 2.97 billion in 2019 and showed a gradual increase during the forecast period.

    Regional Analysis

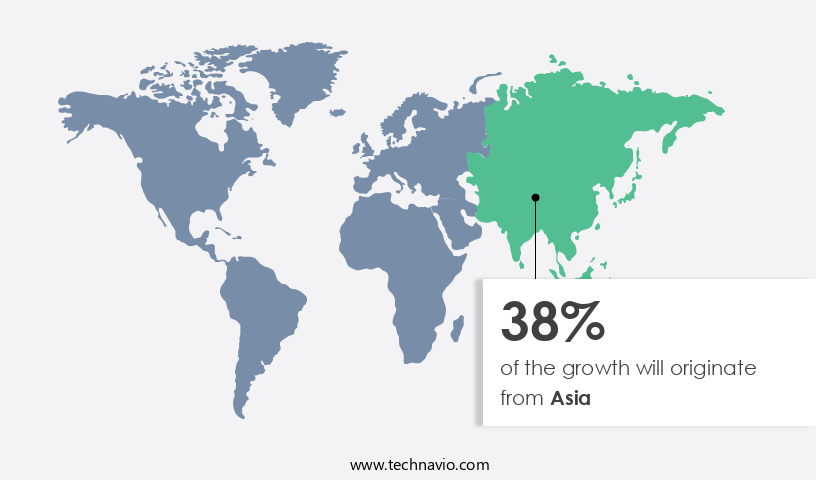
    Asia is estimated to contribute 38% to the growth of the global market during the forecast period.Technavio’s analysts have elaborately explained the regional trends and drivers that shape the market during the forecast period.

    Refurbished Medical Imaging Equipment Market Share by Geography

     Request Free Sample

    The market in North America is experiencing significant growth due to the rising prevalence of cardiovascular diseases, musculoskeletal disorders, and cancer. Favorable regulatory policies and decreasing insurance coverage for certain medical imaging procedures are also contributing factors. The United States, as the largest market in the region, allows the unrestricted sale, purchase, and usage of refurbished medical devices. However, the Food and Drug Administration (FDA) recommends that manufacturers replace device parts only with original equipment manufacturer (OEM) components. The FDA does not regulate the resale of medical devices unless there are modifications to the original specifications.

    Emerging technologies, such as deep learning, artificial intelligence (AI), and big data analytics, are transforming the medical imaging industry. These technologies enable image enhancement, analysis, optimization, and interpretation, leading to improved diagnostic accuracy and efficiency. DICOM standards ensure interoperability between different imaging systems, facilitating seamless data transfer and integration. Image-guided surgery, interventional radiology, and radiation shielding are essential aspects of diagnostic imaging. Preventive screening and early detection are crucial for effective disease management and treatment planning. MRI machines, CT scanners, and PET scanners are essential diagnostic tools, with MRI machines witnessing increasing demand due to their ability to provide high-resolution, 3D, and 4D images.

    Regulatory compliance, maintenance and repair, and asset management are critical aspects of the market. Equipment upgrading, remote diagnostics, and image segmentation are emerging trends, offering cost optimization and improved image quality. Medical imaging software, image fusion, and contrast agents are essential tools for image processing, analysis, and interpretation. In Europe, CE marking is mandatory for the sale and usage of refurbished medical imaging equipment. Precision medicine, personalized medicine, and patient monitoring are emerging trends in the European market. Image registration, image retrieval, and clinical trials are essential aspects of medical imaging research and development. The market is dynamic, with ongoing advancements in technology and regulatory policies shaping its evolution.

    Efficiency improvements, cost optimization, and quality assurance are key priorities for market participants. The market's future potential is vast, with opportunities in emerging technologies, disease diagnosis, and treatment planning.

    Market Dynamics

    Our researchers analyzed the data with 2024 as the base year, along with the key drivers, trends, and challenges. A holistic analysis of drivers will help companies refine their marketing strategies to gain a competitive advantage.

    What are the key market drivers leading to the rise in the adoption of Refurbished Medical Imaging Equipment Industry?

    • The escalating need for affordable and productive medical imaging devices, driven by rising demand, is a significant market trend. 

    • In the healthcare industry, the high cost of new medical imaging equipment, such as deep learning-enabled musculoskeletal imaging systems and mammography machines, poses a significant challenge for hospitals and diagnostic centers, particularly in light of budget constraints. The expense extends beyond the initial purchase price, as equipment upgrading, remote diagnostics, and maintenance charges add to the overall cost. To address this challenge, many healthcare providers are turning to refurbished medical imaging equipment. This alternative solution offers significant cost savings, allowing for the acquisition of advanced technology that may otherwise be out of reach. These refurbished devices undergo rigorous testing and upgrades, ensuring they meet the same standards as new equipment in terms of image analysis capabilities, spatial resolution, and image processing.
    • Moreover, refurbished medical imaging equipment can be integrated with artificial intelligence (AI) and image optimization technologies, enhancing diagnostic accuracy and improving patient care. The equipment can also be upgraded with the latest features, such as radiation shielding and preventive screening capabilities, making them suitable for various diagnostic applications, including interventional radiology and abdominal imaging. Installation and training services are provided to ensure a seamless transition to the refurbished equipment, while asset management solutions ensure ongoing support and maintenance. In conclusion, refurbished medical imaging equipment offers an affordable solution for healthcare providers seeking advanced diagnostic capabilities without the high cost associated with new equipment.

    What are the market trends shaping the Refurbished Medical Imaging Equipment Industry?

    • The adoption of eco-friendly practices is gaining momentum in the market. This trend reflects a growing commitment to sustainability among businesses and consumers alike.

    • Refurbishing used medical imaging equipment, such as MRI machines and CT scanners, offers significant benefits for the healthcare industry. This process not only saves resources and energy but also reduces waste and promotes sustainability. The refurbishing of medical devices, including image acquisition, registration, and segmentation systems, enables access to affordable, high-quality equipment. This is particularly important for private hospitals and diagnostic centers seeking to minimize costs. Moreover, the integration of advanced technologies like precision medicine, personalized medicine, patient monitoring, and big data analytics into refurbished medical imaging equipment enhances their functionality. These technologies facilitate early detection and improve hospital workflow efficiency.
    • Quality assurance and CE marking are crucial aspects of refurbishing medical imaging equipment. Equipment financing solutions are also available to facilitate the purchase of refurbished devices. The refurbishment process involves thorough inspection, testing, and upgrading of components to meet current industry standards. This ensures the equipment's reliability and performance are on par with new devices. In conclusion, the refurbishment of medical imaging equipment is an eco-friendly and cost-effective solution for healthcare providers. It allows for the integration of advanced technologies, enhancing diagnostic capabilities and improving patient care.

    What challenges does the Refurbished Medical Imaging Equipment Industry face during its growth?

    • The negative perception held by end-users towards refurbished medical equipment poses a significant challenge to the industry's growth. This perception, rooted in concerns over equipment reliability and safety, hinders market expansion and adoption. It is imperative for industry players to address these apprehensions through transparent communication, rigorous quality control processes, and robust warranties to build trust and confidence in the refurbished medical equipment market. 

    • Refurbished medical imaging equipment faces skepticism from end-users due to concerns over quality and reliability. These apprehensions stem from doubts about the effectiveness and safety of used devices compared to new ones. Factors fueling these concerns include uncertainties about the refurbishment process, potential hidden defects, and durability issues. Aesthetic considerations and noise levels in refurbished equipment further contribute to end-users' reluctance. To mitigate these perceptions, transparency about the refurbishment process and quality assurance measures are essential. Highlighting the cost-effectiveness and environmental benefits of refurbished medical imaging equipment can also help improve acceptance. Advanced technologies like image fusion, contrast agents, noise reduction, treatment planning, image management, artifact correction, image interpretation, cloud computing, clinical trials, computer vision, high-resolution imaging, image reconstruction, 4d imaging, digital pathology, and machine learning are increasingly being integrated into refurbished medical imaging equipment to enhance their functionality and performance.
    • These technological advancements can help address end-users' concerns and boost the adoption of refurbished medical imaging equipment.

    Exclusive Customer Landscape

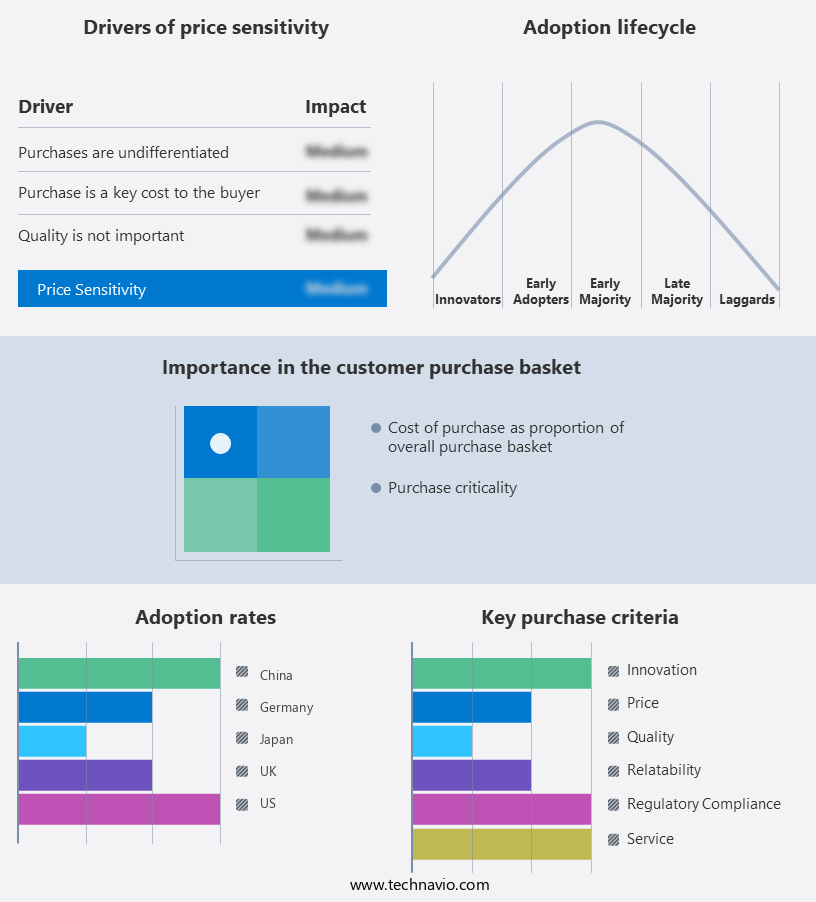
    The refurbished medical imaging equipment market forecasting report includes the adoption lifecycle of the market, covering from the innovator’s stage to the laggard’s stage. It focuses on adoption rates in different regions based on penetration. Furthermore, the refurbished medical imaging equipment market report also includes key purchase criteria and drivers of price sensitivity to help companies evaluate and develop their market growth analysis strategies.

    Refurbished Medical Imaging Equipment Market Share by Geography

     Customer Landscape

    Key Companies & Market Insights

    Companies are implementing various strategies, such as strategic alliances, refurbished medical imaging equipment market forecast, partnerships, mergers and acquisitions, geographical expansion, and product/service launches, to enhance their presence in the industry.

    AGITO Medical - This company specializes in the sale of refurbished medical imaging equipment. Our inventory includes Mammography systems, Ultrasound systems, and C arms, all meticulously restored to meet industry standards. Through rigorous testing and quality assurance processes, we ensure the functionality and reliability of each piece of equipment. By offering cost-effective alternatives to new systems, we aim to help healthcare providers enhance their diagnostic capabilities without incurring substantial expenses. Our commitment to excellence and customer satisfaction sets us apart in the medical imaging market.

    The industry research and growth report includes detailed analyses of the competitive landscape of the market and information about key companies, including:

    • AGITO Medical
    • Avante Health Solutions
    • Block Imaging Inc.
    • EverX Pty Ltd.
    • Fair Medical Co. Ltd.
    • GE Healthcare Technologies Inc.
    • Hi Tech International Group Inc.
    • Hilditch Group Ltd.
    • Integrity Medical Systems Inc.
    • Koninklijke Philips NV
    • Master Medical Systems Pvt. Ltd.
    • Nationwide Imaging Services Inc
    • Pacific Healthcare Imaging
    • Radiology Oncology Systems Inc.
    • Siemens Healthineers AG
    • Soma Technology
    • Ultra Imaging Solutions LLC.
    • US Med Equip
    • Venture Medical ReQuip Inc.
    • Whittemore Enterprises Inc.

    Qualitative and quantitative analysis of companies has been conducted to help clients understand the wider business environment as well as the strengths and weaknesses of key industry players. Data is qualitatively analyzed to categorize companies as pure play, category-focused, industry-focused, and diversified; it is quantitatively analyzed to categorize companies as dominant, leading, strong, tentative, and weak.

    Recent Development and News in Refurbished Medical Imaging Equipment Market

    • In February 2023, Siemens Healthineers, a leading medical technology company, announced the expansion of its Certified Pre-Owned portfolio with the introduction of the refurbished Mammomat Revelation system. This system offers high-performance imaging and is designed to meet the evolving needs of imaging centers and hospitals seeking cost-effective solutions (Siemens Healthineers Press Release).
    • In April 2024, Philips and GE Healthcare, two major players in the medical imaging industry, formed a strategic partnership to offer refurbished medical imaging equipment. This collaboration aims to provide affordable solutions to healthcare providers while reducing e-waste and promoting sustainability (Philips and GE Healthcare Press Release).
    • In January 2025, Sharp HealthCare, a US-based healthcare system, invested in a new refurbished medical imaging equipment center. This initiative is expected to save the organization over USD10 million annually and improve access to imaging services for patients (Sharp HealthCare Press Release).
    • In March 2025, the US Food and Drug Administration (FDA) issued new guidelines for the refurbishment and reuse of medical imaging equipment. These guidelines aim to ensure the safety and quality of refurbished equipment and promote transparency in the market (FDA Press Release).

    Research Analyst Overview

    • The market experiences dynamic activity, driven by various trends and industry developments. Value-based care initiatives prioritize cost-effective solutions, fueling the demand for affordable, refurbished equipment. Intellectually-owned property rights and data privacy concerns necessitate adherence to industry associations' guidelines. Medical device manufacturers and third-party service providers collaborate to offer standardized, high-quality refurbished equipment. Open source software and market reports facilitate transparency and informed decision-making for radiology departments, imaging centers, and academic centers. Healthcare IT companies and OEM manufacturers invest in innovative technologies to cater to the evolving market. Ethical considerations and healthcare reform shape the regulatory landscape. Trade shows and venture capitalists provide opportunities for software developers to showcase their solutions and secure investments.
    • Analyst reports highlight the potential growth of the market, attracting investment firms and further driving innovation. Patient safety and social impact remain top priorities, ensuring the industry's focus on delivering efficient, cost-effective medical imaging solutions.

    Dive into Technavio’s robust research methodology, blending expert interviews, extensive data synthesis, and validated models for unparalleled Refurbished Medical Imaging Equipment Market insights. See full methodology.

    Market Scope

    Report Coverage

    Details

    Page number

    230

    Base year

    2024

    Historic period

    2019-2023

    Forecast period

    2025-2029

    Growth momentum & CAGR

    Accelerate at a CAGR of 8.5%

    Market growth 2025-2029

    USD 7684.8 million

    Market structure

    Fragmented

    YoY growth 2024-2025(%)

    7.7

    Key countries

    US, Canada, China, Germany, Japan, UK, France, Brazil, Italy, and India

    Competitive landscape

    Leading Companies, Market Positioning of Companies, Competitive Strategies, and Industry Risks

    Request Free Sample

    What are the Key Data Covered in this Refurbished Medical Imaging Equipment Market Research and Growth Report?

    • CAGR of the Refurbished Medical Imaging Equipment industry during the forecast period
    • Detailed information on factors that will drive the growth and forecasting between 2025 and 2029
    • Precise estimation of the size of the market and its contribution of the industry in focus to the parent market
    • Accurate predictions about upcoming growth and trends and changes in consumer behaviour
    • Growth of the market across North America, Europe, Asia, and Rest of World (ROW)
    • Thorough analysis of the market’s competitive landscape and detailed information about companies
    • Comprehensive analysis of factors that will challenge the refurbished medical imaging equipment market growth of industry companies

    We can help! Our analysts can customize this refurbished medical imaging equipment market research report to meet your requirements.

    Get in touch


    1 Executive Summary

    • 1.1 Market overview
      • Executive Summary - Chart on Market Overview
      • Executive Summary - Data Table on Market Overview
      • Executive Summary - Chart on Global Market Characteristics
      • Executive Summary - Chart on Market by Geography
      • Executive Summary - Chart on Market Segmentation by Product
      • Executive Summary - Chart on Market Segmentation by End-user
      • Executive Summary - Chart on Market Segmentation by Application
      • Executive Summary - Chart on Incremental Growth
      • Executive Summary - Data Table on Incremental Growth
      • Executive Summary - Chart on Company Market Positioning

    2 Technavio Analysis

    • 2.1 Analysis of price sensitivity, lifecycle, customer purchase basket, adoption rates, and purchase criteria
      • Analysis of price sensitivity, lifecycle, customer purchase basket, adoption rates, and purchase criteria
    • 2.2 Criticality of inputs and Factors of differentiation
      • Overview on criticality of inputs and factors of differentiation
    • 2.3 Factors of disruption
      • Overview on factors of disruption
    • 2.4 Impact of drivers and challenges
      • Impact of drivers and challenges in 2024 and 2029

    3 Market Landscape

    • 3.1 Market ecosystem
      • Parent Market
      • Data Table on - Parent Market
    • 3.2 Market characteristics
      • Market characteristics analysis
    • 3.3 Value chain analysis
      • Value chain analysis

    4 Market Sizing

    • 4.1 Market definition
      • Offerings of companies included in the market definition
    • 4.2 Market segment analysis
      • Market segments
    • 4.3 Market size 2024
      • 4.4 Market outlook: Forecast for 2024-2029
        • Chart on Global - Market size and forecast 2024-2029 ($ million)
        • Data Table on Global - Market size and forecast 2024-2029 ($ million)
        • Chart on Global Market: Year-over-year growth 2024-2029 (%)
        • Data Table on Global Market: Year-over-year growth 2024-2029 (%)

      5 Historic Market Size

      • 5.1 Global Refurbished Medical Imaging Equipment Market 2019 - 2023
        • Historic Market Size - Data Table on Global Refurbished Medical Imaging Equipment Market 2019 - 2023 ($ million)
      • 5.2 Product segment analysis 2019 - 2023
        • Historic Market Size - Product Segment 2019 - 2023 ($ million)
      • 5.3 End-user segment analysis 2019 - 2023
        • Historic Market Size - End-user Segment 2019 - 2023 ($ million)
      • 5.4 Application segment analysis 2019 - 2023
        • Historic Market Size - Application Segment 2019 - 2023 ($ million)
      • 5.5 Geography segment analysis 2019 - 2023
        • Historic Market Size - Geography Segment 2019 - 2023 ($ million)
      • 5.6 Country segment analysis 2019 - 2023
        • Historic Market Size - Country Segment 2019 - 2023 ($ million)

      6 Qualitative Analysis

      • 6.1 Impact of AI on global refurbished medical imaging equipment market

        7 Five Forces Analysis

        • 7.1 Five forces summary
          • Five forces analysis - Comparison between 2024 and 2029
        • 7.2 Bargaining power of buyers
          • Bargaining power of buyers - Impact of key factors 2024 and 2029
        • 7.3 Bargaining power of suppliers
          • Bargaining power of suppliers - Impact of key factors in 2024 and 2029
        • 7.4 Threat of new entrants
          • Threat of new entrants - Impact of key factors in 2024 and 2029
        • 7.5 Threat of substitutes
          • Threat of substitutes - Impact of key factors in 2024 and 2029
        • 7.6 Threat of rivalry
          • Threat of rivalry - Impact of key factors in 2024 and 2029
        • 7.7 Market condition
          • Chart on Market condition - Five forces 2024 and 2029

        8 Market Segmentation by Product

        • 8.1 Market segments
          • Chart on Product - Market share 2024-2029 (%)
          • Data Table on Product - Market share 2024-2029 (%)
        • 8.2 Comparison by Product
          • Chart on Comparison by Product
          • Data Table on Comparison by Product
        • 8.3 X-ray imaging - Market size and forecast 2024-2029
          • Chart on X-ray imaging - Market size and forecast 2024-2029 ($ million)
          • Data Table on X-ray imaging - Market size and forecast 2024-2029 ($ million)
          • Chart on X-ray imaging - Year-over-year growth 2024-2029 (%)
          • Data Table on X-ray imaging - Year-over-year growth 2024-2029 (%)
        • 8.4 Ultrasound systems - Market size and forecast 2024-2029
          • Chart on Ultrasound systems - Market size and forecast 2024-2029 ($ million)
          • Data Table on Ultrasound systems - Market size and forecast 2024-2029 ($ million)
          • Chart on Ultrasound systems - Year-over-year growth 2024-2029 (%)
          • Data Table on Ultrasound systems - Year-over-year growth 2024-2029 (%)
        • 8.5 MRI - Market size and forecast 2024-2029
          • Chart on MRI - Market size and forecast 2024-2029 ($ million)
          • Data Table on MRI - Market size and forecast 2024-2029 ($ million)
          • Chart on MRI - Year-over-year growth 2024-2029 (%)
          • Data Table on MRI - Year-over-year growth 2024-2029 (%)
        • 8.6 CT scanner imaging - Market size and forecast 2024-2029
          • Chart on CT scanner imaging - Market size and forecast 2024-2029 ($ million)
          • Data Table on CT scanner imaging - Market size and forecast 2024-2029 ($ million)
          • Chart on CT scanner imaging - Year-over-year growth 2024-2029 (%)
          • Data Table on CT scanner imaging - Year-over-year growth 2024-2029 (%)
        • 8.7 SPECT/ PET scanners - Market size and forecast 2024-2029
          • Chart on SPECT/ PET scanners - Market size and forecast 2024-2029 ($ million)
          • Data Table on SPECT/ PET scanners - Market size and forecast 2024-2029 ($ million)
          • Chart on SPECT/ PET scanners - Year-over-year growth 2024-2029 (%)
          • Data Table on SPECT/ PET scanners - Year-over-year growth 2024-2029 (%)
        • 8.8 Market opportunity by Product
          • Market opportunity by Product ($ million)
          • Data Table on Market opportunity by Product ($ million)

        9 Market Segmentation by End-user

        • 9.1 Market segments
          • Chart on End-user - Market share 2024-2029 (%)
          • Data Table on End-user - Market share 2024-2029 (%)
        • 9.2 Comparison by End-user
          • Chart on Comparison by End-user
          • Data Table on Comparison by End-user
        • 9.3 Hospitals - Market size and forecast 2024-2029
          • Chart on Hospitals - Market size and forecast 2024-2029 ($ million)
          • Data Table on Hospitals - Market size and forecast 2024-2029 ($ million)
          • Chart on Hospitals - Year-over-year growth 2024-2029 (%)
          • Data Table on Hospitals - Year-over-year growth 2024-2029 (%)
        • 9.4 Diagnostic centers - Market size and forecast 2024-2029
          • Chart on Diagnostic centers - Market size and forecast 2024-2029 ($ million)
          • Data Table on Diagnostic centers - Market size and forecast 2024-2029 ($ million)
          • Chart on Diagnostic centers - Year-over-year growth 2024-2029 (%)
          • Data Table on Diagnostic centers - Year-over-year growth 2024-2029 (%)
        • 9.5 Market opportunity by End-user
          • Market opportunity by End-user ($ million)
          • Data Table on Market opportunity by End-user ($ million)

        10 Market Segmentation by Application

        • 10.1 Market segments
          • Chart on Application - Market share 2024-2029 (%)
          • Data Table on Application - Market share 2024-2029 (%)
        • 10.2 Comparison by Application
          • Chart on Comparison by Application
          • Data Table on Comparison by Application
        • 10.3 Cardiovascular - Market size and forecast 2024-2029
          • Chart on Cardiovascular - Market size and forecast 2024-2029 ($ million)
          • Data Table on Cardiovascular - Market size and forecast 2024-2029 ($ million)
          • Chart on Cardiovascular - Year-over-year growth 2024-2029 (%)
          • Data Table on Cardiovascular - Year-over-year growth 2024-2029 (%)
        • 10.4 Oncology - Market size and forecast 2024-2029
          • Chart on Oncology - Market size and forecast 2024-2029 ($ million)
          • Data Table on Oncology - Market size and forecast 2024-2029 ($ million)
          • Chart on Oncology - Year-over-year growth 2024-2029 (%)
          • Data Table on Oncology - Year-over-year growth 2024-2029 (%)
        • 10.5 Orthopedics - Market size and forecast 2024-2029
          • Chart on Orthopedics - Market size and forecast 2024-2029 ($ million)
          • Data Table on Orthopedics - Market size and forecast 2024-2029 ($ million)
          • Chart on Orthopedics - Year-over-year growth 2024-2029 (%)
          • Data Table on Orthopedics - Year-over-year growth 2024-2029 (%)
        • 10.6 Gynecology - Market size and forecast 2024-2029
          • Chart on Gynecology - Market size and forecast 2024-2029 ($ million)
          • Data Table on Gynecology - Market size and forecast 2024-2029 ($ million)
          • Chart on Gynecology - Year-over-year growth 2024-2029 (%)
          • Data Table on Gynecology - Year-over-year growth 2024-2029 (%)
        • 10.7 Others - Market size and forecast 2024-2029
          • Chart on Others - Market size and forecast 2024-2029 ($ million)
          • Data Table on Others - Market size and forecast 2024-2029 ($ million)
          • Chart on Others - Year-over-year growth 2024-2029 (%)
          • Data Table on Others - Year-over-year growth 2024-2029 (%)
        • 10.8 Market opportunity by Application
          • Market opportunity by Application ($ million)
          • Data Table on Market opportunity by Application ($ million)

        11 Customer Landscape

        • 11.1 Customer landscape overview
          • Analysis of price sensitivity, lifecycle, customer purchase basket, adoption rates, and purchase criteria

        12 Geographic Landscape

        • 12.1 Geographic segmentation
          • Chart on Market share by geography 2024-2029 (%)
          • Data Table on Market share by geography 2024-2029 (%)
        • 12.2 Geographic comparison
          • Chart on Geographic comparison
          • Data Table on Geographic comparison
        • 12.3 North America - Market size and forecast 2024-2029
          • Chart on North America - Market size and forecast 2024-2029 ($ million)
          • Data Table on North America - Market size and forecast 2024-2029 ($ million)
          • Chart on North America - Year-over-year growth 2024-2029 (%)
          • Data Table on North America - Year-over-year growth 2024-2029 (%)
        • 12.4 Europe - Market size and forecast 2024-2029
          • Chart on Europe - Market size and forecast 2024-2029 ($ million)
          • Data Table on Europe - Market size and forecast 2024-2029 ($ million)
          • Chart on Europe - Year-over-year growth 2024-2029 (%)
          • Data Table on Europe - Year-over-year growth 2024-2029 (%)
        • 12.5 Asia - Market size and forecast 2024-2029
          • Chart on Asia - Market size and forecast 2024-2029 ($ million)
          • Data Table on Asia - Market size and forecast 2024-2029 ($ million)
          • Chart on Asia - Year-over-year growth 2024-2029 (%)
          • Data Table on Asia - Year-over-year growth 2024-2029 (%)
        • 12.6 Rest of World (ROW) - Market size and forecast 2024-2029
          • Chart on Rest of World (ROW) - Market size and forecast 2024-2029 ($ million)
          • Data Table on Rest of World (ROW) - Market size and forecast 2024-2029 ($ million)
          • Chart on Rest of World (ROW) - Year-over-year growth 2024-2029 (%)
          • Data Table on Rest of World (ROW) - Year-over-year growth 2024-2029 (%)
        • 12.7 US - Market size and forecast 2024-2029
          • Chart on US - Market size and forecast 2024-2029 ($ million)
          • Data Table on US - Market size and forecast 2024-2029 ($ million)
          • Chart on US - Year-over-year growth 2024-2029 (%)
          • Data Table on US - Year-over-year growth 2024-2029 (%)
        • 12.8 China - Market size and forecast 2024-2029
          • Chart on China - Market size and forecast 2024-2029 ($ million)
          • Data Table on China - Market size and forecast 2024-2029 ($ million)
          • Chart on China - Year-over-year growth 2024-2029 (%)
          • Data Table on China - Year-over-year growth 2024-2029 (%)
        • 12.9 Canada - Market size and forecast 2024-2029
          • Chart on Canada - Market size and forecast 2024-2029 ($ million)
          • Data Table on Canada - Market size and forecast 2024-2029 ($ million)
          • Chart on Canada - Year-over-year growth 2024-2029 (%)
          • Data Table on Canada - Year-over-year growth 2024-2029 (%)
        • 12.10 Japan - Market size and forecast 2024-2029
          • Chart on Japan - Market size and forecast 2024-2029 ($ million)
          • Data Table on Japan - Market size and forecast 2024-2029 ($ million)
          • Chart on Japan - Year-over-year growth 2024-2029 (%)
          • Data Table on Japan - Year-over-year growth 2024-2029 (%)
        • 12.11 Germany - Market size and forecast 2024-2029
          • Chart on Germany - Market size and forecast 2024-2029 ($ million)
          • Data Table on Germany - Market size and forecast 2024-2029 ($ million)
          • Chart on Germany - Year-over-year growth 2024-2029 (%)
          • Data Table on Germany - Year-over-year growth 2024-2029 (%)
        • 12.12 India - Market size and forecast 2024-2029
          • Chart on India - Market size and forecast 2024-2029 ($ million)
          • Data Table on India - Market size and forecast 2024-2029 ($ million)
          • Chart on India - Year-over-year growth 2024-2029 (%)
          • Data Table on India - Year-over-year growth 2024-2029 (%)
        • 12.13 UK - Market size and forecast 2024-2029
          • Chart on UK - Market size and forecast 2024-2029 ($ million)
          • Data Table on UK - Market size and forecast 2024-2029 ($ million)
          • Chart on UK - Year-over-year growth 2024-2029 (%)
          • Data Table on UK - Year-over-year growth 2024-2029 (%)
        • 12.14 France - Market size and forecast 2024-2029
          • Chart on France - Market size and forecast 2024-2029 ($ million)
          • Data Table on France - Market size and forecast 2024-2029 ($ million)
          • Chart on France - Year-over-year growth 2024-2029 (%)
          • Data Table on France - Year-over-year growth 2024-2029 (%)
        • 12.15 Brazil - Market size and forecast 2024-2029
          • Chart on Brazil - Market size and forecast 2024-2029 ($ million)
          • Data Table on Brazil - Market size and forecast 2024-2029 ($ million)
          • Chart on Brazil - Year-over-year growth 2024-2029 (%)
          • Data Table on Brazil - Year-over-year growth 2024-2029 (%)
        • 12.16 Italy - Market size and forecast 2024-2029
          • Chart on Italy - Market size and forecast 2024-2029 ($ million)
          • Data Table on Italy - Market size and forecast 2024-2029 ($ million)
          • Chart on Italy - Year-over-year growth 2024-2029 (%)
          • Data Table on Italy - Year-over-year growth 2024-2029 (%)
        • 12.17 Market opportunity by geography
          • Market opportunity by geography ($ million)
          • Data Tables on Market opportunity by geography ($ million)

        13 Drivers, Challenges, and Opportunity/Restraints

        • 13.1 Market drivers
          • 13.2 Market challenges
            • 13.3 Impact of drivers and challenges
              • Impact of drivers and challenges in 2024 and 2029
            • 13.4 Market opportunities/restraints

              14 Competitive Landscape

              • 14.1 Overview
                • 14.2 Competitive Landscape
                  • Overview on criticality of inputs and factors of differentiation
                • 14.3 Landscape disruption
                  • Overview on factors of disruption
                • 14.4 Industry risks
                  • Impact of key risks on business

                15 Competitive Analysis

                • 15.1 Companies profiled
                  • Companies covered
                • 15.2 Company ranking index
                  • Company ranking index
                • 15.3 Market positioning of companies
                  • Matrix on companies position and classification
                • 15.4 AGITO Medical
                  • AGITO Medical - Overview
                  • AGITO Medical - Product / Service
                  • AGITO Medical - Key offerings
                  • SWOT
                • 15.5 Avante Health Solutions
                  • Avante Health Solutions - Overview
                  • Avante Health Solutions - Product / Service
                  • Avante Health Solutions - Key offerings
                  • SWOT
                • 15.6 Block Imaging Inc.
                  • Block Imaging Inc. - Overview
                  • Block Imaging Inc. - Product / Service
                  • Block Imaging Inc. - Key offerings
                  • SWOT
                • 15.7 EverX Pty Ltd.
                  • EverX Pty Ltd. - Overview
                  • EverX Pty Ltd. - Product / Service
                  • EverX Pty Ltd. - Key offerings
                  • SWOT
                • 15.8 GE Healthcare Technologies Inc.
                  • GE Healthcare Technologies Inc. - Overview
                  • GE Healthcare Technologies Inc. - Business segments
                  • GE Healthcare Technologies Inc. - Key news
                  • GE Healthcare Technologies Inc. - Key offerings
                  • GE Healthcare Technologies Inc. - Segment focus
                  • SWOT
                • 15.9 Hilditch Group Ltd.
                  • Hilditch Group Ltd. - Overview
                  • Hilditch Group Ltd. - Product / Service
                  • Hilditch Group Ltd. - Key offerings
                  • SWOT
                • 15.10 Integrity Medical Systems Inc.
                  • Integrity Medical Systems Inc. - Overview
                  • Integrity Medical Systems Inc. - Product / Service
                  • Integrity Medical Systems Inc. - Key offerings
                  • SWOT
                • 15.11 Koninklijke Philips NV
                  • Koninklijke Philips NV - Overview
                  • Koninklijke Philips NV - Business segments
                  • Koninklijke Philips NV - Key news
                  • Koninklijke Philips NV - Key offerings
                  • Koninklijke Philips NV - Segment focus
                  • SWOT
                • 15.12 Master Medical Systems Pvt. Ltd.
                  • Master Medical Systems Pvt. Ltd. - Overview
                  • Master Medical Systems Pvt. Ltd. - Product / Service
                  • Master Medical Systems Pvt. Ltd. - Key offerings
                  • SWOT
                • 15.13 Radiology Oncology Systems Inc.
                  • Radiology Oncology Systems Inc. - Overview
                  • Radiology Oncology Systems Inc. - Product / Service
                  • Radiology Oncology Systems Inc. - Key offerings
                  • SWOT
                • 15.14 Siemens Healthineers AG
                  • Siemens Healthineers AG - Overview
                  • Siemens Healthineers AG - Business segments
                  • Siemens Healthineers AG - Key news
                  • Siemens Healthineers AG - Key offerings
                  • Siemens Healthineers AG - Segment focus
                  • SWOT
                • 15.15 Soma Technology
                  • Soma Technology - Overview
                  • Soma Technology - Product / Service
                  • Soma Technology - Key offerings
                  • SWOT
                • 15.16 Ultra Imaging Solutions LLC.
                  • Ultra Imaging Solutions LLC. - Overview
                  • Ultra Imaging Solutions LLC. - Product / Service
                  • Ultra Imaging Solutions LLC. - Key offerings
                  • SWOT
                • 15.17 US Med Equip
                  • US Med Equip - Overview
                  • US Med Equip - Product / Service
                  • US Med Equip - Key offerings
                  • SWOT
                • 15.18 Whittemore Enterprises Inc.
                  • Whittemore Enterprises Inc. - Overview
                  • Whittemore Enterprises Inc. - Product / Service
                  • Whittemore Enterprises Inc. - Key offerings
                  • SWOT

                16 Appendix

                • 16.1 Scope of the report
                  • 16.2 Inclusions and exclusions checklist
                    • Inclusions checklist
                    • Exclusions checklist
                  • 16.3 Currency conversion rates for US$
                    • Currency conversion rates for US$
                  • 16.4 Research methodology
                    • Research methodology
                  • 16.5 Data procurement
                    • Information sources
                  • 16.6 Data validation
                    • Data validation
                  • 16.7 Validation techniques employed for market sizing
                    • Validation techniques employed for market sizing
                  • 16.8 Data synthesis
                    • Data synthesis
                  • 16.9 360 degree market analysis
                    • 360 degree market analysis
                  • 16.10 List of abbreviations
                    • List of abbreviations

                  Research Methodology

                  Technavio presents a detailed picture of the market by way of study, synthesis, and summation of data from multiple sources. The analysts have presented the various facets of the market with a particular focus on identifying the key industry influencers. The data thus presented is comprehensive, reliable, and the result of extensive research, both primary and secondary.

                  INFORMATION SOURCES

                  Primary sources

                  • Manufacturers and suppliers
                  • Channel partners
                  • Industry experts
                  • Strategic decision makers

                  Secondary sources

                  • Industry journals and periodicals
                  • Government data
                  • Financial reports of key industry players
                  • Historical data
                  • Press releases

                  DATA ANALYSIS

                  Data Synthesis

                  • Collation of data
                  • Estimation of key figures
                  • Analysis of derived insights

                  Data Validation

                  • Triangulation with data models
                  • Reference against proprietary databases
                  • Corroboration with industry experts

                  REPORT WRITING

                  Qualitative

                  • Market drivers
                  • Market challenges
                  • Market trends
                  • Five forces analysis

                  Quantitative

                  • Market size and forecast
                  • Market segmentation
                  • Geographical insights
                  • Competitive landscape

                  Interested in this report?

                  Get your sample now to see our research methodology and insights!

                  Download Now

                  Frequently Asked Questions

                  Refurbished Medical Imaging Equipment market growth will increase by $ 7684.8 mn during 2025-2029 .

                  The Refurbished Medical Imaging Equipment market is expected to grow at a CAGR of 8.5% during 2025-2029 .

                  Refurbished Medical Imaging Equipment market is segmented by Product( X-ray imaging, Ultrasound systems, MRI, CT scanner imaging, SPECT/ PET scanners) End-user( Hospitals, Diagnostic centers) Application( Cardiovascular, Oncology, Orthopedics, Gynecology, Others)

                  AGITO Medical, Avante Health Solutions, Block Imaging Inc., EverX Pty Ltd., Fair Medical Co. Ltd., GE Healthcare Technologies Inc., Hi Tech International Group Inc., Hilditch Group Ltd., Integrity Medical Systems Inc., Koninklijke Philips NV, Master Medical Systems Pvt. Ltd., Nationwide Imaging Services Inc, Pacific Healthcare Imaging, Radiology Oncology Systems Inc., Siemens Healthineers AG, Soma Technology, Ultra Imaging Solutions LLC., US Med Equip, Venture Medical ReQuip Inc., Whittemore Enterprises Inc. are a few of the key vendors in the Refurbished Medical Imaging Equipment market.

                  Asia will register the highest growth rate of 38% among the other regions. Therefore, the Refurbished Medical Imaging Equipment market in Asia is expected to garner significant business opportunities for the vendors during the forecast period.

                  US, Canada, China, Germany, Japan, UK, France, Brazil, Italy, India

                  • Increasing demand for cost-effective and efficient medical imaging devicesMost of the global population does not have access to quality healthcare services is the driving factor this market.
                  • especially in developing countries. High research and development and manufacturing costs are involved in the design and development of new advanced medical imaging equipment. Hence is the driving factor this market.
                  • new medical imaging equipment is highly expensive. The cost burden will be more when coupled with the installation and maintenance charges for the equipment is the driving factor this market.
                  • making them unaffordable for many hospitals and diagnostic centers due to budget constraints. Refurbished medical imaging devices are considered an alternative to new devices by these healthcare service providers. Refurbished medical imaging equipment results in significant cost savings compared with new devices. The cost of refurbished medical imaging equipment depends on the age of the system and its condition. The adoption of high-end refurbished medical imaging devices from major suppliers such as GE Healthcare is the driving factor this market.
                  • Siemens Healthineers is the driving factor this market.
                  • and Philips Healthcare results in about 20% of cost savings. The adoption of refurbished equipment helps hospitals and diagnostic centers to upgrade their diagnostic capability and provide an accurate diagnosis to patients at a low cost compared with the new systems. The increase in medical tourism in the countries of Asia is attracting more private hospitals and clinics to compete with larger hospitals by providing efficient services at low cost to their customers. This results in the increasing adoption of refurbished medical imaging equipment during the forecast period. is the driving factor this market.

                  The Refurbished Medical Imaging Equipment market vendors should focus on grabbing business opportunities from the X-ray imaging segment as it accounted for the largest market share in the base year.