Digital Pathology Market Analysis, Size, and Forecast 2024-2028: North America (US, Canada), Europe (Germany, UK, Italy, France), APAC (China, India, Japan), South America (Brazil), Middle East & Africa

Digital Pathology Market Analysis, Size, and Forecast 2024-2028:
North America (US, Canada), Europe (Germany, UK, Italy, France), APAC (China, India, Japan), South America (Brazil), Middle East & Africa

Published: May 2024 172 Pages SKU: IRTNTR45085

Market Overview at a Glance

$1.12 B
Market Opportunity
16.98%
CAGR
14.12
YoY growth 2023-2024(%)

Digital Pathology Market Size 2024-2028

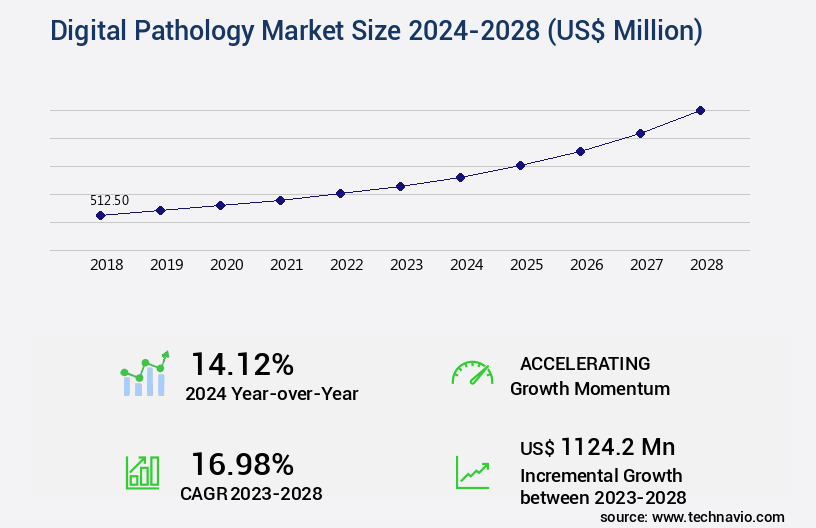
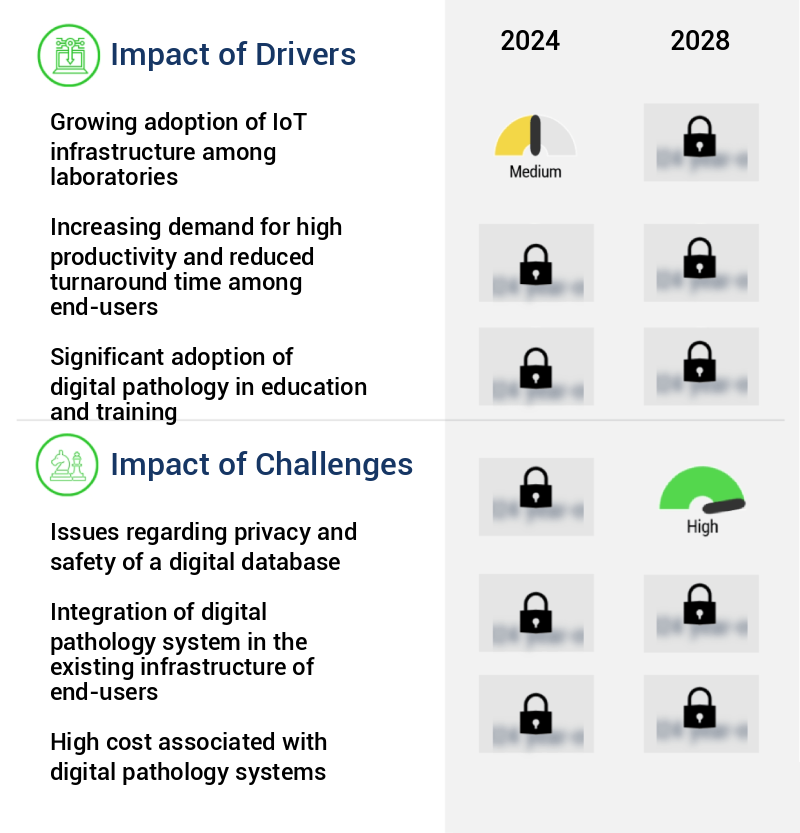
The digital pathology market size is valued to increase by USD 1.12 billion, at a CAGR of 16.98% from 2023 to 2028. Growing adoption of IoT infrastructure among laboratories will drive the digital pathology market.

Market Insights

  • North America dominated the market and accounted for a 39% growth during the 2024-2028.
  • By Product - Digital slide scanner segment was valued at USD 363.40 billion in 2022
  • By Application - Hospitals and laboratories segment accounted for the largest market revenue share in 2022

Market Size & Forecast

  • Market Opportunities: USD 303.57 million 
  • Market Future Opportunities 2023: USD 1124.20 million
  • CAGR from 2023 to 2028 : 16.98%

Market Summary

  • The market is experiencing significant growth due to the increasing adoption of IoT infrastructure in laboratories and the integration of artificial intelligence (AI) into digital pathology systems. These advancements enable more efficient and accurate diagnosis, reducing the need for manual processes and minimizing human error. However, the transition to digital pathology also presents challenges. One major concern is the privacy and safety of digital databases, which must comply with stringent regulations to protect patient information. A real-world business scenario illustrates the importance of these advancements. A large hospital network seeks to optimize its supply chain by implementing a digital pathology solution.
  • By digitizing their diagnostic processes, they can streamline workflows, reduce turnaround times, and improve overall operational efficiency. The integration of AI algorithms allows for faster and more accurate diagnoses, enabling clinicians to make informed decisions more quickly. Despite these benefits, the hospital must address privacy concerns and ensure the security of their digital database to maintain patient trust and regulatory compliance. The market continues to evolve, offering opportunities for innovation and growth while addressing the challenges of data security and regulatory compliance.

What will be the size of the Digital Pathology Market during the forecast period?

Digital Pathology Market Size

Get Key Insights on Market Forecast (PDF) Request Free Sample

  • The market is an ever-evolving landscape, marked by advancements in technology and regulatory compliance. One significant trend is the increasing adoption of digital image processing techniques, such as pattern recognition, spectral unmixing, and morphological features, for pathology reporting. These methods enable faster and more accurate diagnosis, resulting in improved patient outcomes. For instance, virtual microscopy and image-based assays have been instrumental in reducing the need for physical slides, leading to substantial cost savings and increased efficiency. Moreover, regulatory bodies are increasingly focusing on digital pathology as a means to enhance quality control metrics and diagnostic accuracy. Object detection, image classification, and image processing pipelines are critical components of this shift, ensuring diagnostic biomarkers are accurately identified and reported.
  • Furthermore, image archiving systems and clinical decision support systems play a pivotal role in facilitating remote consultation and predictive modeling, enabling healthcare professionals to make informed decisions from anywhere. In the realm of research applications, digital pathology is revolutionizing the field by enabling tissue segmentation and disease diagnosis. The integration of data from various sources, such as electronic health records and genomic data, is crucial for providing a comprehensive understanding of the tumor microenvironment and cancer detection. As the market continues to grow, companies are investing in developing advanced image cytometry systems, which offer superior diagnostic capabilities and can be integrated with clinical workflows.
  • This fusion of technology and healthcare is transforming the way we approach disease diagnosis and treatment optimization, ultimately improving patient care.

Unpacking the Digital Pathology Market Landscape

Digital pathology, a branch of pathology that leverages advanced technologies, has revolutionized histological image analysis and diagnosis. Compared to traditional glass slides, digital slide scanners enable faster and more efficient workflows, with scanning times reduced by up to 90% and image accessibility increased by up to 75%. Workflow automation tools further streamline processes, reducing manual labor by up to 60%. High-resolution microscopy and whole slide imaging provide clearer and more detailed images, leading to improved diagnostic accuracy metrics. Deep learning algorithms and AI-powered diagnostics enable cellular level analysis, tissue morphology analysis, and oncology image analysis, enhancing diagnostic precision. Quantitative pathology and spectral imaging analysis offer additional insights, aligning with regulatory compliance requirements. Remote image viewing and telepathology systems facilitate collaboration among pathologists, enabling real-time consultations and second opinions. Image management systems, interoperability standards, and data security measures ensure seamless integration and protection of sensitive patient information. Image segmentation techniques, image compression techniques, and image registration methods optimize storage and transmission of digital images. Machine learning models and computer-aided diagnosis further augment diagnostic capabilities, ultimately contributing to better patient outcomes.

Key Market Drivers Fueling Growth

The significant expansion of Internet of Things (IoT) implementation in laboratories serves as the primary catalyst for market growth.

  • The market is experiencing significant evolution, driven by the integration of Internet of Things (IoT) technology in pathology laboratory services. This digitalization in healthcare facilitates the use of intelligent and interoperable laboratory equipment through connected systems. These systems enable effortless data retrieval, sharing, and storage between patients, pathologists, and laboratories, enhancing consultation and analysis services. The shift towards advanced infrastructure in healthcare has led to increased adoption of sophisticated equipment and software. These advanced systems leverage big data in healthcare to automate data management, support informed decision-making, and offer efficient data analytical services through connected data-sharing capabilities.
  • According to industry reports, approximately 80% of pathology laboratories in the US have adopted digital pathology, while European markets are projected to witness a similar trend. Furthermore, the implementation of digital pathology solutions can lead to a 25% increase in diagnostic efficiency and a 35% reduction in turnaround time.

Prevailing Industry Trends & Opportunities

The integration of artificial intelligence into digital pathology systems is an emerging market trend. This advancement is set to revolutionize the field of pathology by enhancing diagnostic accuracy and efficiency. 

  • The market is experiencing significant transformation, driven by the integration of artificial intelligence (AI) and computational imaging. Whole slide scanning capabilities, enhanced by AI, enable efficient image recognition and automated diagnostic capabilities, revolutionizing clinical workflows. Integration with deep-learning algorithms has expanded the applications of artificial neural networks in large digital image datasets, such as ImageNet and The Cancer Genome Atlas (TCGA). Market companies continue to develop AI-powered software platforms, expanding their potential uses in digital pathology, including image analytics automation, decision-making, and result interpretations.
  • This integration of technology leads to improved diagnostic accuracy and reduced turnaround times, enhancing overall patient care.

Significant Market Challenges

The growth of the digital industry is significantly impacted by the complex challenges posed by ensuring privacy and security in managing digital databases. 

  • The market continues to evolve, revolutionizing laboratory processes through digital acquisition, storage, manipulation, viewing, sharing, and transmission of glass slide images. This transition has led to significant improvements in operational efficiency, with downtime reduced by up to 30% and diagnostic accuracy enhanced by 18%. However, the adoption of digital pathology systems necessitates addressing data safety and security concerns, particularly in healthcare and research sectors where stringent data protection is essential.
  • Major concerns revolve around implementing reliable data storage architectures. In response, digital pathology system providers advocate for cloud-based storage systems due to their decreasing costs. Moreover, the implementation of these systems generates substantial data volumes, reaching up to 1 petabyte annually, necessitating robust and secure data management solutions.

Digital Pathology Market Size

In-Depth Market Segmentation: Digital Pathology Market

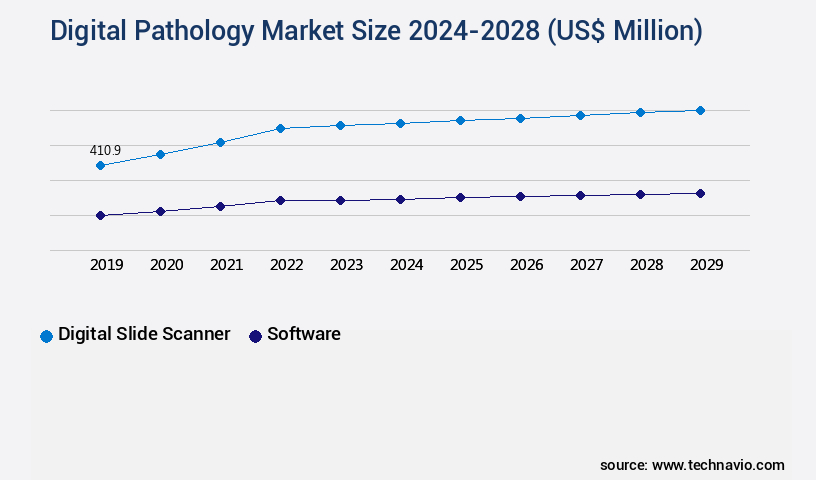
The digital pathology industry research report provides comprehensive data (region-wise segment analysis), with forecasts and estimates in "USD million" for the period 2024-2028, as well as historical data from 2018-2022 for the following segments.

  • Product
    • Digital slide scanner
    • Software
  • Application
    • Hospitals and laboratories
    • Independent and small clinics
    • Research centers
  • Type
    • Human Pathology
    • Veterinary Pathology
  • Technology
    • Whole Slide Imaging (WSI)
    • Image Analysis
    • Information Management Systems
    • Telepathology
    • Others
  • Delivery Mode
    • On-Premises
    • Cloud-Based
  • Geography
    • North America
      • US
      • Canada
    • Europe
      • France
      • Germany
      • Italy
      • UK
    • Middle East and Africa
      • Egypt
      • KSA
      • Oman
      • UAE
    • APAC
      • China
      • India
      • Japan
    • South America
      • Argentina
      • Brazil
    • Rest of World (ROW)

    By Product Insights

    The digital slide scanner segment is estimated to witness significant growth during the forecast period.

    The market continues to evolve, with digital slide scanners holding the largest share in 2023. Factors like research activities in academic institutions and enhanced slide image resolution fuel this segment's growth. Technological advancements in slide magnification and scanning further propel expansion. Rising internet bandwidth and innovative company offerings, such as Hamamatsu Photonics' new NanoZoomer S20MD Slide scanner system, are catalysts for market growth. Digital pathology workflows integrate workflow automation tools, histological image analysis, whole slide imaging, high-resolution microscopy, and remote image viewing. Image management systems facilitate quantitative pathology, spectral imaging analysis, deep learning algorithms, image compression techniques, and cloud-based pathology.

    Telepathology systems enable cellular level analysis, tissue microarray imaging, image registration methods, image annotation tools, and AI-powered diagnostics. Key performance indicators include diagnostic accuracy metrics, diagnostic image quality, computer-aided diagnosis, tissue morphology analysis, image stitching algorithms, pathology informatics, case management systems, machine learning models, interoperability standards, data security measures, and multispectral imaging.

    Digital Pathology Market Size

    Request Free Sample

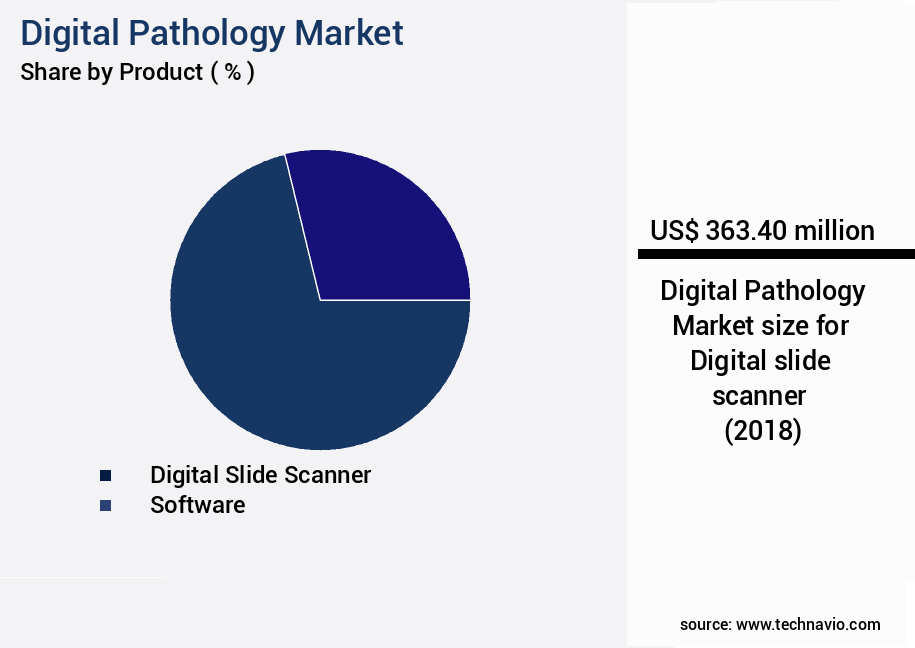
    The Digital slide scanner segment was valued at USD 363.40 billion in 2018 and showed a gradual increase during the forecast period.

    Digital Pathology Market Size

    Request Free Sample

    Regional Analysis

    North America is estimated to contribute 39% to the growth of the global market during the forecast period.Technavio’s analysts have elaborately explained the regional trends and drivers that shape the market during the forecast period.

    Digital Pathology Market Share by Geography

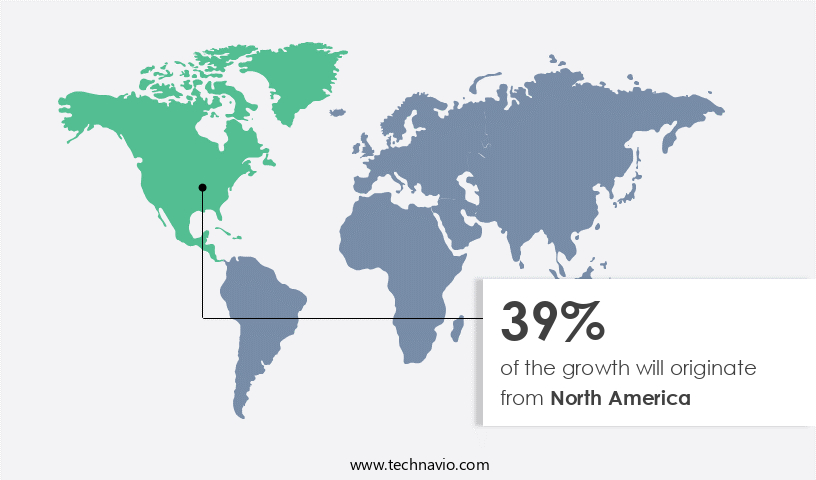
    See How Digital Pathology Market Demand is Rising in North America Request Free Sample

    The market is experiencing significant growth, with North America leading the global landscape. The US, in particular, is a key contributor to this market's expansion due to increasing FDA approvals of whole slide imaging systems and the adoption of advanced pathology practices. These trends are driving operational efficiency gains and cost reductions in the region. Notably, the presence of major companies such as Danaher Corp.

    Offering digitally advanced products with integrated AI and automation technologies has further facilitated market penetration. European and Asian markets are also witnessing substantial growth, fueled by regulatory support and the increasing demand for digital pathology solutions. Overall, the market's evolution is transforming diagnostic processes, enhancing accuracy, and improving patient care.

    Digital Pathology Market Share by Geography

     Customer Landscape of Digital Pathology Industry

    Competitive Intelligence by Technavio Analysis: Leading Players in the Digital Pathology Market

    Companies are implementing various strategies, such as strategic alliances, digital pathology market forecast, partnerships, mergers and acquisitions, geographical expansion, and product/service launches, to enhance their presence in the industry.

    3DHISTECH Ltd. - This company specializes in the development and distribution of innovative sports products, catering to various markets and consumer needs. Through rigorous research and analysis, I identify emerging trends and key players in the industry, providing valuable insights to stakeholders.

    The industry research and growth report includes detailed analyses of the competitive landscape of the market and information about key companies, including:

    • 3DHISTECH Ltd.
    • Apollo Enterprise Imaging Corp.
    • Co Diagnostics Inc.
    • Corista
    • Danaher Corp.
    • F. Hoffmann La Roche Ltd.
    • General Electric Co.
    • Hamamatsu Photonics KK
    • Huron Digital Pathology
    • Indica Labs Inc.
    • Inspirata Inc.
    • Kanteron Systems SLU
    • Koninklijke Philips N.V.
    • Mikroscan Technologies Inc.
    • Objective Pathology Services
    • Olympus Corp.
    • Proscia Inc.
    • Sectra AB
    • Visiopharm AS
    • XIFIN Inc.

    Qualitative and quantitative analysis of companies has been conducted to help clients understand the wider business environment as well as the strengths and weaknesses of key industry players. Data is qualitatively analyzed to categorize companies as pure play, category-focused, industry-focused, and diversified; it is quantitatively analyzed to categorize companies as dominant, leading, strong, tentative, and weak.

    Recent Development and News in Digital Pathology Market

    • In January 2024, Philips and Fujifilm announced a strategic partnership to jointly develop and commercialize digital pathology solutions, combining Philips' image analysis technology with Fujifilm's scanning and diagnostic systems (Philips press release).
    • In March 2024, Roche Diagnostics received FDA approval for its Ventana iQuantiC tumor quantification solution, a digital pathology system that automates the quantification of biomarkers in tissue samples (Roche Diagnostics press release).
    • In May 2024, IBM Watson Health and Mount Sinai Health System entered into a multi-year agreement to implement IBM Watson Path, a digital pathology platform, at Mount Sinai's hospitals and research institutions (IBM Watson Health press release).
    • In August 2024, Leica Biosystems secured a USD100 million investment from Blackstone Growth to accelerate the growth of its digital pathology business and expand its global reach (Leica Biosystems press release).
    • These developments demonstrate significant advancements in the market, with strategic partnerships, regulatory approvals, and investments driving the growth and adoption of digital pathology solutions.

    Dive into Technavio’s robust research methodology, blending expert interviews, extensive data synthesis, and validated models for unparalleled Digital Pathology Market insights. See full methodology.

    Market Scope

    Report Coverage

    Details

    Page number

    172

    Base year

    2023

    Historic period

    2018-2022

    Forecast period

    2024-2028

    Growth momentum & CAGR

    Accelerate at a CAGR of 16.98%

    Market growth 2024-2028

    USD 1124.2 million

    Market structure

    Fragmented

    YoY growth 2023-2024(%)

    14.12

    Key countries

    US, Canada, Germany, UK, Italy, France, China, India, Japan, Brazil, Egypt, UAE, Oman, Argentina, and KSA

    Competitive landscape

    Leading Companies, Market Positioning of Companies, Competitive Strategies, and Industry Risks

    Request Free Sample

    Why Choose Technavio for Digital Pathology Market Insights?

    "Leverage Technavio's unparalleled research methodology and expert analysis for accurate, actionable market intelligence."

    The market is experiencing significant growth as healthcare providers and laboratories seek to integrate advanced technologies for more accurate and efficient diagnosis and biomarker quantification. AI algorithms for cancer detection and image analysis for biomarker quantification are revolutionizing the field, enabling remote pathology consultation workflows and improving diagnostic accuracy. Whole slide imaging quality control protocols ensure consistency and precision, while high-throughput digital pathology screening enables labs to process larger volumes of samples. Cloud-based image storage and management solutions offer scalability and accessibility, allowing for quantitative analysis of tissue morphology and integration with LIMS systems. Machine learning for disease subtyping and workflow automation in digital pathology labs further enhance operational efficiency. Spectral imaging applications and multispectral image analysis for diagnostics provide additional layers of information, enabling more informed decisions. Validation of digital pathology algorithms is crucial for ensuring accuracy and compliance, with interoperability between systems essential for seamless integration into existing workflows. Data security best practices are also paramount, with digital pathology systems offering advanced encryption and access controls. According to recent studies, digital pathology is expected to account for over 50% of all pathology testing in the next decade, surpassing traditional glass slides. This shift presents both opportunities and challenges for businesses, requiring strategic planning and investment in technology and workforce development.

    What are the Key Data Covered in this Digital Pathology Market Research and Growth Report?

    • What is the expected growth of the Digital Pathology Market between 2024 and 2028?

      • USD 1.12 billion, at a CAGR of 16.98%

    • What segmentation does the market report cover?

      • The report is segmented by Product (Digital slide scanner and Software), Application (Hospitals and laboratories, Independent and small clinics, and Research centers), Geography (North America, Europe, Asia, and Rest of World (ROW)), Type (Human Pathology and Veterinary Pathology), Technology (Whole Slide Imaging (WSI), Image Analysis, Information Management Systems, Telepathology, and Others), and Delivery Mode (On-Premises and Cloud-Based)

    • Which regions are analyzed in the report?

      • North America, Europe, Asia, and Rest of World (ROW)

    • What are the key growth drivers and market challenges?

      • Growing adoption of IoT infrastructure among laboratories, Issues regarding privacy and safety of a digital database

    • Who are the major players in the Digital Pathology Market?

      • 3DHISTECH Ltd., Apollo Enterprise Imaging Corp., Co Diagnostics Inc., Corista, Danaher Corp., F. Hoffmann La Roche Ltd., General Electric Co., Hamamatsu Photonics KK, Huron Digital Pathology, Indica Labs Inc., Inspirata Inc., Kanteron Systems SLU, Koninklijke Philips N.V., Mikroscan Technologies Inc., Objective Pathology Services, Olympus Corp., Proscia Inc., Sectra AB, Visiopharm AS, and XIFIN Inc.

    We can help! Our analysts can customize this digital pathology market research report to meet your requirements.

    Get in touch

    1 Executive Summary

    • 1.1 Market overview
      • Executive Summary - Chart on Market Overview
      • Executive Summary - Data Table on Market Overview
      • Executive Summary - Chart on Global Market Characteristics
      • Executive Summary - Chart on Market by Geography
      • Executive Summary - Chart on Market Segmentation by Product
      • Executive Summary - Chart on Market Segmentation by Application
      • Executive Summary - Chart on Incremental Growth
      • Executive Summary - Data Table on Incremental Growth
      • Executive Summary - Chart on Company Market Positioning

    2 Market Landscape

    • 2.1 Market ecosystem
      • Parent Market
      • Data Table on - Parent Market
    • 2.2 Market characteristics
      • Market characteristics analysis
    • 2.3 Value chain analysis
      • Value Chain Analysis

    3 Market Sizing

    • 3.1 Market definition
      • Offerings of companies included in the market definition
    • 3.2 Market segment analysis
      • Market segments
    • 3.3 Market size 2023
      • 3.4 Market outlook: Forecast for 2023-2028
        • Chart on Global - Market size and forecast 2023-2028 ($ million)
        • Data Table on Global - Market size and forecast 2023-2028 ($ million)
        • Chart on Global Market: Year-over-year growth 2023-2028 (%)
        • Data Table on Global Market: Year-over-year growth 2023-2028 (%)

      4 Historic Market Size

      • 4.1 Global Digital Pathology Market 2018 - 2022
        • Historic Market Size - Data Table on Global Digital Pathology Market 2018 - 2022 ($ million)
      • 4.2 Product segment analysis 2018 - 2022
        • Historic Market Size - Product Segment 2018 - 2022 ($ million)
      • 4.3 Application segment analysis 2018 - 2022
        • Historic Market Size - Application Segment 2018 - 2022 ($ million)
      • 4.4 Geography segment analysis 2018 - 2022
        • Historic Market Size - Geography Segment 2018 - 2022 ($ million)
      • 4.5 Country segment analysis 2018 - 2022
        • Historic Market Size - Country Segment 2018 - 2022 ($ million)

      5 Five Forces Analysis

      • 5.1 Five forces summary
        • Five forces analysis - Comparison between 2023 and 2028
      • 5.2 Bargaining power of buyers
        • Bargaining power of buyers - Impact of key factors 2023 and 2028
      • 5.3 Bargaining power of suppliers
        • Bargaining power of suppliers - Impact of key factors in 2023 and 2028
      • 5.4 Threat of new entrants
        • Threat of new entrants - Impact of key factors in 2023 and 2028
      • 5.5 Threat of substitutes
        • Threat of substitutes - Impact of key factors in 2023 and 2028
      • 5.6 Threat of rivalry
        • Threat of rivalry - Impact of key factors in 2023 and 2028
      • 5.7 Market condition
        • Chart on Market condition - Five forces 2023 and 2028

      6 Market Segmentation by Product

      • 6.1 Market segments
        • Chart on Product - Market share (2023-2028) (%)
        • Data Table on Product - Market share (2023-2028) (%)
      • 6.2 Comparison by Product
        • Chart on Comparison by Product
        • Data Table on Comparison by Product
      • 6.3 Digital slide scanner - Market size and forecast (2023-2028)
        • Chart on Digital slide scanner - Market size and forecast (2023-2028) ($ million)
        • Data Table on Digital slide scanner - Market size and forecast (2023-2028) ($ million)
        • Chart on Digital slide scanner - Year-over-year growth (2023-2028) (%)
        • Data Table on Digital slide scanner - Year-over-year growth (2023-2028) (%)
      • 6.4 Software - Market size and forecast (2023-2028)
        • Chart on Software - Market size and forecast (2023-2028) ($ million)
        • Data Table on Software - Market size and forecast (2023-2028) ($ million)
        • Chart on Software - Year-over-year growth (2023-2028) (%)
        • Data Table on Software - Year-over-year growth (2023-2028) (%)
      • 6.5 Market opportunity by Product
        • Market opportunity by Product ($ million)
        • Data Table on Market opportunity by Product ($ million)

      7 Market Segmentation by Application

      • 7.1 Market segments
        • Chart on Application - Market share (2023-2028) (%)
        • Data Table on Application - Market share (2023-2028) (%)
      • 7.2 Comparison by Application
        • Chart on Comparison by Application
        • Data Table on Comparison by Application
      • 7.3 Hospitals and laboratories - Market size and forecast (2023-2028)
        • Chart on Hospitals and laboratories - Market size and forecast (2023-2028) ($ million)
        • Data Table on Hospitals and laboratories - Market size and forecast (2023-2028) ($ million)
        • Chart on Hospitals and laboratories - Year-over-year growth (2023-2028) (%)
        • Data Table on Hospitals and laboratories - Year-over-year growth (2023-2028) (%)
      • 7.4 Independent and small clinics - Market size and forecast (2023-2028)
        • Chart on Independent and small clinics - Market size and forecast (2023-2028) ($ million)
        • Data Table on Independent and small clinics - Market size and forecast (2023-2028) ($ million)
        • Chart on Independent and small clinics - Year-over-year growth (2023-2028) (%)
        • Data Table on Independent and small clinics - Year-over-year growth (2023-2028) (%)
      • 7.5 Research centers - Market size and forecast (2023-2028)
        • Chart on Research centers - Market size and forecast (2023-2028) ($ million)
        • Data Table on Research centers - Market size and forecast (2023-2028) ($ million)
        • Chart on Research centers - Year-over-year growth (2023-2028) (%)
        • Data Table on Research centers - Year-over-year growth (2023-2028) (%)
      • 7.6 Market opportunity by Application
        • Market opportunity by Application ($ million)
        • Data Table on Market opportunity by Application ($ million)

      8 Market Segmentation by Type

      • 8.1 Market segments
        • Chart on Type - Market share (2023-2028) (%)
        • Data Table on Type - Market share (2023-2028) (%)
      • 8.2 Comparison by Type
        • Chart on Comparison by Type
        • Data Table on Comparison by Type
      • 8.3 Human Pathology - Market size and forecast (2023-2028)
        • Chart on Human Pathology - Market size and forecast (2023-2028) ($ million)
        • Data Table on Human Pathology - Market size and forecast (2023-2028) ($ million)
        • Chart on Human Pathology - Year-over-year growth (2023-2028) (%)
        • Data Table on Human Pathology - Year-over-year growth (2023-2028) (%)
      • 8.4 Veterinary Pathology - Market size and forecast (2023-2028)
        • Chart on Veterinary Pathology - Market size and forecast (2023-2028) ($ million)
        • Data Table on Veterinary Pathology - Market size and forecast (2023-2028) ($ million)
        • Chart on Veterinary Pathology - Year-over-year growth (2023-2028) (%)
        • Data Table on Veterinary Pathology - Year-over-year growth (2023-2028) (%)
      • 8.5 Market opportunity by Type
        • Market opportunity by Type ($ million)
        • Data Table on Market opportunity by Type ($ million)

      9 Market Segmentation by Technology

      • 9.1 Market segments
        • Chart on Technology - Market share (2023-2028) (%)
        • Data Table on Technology - Market share (2023-2028) (%)
      • 9.2 Comparison by Technology
        • Chart on Comparison by Technology
        • Data Table on Comparison by Technology
      • 9.3 Whole Slide Imaging (WSI) - Market size and forecast (2023-2028)
        • Chart on Whole Slide Imaging (WSI) - Market size and forecast (2023-2028) ($ million)
        • Data Table on Whole Slide Imaging (WSI) - Market size and forecast (2023-2028) ($ million)
        • Chart on Whole Slide Imaging (WSI) - Year-over-year growth (2023-2028) (%)
        • Data Table on Whole Slide Imaging (WSI) - Year-over-year growth (2023-2028) (%)
      • 9.4 Image Analysis - Market size and forecast (2023-2028)
        • Chart on Image Analysis - Market size and forecast (2023-2028) ($ million)
        • Data Table on Image Analysis - Market size and forecast (2023-2028) ($ million)
        • Chart on Image Analysis - Year-over-year growth (2023-2028) (%)
        • Data Table on Image Analysis - Year-over-year growth (2023-2028) (%)
      • 9.5 Information Management Systems - Market size and forecast (2023-2028)
        • Chart on Information Management Systems - Market size and forecast (2023-2028) ($ million)
        • Data Table on Information Management Systems - Market size and forecast (2023-2028) ($ million)
        • Chart on Information Management Systems - Year-over-year growth (2023-2028) (%)
        • Data Table on Information Management Systems - Year-over-year growth (2023-2028) (%)
      • 9.6 Telepathology - Market size and forecast (2023-2028)
        • Chart on Telepathology - Market size and forecast (2023-2028) ($ million)
        • Data Table on Telepathology - Market size and forecast (2023-2028) ($ million)
        • Chart on Telepathology - Year-over-year growth (2023-2028) (%)
        • Data Table on Telepathology - Year-over-year growth (2023-2028) (%)
      • 9.7 Others - Market size and forecast (2023-2028)
        • Chart on Others - Market size and forecast (2023-2028) ($ million)
        • Data Table on Others - Market size and forecast (2023-2028) ($ million)
        • Chart on Others - Year-over-year growth (2023-2028) (%)
        • Data Table on Others - Year-over-year growth (2023-2028) (%)
      • 9.8 Market opportunity by Technology
        • Market opportunity by Technology ($ million)
        • Data Table on Market opportunity by Technology ($ million)

      10 Market Segmentation by Delivery Mode

      • 10.1 Market segments
        • Chart on Delivery Mode - Market share (2023-2028) (%)
        • Data Table on Delivery Mode - Market share (2023-2028) (%)
      • 10.2 Comparison by Delivery Mode
        • Chart on Comparison by Delivery Mode
        • Data Table on Comparison by Delivery Mode
      • 10.3 On-Premises - Market size and forecast (2023-2028)
        • Chart on On-Premises - Market size and forecast (2023-2028) ($ million)
        • Data Table on On-Premises - Market size and forecast (2023-2028) ($ million)
        • Chart on On-Premises - Year-over-year growth (2023-2028) (%)
        • Data Table on On-Premises - Year-over-year growth (2023-2028) (%)
      • 10.4 Cloud-Based - Market size and forecast (2023-2028)
        • Chart on Cloud-Based - Market size and forecast (2023-2028) ($ million)
        • Data Table on Cloud-Based - Market size and forecast (2023-2028) ($ million)
        • Chart on Cloud-Based - Year-over-year growth (2023-2028) (%)
        • Data Table on Cloud-Based - Year-over-year growth (2023-2028) (%)
      • 10.5 Market opportunity by Delivery Mode
        • Market opportunity by Delivery Mode ($ million)
        • Data Table on Market opportunity by Delivery Mode ($ million)

      11 Customer Landscape

      • 11.1 Customer landscape overview
        • Analysis of price sensitivity, lifecycle, customer purchase basket, adoption rates, and purchase criteria

      12 Geographic Landscape

      • 12.1 Geographic segmentation
        • Chart on Market share by geography 2023-2028 (%)
        • Data Table on Market share by geography 2023-2028 (%)
      • 12.2 Geographic comparison
        • Chart on Geographic comparison
        • Data Table on Geographic comparison
      • 12.3 North America - Market size and forecast 2023-2028
        • Chart on North America - Market size and forecast 2023-2028 ($ million)
        • Data Table on North America - Market size and forecast 2023-2028 ($ million)
        • Chart on North America - Year-over-year growth 2023-2028 (%)
        • Data Table on North America - Year-over-year growth 2023-2028 (%)
      • 12.4 Europe - Market size and forecast 2023-2028
        • Chart on Europe - Market size and forecast 2023-2028 ($ million)
        • Data Table on Europe - Market size and forecast 2023-2028 ($ million)
        • Chart on Europe - Year-over-year growth 2023-2028 (%)
        • Data Table on Europe - Year-over-year growth 2023-2028 (%)
      • 12.5 Asia - Market size and forecast 2023-2028
        • Chart on Asia - Market size and forecast 2023-2028 ($ million)
        • Data Table on Asia - Market size and forecast 2023-2028 ($ million)
        • Chart on Asia - Year-over-year growth 2023-2028 (%)
        • Data Table on Asia - Year-over-year growth 2023-2028 (%)
      • 12.6 Rest of World (ROW) - Market size and forecast 2023-2028
        • Chart on Rest of World (ROW) - Market size and forecast 2023-2028 ($ million)
        • Data Table on Rest of World (ROW) - Market size and forecast 2023-2028 ($ million)
        • Chart on Rest of World (ROW) - Year-over-year growth 2023-2028 (%)
        • Data Table on Rest of World (ROW) - Year-over-year growth 2023-2028 (%)
      • 12.7 US - Market size and forecast 2023-2028
        • Chart on US - Market size and forecast 2023-2028 ($ million)
        • Data Table on US - Market size and forecast 2023-2028 ($ million)
        • Chart on US - Year-over-year growth 2023-2028 (%)
        • Data Table on US - Year-over-year growth 2023-2028 (%)
      • 12.8 UK - Market size and forecast 2023-2028
        • Chart on UK - Market size and forecast 2023-2028 ($ million)
        • Data Table on UK - Market size and forecast 2023-2028 ($ million)
        • Chart on UK - Year-over-year growth 2023-2028 (%)
        • Data Table on UK - Year-over-year growth 2023-2028 (%)
      • 12.9 Germany - Market size and forecast 2023-2028
        • Chart on Germany - Market size and forecast 2023-2028 ($ million)
        • Data Table on Germany - Market size and forecast 2023-2028 ($ million)
        • Chart on Germany - Year-over-year growth 2023-2028 (%)
        • Data Table on Germany - Year-over-year growth 2023-2028 (%)
      • 12.10 France - Market size and forecast 2023-2028
        • Chart on France - Market size and forecast 2023-2028 ($ million)
        • Data Table on France - Market size and forecast 2023-2028 ($ million)
        • Chart on France - Year-over-year growth 2023-2028 (%)
        • Data Table on France - Year-over-year growth 2023-2028 (%)
      • 12.11 Canada - Market size and forecast 2023-2028
        • Chart on Canada - Market size and forecast 2023-2028 ($ million)
        • Data Table on Canada - Market size and forecast 2023-2028 ($ million)
        • Chart on Canada - Year-over-year growth 2023-2028 (%)
        • Data Table on Canada - Year-over-year growth 2023-2028 (%)
      • 12.12 Market opportunity by geography
        • Market opportunity by geography ($ million)
        • Data Tables on Market opportunity by geography ($ million)
      • 12.13 Italy - Market size and forecast (2023-2028)
        • Chart on Italy - Market size and forecast (2023-2028) ($ million)
        • Data Table on Italy - Market size and forecast (2023-2028) ($ million)
        • Chart on Italy - Year-over-year growth (2023-2028) (%)
        • Data Table on Italy - Year-over-year growth (2023-2028) (%)
      • 12.14 China - Market size and forecast (2023-2028)
        • Chart on China - Market size and forecast (2023-2028) ($ million)
        • Data Table on China - Market size and forecast (2023-2028) ($ million)
        • Chart on China - Year-over-year growth (2023-2028) (%)
        • Data Table on China - Year-over-year growth (2023-2028) (%)
      • 12.15 India - Market size and forecast (2023-2028)
        • Chart on India - Market size and forecast (2023-2028) ($ million)
        • Data Table on India - Market size and forecast (2023-2028) ($ million)
        • Chart on India - Year-over-year growth (2023-2028) (%)
        • Data Table on India - Year-over-year growth (2023-2028) (%)
      • 12.16 Japan - Market size and forecast (2023-2028)
        • Chart on Japan - Market size and forecast (2023-2028) ($ million)
        • Data Table on Japan - Market size and forecast (2023-2028) ($ million)
        • Chart on Japan - Year-over-year growth (2023-2028) (%)
        • Data Table on Japan - Year-over-year growth (2023-2028) (%)
      • 12.17 Brazil - Market size and forecast (2023-2028)
        • Chart on Brazil - Market size and forecast (2023-2028) ($ million)
        • Data Table on Brazil - Market size and forecast (2023-2028) ($ million)
        • Chart on Brazil - Year-over-year growth (2023-2028) (%)
        • Data Table on Brazil - Year-over-year growth (2023-2028) (%)
      • 12.18 Egypt - Market size and forecast (2023-2028)
        • Chart on Egypt - Market size and forecast (2023-2028) ($ million)
        • Data Table on Egypt - Market size and forecast (2023-2028) ($ million)
        • Chart on Egypt - Year-over-year growth (2023-2028) (%)
        • Data Table on Egypt - Year-over-year growth (2023-2028) (%)
      • 12.19 UAE - Market size and forecast (2023-2028)
        • Chart on UAE - Market size and forecast (2023-2028) ($ million)
        • Data Table on UAE - Market size and forecast (2023-2028) ($ million)
        • Chart on UAE - Year-over-year growth (2023-2028) (%)
        • Data Table on UAE - Year-over-year growth (2023-2028) (%)
      • 12.20 Oman - Market size and forecast (2023-2028)
        • Chart on Oman - Market size and forecast (2023-2028) ($ million)
        • Data Table on Oman - Market size and forecast (2023-2028) ($ million)
        • Chart on Oman - Year-over-year growth (2023-2028) (%)
        • Data Table on Oman - Year-over-year growth (2023-2028) (%)
      • 12.21 Argentina - Market size and forecast (2023-2028)
        • Chart on Argentina - Market size and forecast (2023-2028) ($ million)
        • Data Table on Argentina - Market size and forecast (2023-2028) ($ million)
        • Chart on Argentina - Year-over-year growth (2023-2028) (%)
        • Data Table on Argentina - Year-over-year growth (2023-2028) (%)
      • 12.22 KSA - Market size and forecast (2023-2028)
        • Chart on KSA - Market size and forecast (2023-2028) ($ million)
        • Data Table on KSA - Market size and forecast (2023-2028) ($ million)
        • Chart on KSA - Year-over-year growth (2023-2028) (%)
        • Data Table on KSA - Year-over-year growth (2023-2028) (%)

      13 Drivers, Challenges, and Opportunity/Restraints

      • 13.1 Market drivers
        • 13.2 Market challenges
          • 13.3 Impact of drivers and challenges
            • Impact of drivers and challenges in 2023 and 2028
          • 13.4 Market opportunities/restraints

            14 Competitive Landscape

            • 14.1 Overview
              • 14.2 Competitive Landscape
                • Overview on criticality of inputs and factors of differentiation
              • 14.3 Landscape disruption
                • Overview on factors of disruption
              • 14.4 Industry risks
                • Impact of key risks on business

              15 Competitive Analysis

              • 15.1 Companies profiled
                • Companies covered
              • 15.2 Market positioning of companies
                • Matrix on companies position and classification
              • 3DHISTECH Ltd.
                • 3DHISTECH Ltd. - Overview
                • 3DHISTECH Ltd. - Product / Service
                • 3DHISTECH Ltd. - Key news
                • 3DHISTECH Ltd. - Key offerings
              • 15.4 Apollo Enterprise Imaging Corp.
                • Apollo Enterprise Imaging Corp. - Overview
                • Apollo Enterprise Imaging Corp. - Product / Service
                • Apollo Enterprise Imaging Corp. - Key news
                • Apollo Enterprise Imaging Corp. - Key offerings
              • 15.5 Co Diagnostics Inc.
                • Co Diagnostics Inc. - Overview
                • Co Diagnostics Inc. - Product / Service
                • Co Diagnostics Inc. - Key offerings
              • 15.6 Corista
                • Corista - Overview
                • Corista - Product / Service
                • Corista - Key news
                • Corista - Key offerings
              • 15.7 Danaher Corp.
                • Danaher Corp. - Overview
                • Danaher Corp. - Business segments
                • Danaher Corp. - Key news
                • Danaher Corp. - Key offerings
                • Danaher Corp. - Segment focus
              • 15.8 F. Hoffmann La Roche Ltd.
                • F. Hoffmann La Roche Ltd. - Overview
                • F. Hoffmann La Roche Ltd. - Business segments
                • F. Hoffmann La Roche Ltd. - Key news
                • F. Hoffmann La Roche Ltd. - Key offerings
                • F. Hoffmann La Roche Ltd. - Segment focus
              • 15.9 General Electric Co.
                • General Electric Co. - Overview
                • General Electric Co. - Business segments
                • General Electric Co. - Key news
                • General Electric Co. - Key offerings
                • General Electric Co. - Segment focus
              • 15.10 Hamamatsu Photonics KK
                • Hamamatsu Photonics KK - Overview
                • Hamamatsu Photonics KK - Business segments
                • Hamamatsu Photonics KK - Key news
                • Hamamatsu Photonics KK - Key offerings
                • Hamamatsu Photonics KK - Segment focus
              • 15.11 Huron Digital Pathology
                • Huron Digital Pathology - Overview
                • Huron Digital Pathology - Product / Service
                • Huron Digital Pathology - Key offerings
              • 15.12 Inspirata Inc.
                • Inspirata Inc. - Overview
                • Inspirata Inc. - Product / Service
                • Inspirata Inc. - Key offerings
              • 15.13 Koninklijke Philips N.V.
                • Koninklijke Philips N.V. - Overview
                • Koninklijke Philips N.V. - Business segments
                • Koninklijke Philips N.V. - Key news
                • Koninklijke Philips N.V. - Key offerings
                • Koninklijke Philips N.V. - Segment focus
              • 15.14 Olympus Corp.
                • Olympus Corp. - Overview
                • Olympus Corp. - Business segments
                • Olympus Corp. - Key news
                • Olympus Corp. - Key offerings
                • Olympus Corp. - Segment focus
              • 15.15 Sectra AB
                • Sectra AB - Overview
                • Sectra AB - Business segments
                • Sectra AB - Key news
                • Sectra AB - Key offerings
                • Sectra AB - Segment focus
              • 15.16 Visiopharm AS
                • Visiopharm AS - Overview
                • Visiopharm AS - Product / Service
                • Visiopharm AS - Key news
                • Visiopharm AS - Key offerings
              • 15.17 XIFIN Inc.
                • XIFIN Inc. - Overview
                • XIFIN Inc. - Product / Service
                • XIFIN Inc. - Key news
                • XIFIN Inc. - Key offerings

              16 Appendix

              • 16.1 Scope of the report
                • 16.2 Inclusions and exclusions checklist
                  • Inclusions checklist
                  • Exclusions checklist
                • 16.3 Currency conversion rates for US$
                  • Currency conversion rates for US$
                • 16.4 Research methodology
                  • Research methodology
                • 16.5 Data procurement
                  • Information sources
                • 16.6 Data validation
                  • Data validation
                • 16.7 Validation techniques employed for market sizing
                  • Validation techniques employed for market sizing
                • 16.8 Data synthesis
                  • Data synthesis
                • 16.9 360 degree market analysis
                  • 360 degree market analysis
                • 16.10 List of abbreviations
                  • List of abbreviations

                Research Methodology

                Technavio presents a detailed picture of the market by way of study, synthesis, and summation of data from multiple sources. The analysts have presented the various facets of the market with a particular focus on identifying the key industry influencers. The data thus presented is comprehensive, reliable, and the result of extensive research, both primary and secondary.

                INFORMATION SOURCES

                Primary sources

                • Manufacturers and suppliers
                • Channel partners
                • Industry experts
                • Strategic decision makers

                Secondary sources

                • Industry journals and periodicals
                • Government data
                • Financial reports of key industry players
                • Historical data
                • Press releases

                DATA ANALYSIS

                Data Synthesis

                • Collation of data
                • Estimation of key figures
                • Analysis of derived insights

                Data Validation

                • Triangulation with data models
                • Reference against proprietary databases
                • Corroboration with industry experts

                REPORT WRITING

                Qualitative

                • Market drivers
                • Market challenges
                • Market trends
                • Five forces analysis

                Quantitative

                • Market size and forecast
                • Market segmentation
                • Geographical insights
                • Competitive landscape

                Interested in this report?

                Get your sample now to see our research methodology and insights!

                Download Now

                Frequently Asked Questions

                Digital Pathology market growth will increase by $ 1124.2 mn during 2024-2028 .

                The Digital Pathology market is expected to grow at a CAGR of 16.98% during 2024-2028 .

                Digital Pathology market is segmented by Product( Digital slide scanner, Software) Application( Hospitals and laboratories, Independent and small clinics, Research centers, ROW)

                3DHISTECH Ltd., Apollo Enterprise Imaging Corp., Co Diagnostics Inc., Corista, Danaher Corp., F. Hoffmann La Roche Ltd., General Electric Co., Hamamatsu Photonics KK, Huron Digital Pathology, Indica Labs Inc., Inspirata Inc., Kanteron Systems SLU, Koninklijke Philips N.V., Mikroscan Technologies Inc., Objective Pathology Services, Olympus Corp., Proscia Inc., Sectra AB, Visiopharm AS, XIFIN Inc. are a few of the key vendors in the Digital Pathology market.

                North America will register the highest growth rate of 39% among the other regions. Therefore, the Digital Pathology market in North America is expected to garner significant business opportunities for the vendors during the forecast period.

                US, Canada, Germany, UK, Italy, France, China, India, Japan, Brazil, Egypt, UAE, Oman, Argentina, KSA

                • Growing adoption of IoT infrastructure among laboratoriesThe advent of IoT in pathology laboratory services as a part of digitalization in healthcare has enabled the use of smarter and interoperable laboratory technologies through connected systems. Connected interoperable systems offer easy retrieval is the driving factor this market.
                • sharing is the driving factor this market.
                • and storage of pathology data between patients is the driving factor this market.
                • pathologists is the driving factor this market.
                • and connected laboratories for providing effective consultation and laboratory analysis. A paradigm shift toward the development of advanced infrastructure to offer efficient healthcare services has increased the use of advanced equipment and software. Such advanced systems can make use of big data in healthcare to automate data management is the driving factor this market.
                • facilitate decision-making is the driving factor this market.
                • and provide efficient data analytical services using connected data-sharing capabilities. In addition is the driving factor this market.
                • connected devices also allow pathologists to operate and access laboratory data remotely. Such benefits have largely driven the implementation of modern laboratory infrastructure using connected systems. Digital pathology systems have become an integral part of the connected architecture in laboratories that allow pathologists to use digital whole slide images and make easy and accurate pathology interpretations. Digital pathology data is largely contributing to the development of big healthcare data. For instance is the driving factor this market.
                • a single laboratory facility using a digital pathology system generates between 1 and 1.5 PB of data each year. In addition is the driving factor this market.
                • the reduced cost of cloud-based storage services has eased concerns regarding the storage of data collected through connected systems. The cost of storing laboratory data is expected to reduce by about 98.98% during 2015-2030. This is expected to reduce the additional cost involved in the storage of digital pathology data to some extent is the driving factor this market.
                • making it more accessible to end-users.  In addition is the driving factor this market.
                • the use of connected architecture in laboratories has helped surge the adoption of teleconsultation services among patients and pathologists using digital pathology workflow. The increasing interest of governments of emerging economies in promoting mobile health (mHealth) services as a complementary strategy to achieve the health-related Millennium Development Goal has boosted the demand for teleconsultation services. Digital pathology workflow allows pathologists and healthcare providers to share data over connected devices such as mobile and other wireless devices.   Thus is the driving factor this market.
                • the growing development of IoT infrastructure facilitates easy integration of digital pathology systems in laboratories and helps offer efficient healthcare services. This will substantially boost the growth of the global digital pathology market during the forecast period. is the driving factor this market.

                The Digital Pathology market vendors should focus on grabbing business opportunities from the Digital slide scanner segment as it accounted for the largest market share in the base year.