Refurbished Smartphone Market Size 2026-2030
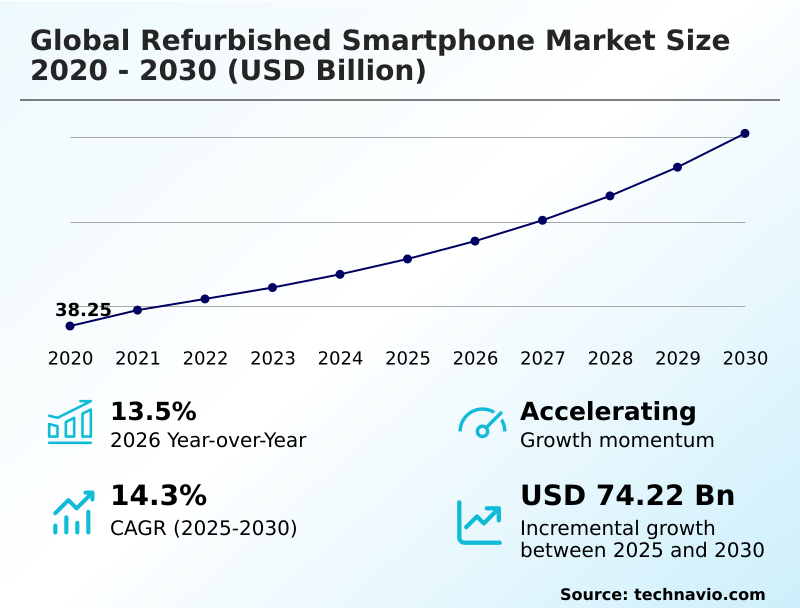
The refurbished smartphone market size is valued to increase by USD 74.22 billion, at a CAGR of 14.3% from 2025 to 2030. Expanding corporate sustainability mandates and ESG initiatives will drive the refurbished smartphone market.
Major Market Trends & Insights
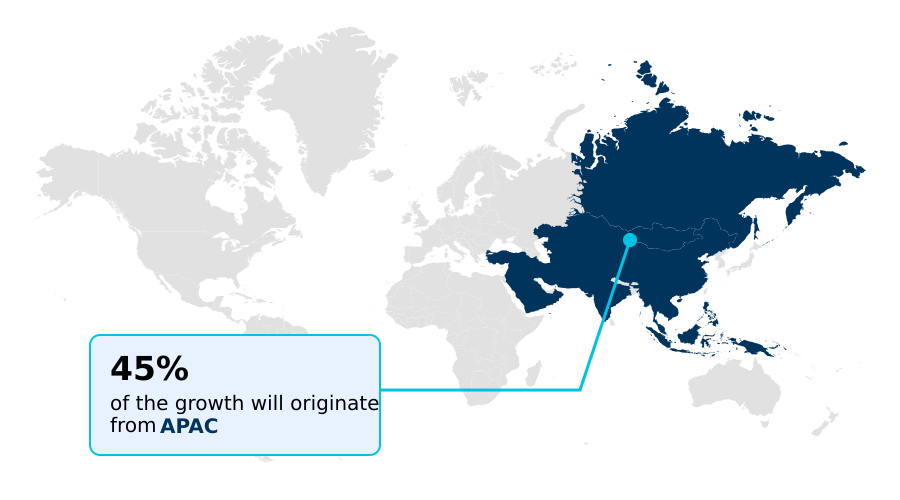
- APAC dominated the market and accounted for a 45.2% growth during the forecast period.
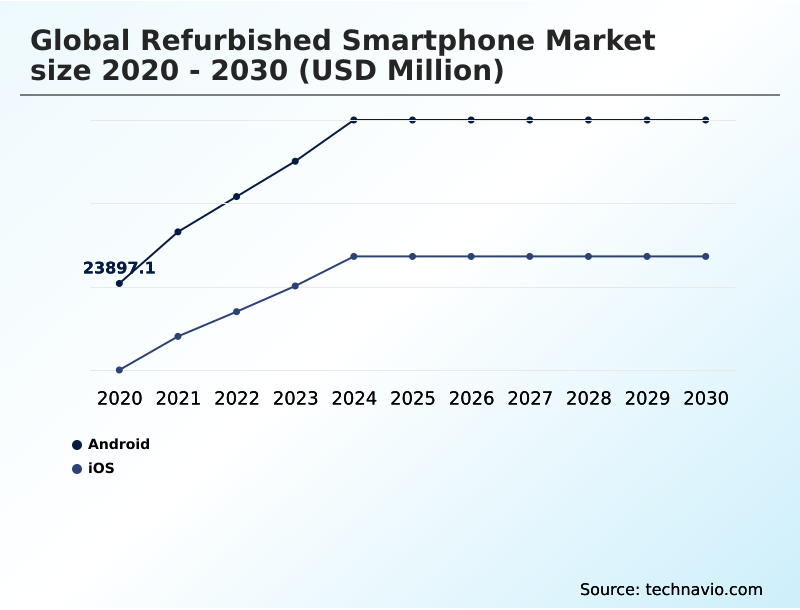
- By OS - Android segment was valued at USD 41.93 billion in 2024
- By Price Range - Low-priced segment accounted for the largest market revenue share in 2024
Market Size & Forecast
- Market Opportunities: USD 113.87 billion
- Market Future Opportunities: USD 74.22 billion
- CAGR from 2025 to 2030 : 14.3%
Market Summary
- The refurbished smartphone market is undergoing a significant professionalization, driven by consumer demand for sustainable, cost-effective technology and the formalization of manufacturer-backed certification programs. This evolution is defined by the integration of circular economy principles, where the lifecycle of premium devices is extended through meticulous resale and refurbishment.
- A key business scenario involves large enterprises overhauling their device procurement strategies; by sourcing devices from the secondary electronics market, they meet ESG objectives and reduce Scope 3 emissions. This institutional adoption is bolstered by the rise of specialized re-commerce marketplace platforms offering robust quality assurance services.
- However, the industry grapples with challenges like supply chain logistics and ensuring consistent functional and cosmetic grading across a diverse range of models. The implementation of AI-driven diagnostic tools is becoming crucial for standardizing the device refurbishment process, ensuring battery health verification, and maintaining high levels of product authenticity verification for all certified pre-owned devices.
What will be the Size of the Refurbished Smartphone Market during the forecast period?
Get Key Insights on Market Forecast (PDF) Get Free Sample
How is the Refurbished Smartphone Market Segmented?
The refurbished smartphone industry research report provides comprehensive data (region-wise segment analysis), with forecasts and estimates in "USD million" for the period 2026-2030, as well as historical data from 2020-2024 for the following segments.
- Os
- Android
- iOS
- Price range
- Low-priced
- Medium-priced
- Premium
- Distribution channel
- Online
- Offline
- Geography
- APAC
- China
- India
- Japan
- North America
- US
- Canada
- Mexico
- Europe
- Germany
- UK
- France
- South America
- Brazil
- Argentina
- Colombia
- Middle East and Africa
- South Africa
- UAE
- Saudi Arabia
- Rest of World (ROW)
- APAC
By OS Insights
The android segment is estimated to witness significant growth during the forecast period.
The Android segment represents a critical portion of the secondary hardware market, driven by a wide diversity of hardware and price points.
The device refurbishment process for these units is becoming highly standardized, with a focus on used smartphone quality control to ensure reliability. Professional remanufacturing entities are implementing rigorous functional and cosmetic grading, leveraging device grading automation to improve consistency.
Adherence to strict component replacement standards and aftermarket parts quality is crucial for maintaining consumer trust.
This professionalization, which has improved defect detection by over 25%, supports resale value stabilization and ensures product authenticity verification, making certified pre-owned Android devices a viable alternative to new mid-range options and a key component of sustainable mobile technology.
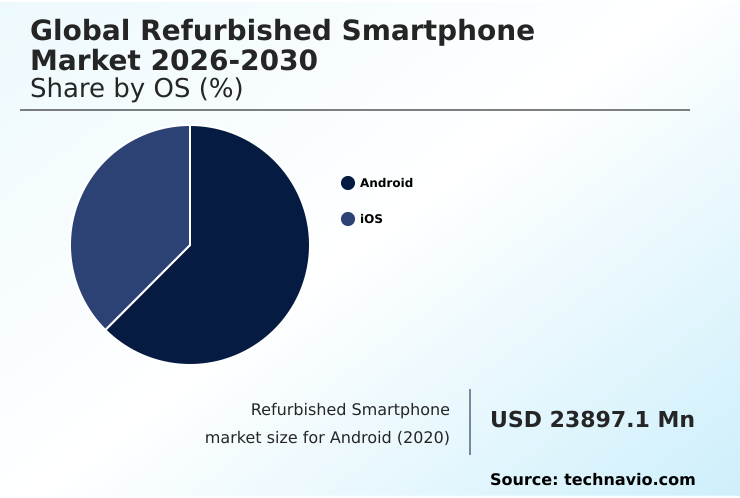
The Android segment was valued at USD 41.93 billion in 2024 and showed a gradual increase during the forecast period.
Regional Analysis
APAC is estimated to contribute 45.2% to the growth of the global market during the forecast period.Technavio’s analysts have elaborately explained the regional trends and drivers that shape the market during the forecast period.
See How Refurbished Smartphone Market Demand is Rising in APAC Get Free Sample
The global landscape is characterized by distinct regional dynamics. APAC leads, contributing over 45% of the incremental growth, driven by demand for affordable, high-tier technology and the expansion of organized re-commerce.
In this region, professional remanufacturing hubs are scaling up to meet a 40% rise in direct-to-consumer demand. North America represents a mature secondary hardware market defined by carrier-led trade-in programs, which source a significant volume of certified pre-owned devices.
Europe's market is heavily influenced by regulation, promoting digital device circularity and device lifecycle management.
Across all regions, strict data sanitization protocols and battery health verification are becoming standard for pre-owned hardware procurement, reinforcing trust in the secondary electronics market and supporting robust circular supply chain models.
Market Dynamics
Our researchers analyzed the data with 2025 as the base year, along with the key drivers, trends, and challenges. A holistic analysis of drivers will help companies refine their marketing strategies to gain a competitive advantage.
- The future of the re-commerce industry is intricately linked to several strategic factors. The impact of ESG on device procurement is compelling corporations to reconsider hardware lifecycles, with many analyzing the benefits of circular economy in electronics. This shift makes corporate trade-in program efficiency a key performance indicator.
- A central debate involves OEM certified refurbished vs third-party restored devices, a comparison that directly influences consumer trust in refurbished products. The adoption of AI in smartphone grading and pricing is revolutionizing how value is assessed, leading to more transparent and dynamic markets.
- Concurrently, the right to repair impact on refurbishment, supported by evolving legal frameworks for electronics reuse, is lowering operational barriers. However, significant challenges in refurbished device supply chain and the need to manage e-waste from mobile devices persist.
- The refurbished phone quality assurance process is critical, focusing on standardizing cosmetic grading for phones and ensuring robust data security in device refurbishment. For consumers, the decision between premium vs budget refurbished phone value is shaped by the role of marketplaces in secondary electronics, which are defining the economic drivers of the secondary market.
- Firms that successfully optimize reverse logistics for electronics can achieve lifecycle management cost reductions of over 15% compared to traditional models.
What are the key market drivers leading to the rise in the adoption of Refurbished Smartphone Industry?
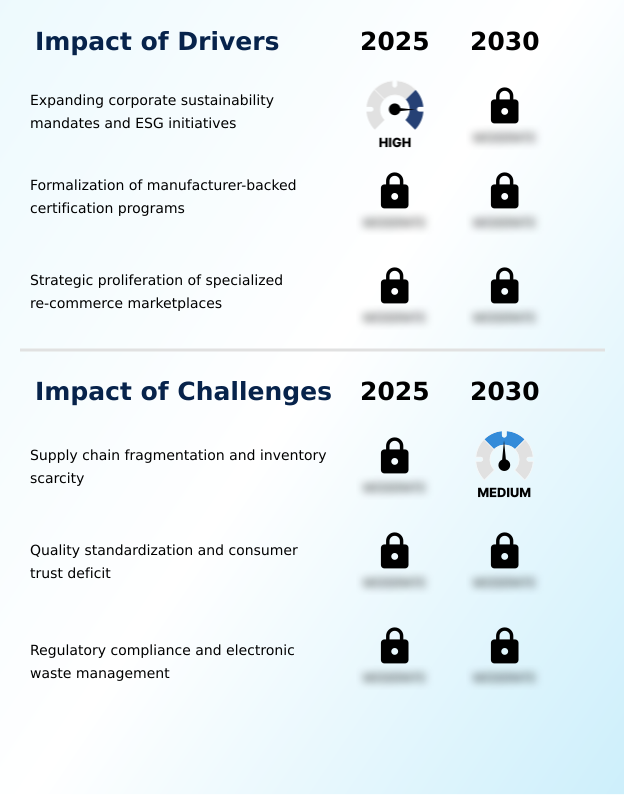
- Expanding corporate sustainability mandates and Environmental, Social, and Governance (ESG) initiatives are key drivers for the market, compelling organizations to adopt circular economy practices.
- Market growth is significantly driven by corporate and consumer shifts toward sustainability.
- The adoption of circular economy principles, especially within corporate ESG strategies, is fueling bulk procurement of pre-owned devices, with some enterprises reducing their hardware-related carbon footprint by up to 50%.
- The direct involvement of OEMs in the secondary electronics market through certified programs is also crucial, enhancing consumer trust and stabilizing trade-in value optimization. This formalization addresses previous market fragmentation.
- Additionally, the proliferation of specialized re-commerce marketplace platforms has transformed accessibility, with leading platforms seeing a 36% increase in new user acquisition.
- These hubs for resale and refurbishment streamline device trade-in services and aggregate inventory, making electronics reuse and recycling a mainstream consumer option and facilitating more efficient secondary market inventory sourcing.
What are the market trends shaping the Refurbished Smartphone Industry?
- A defining market trend is the institutionalization of premium certified pre-owned programs. This shift, led by original equipment manufacturers and large-scale retailers, aims to capture the high-value secondary market by offering quality guarantees.
- Key trends are professionalizing the market and enhancing consumer trust. The institutionalization of OEM certified re-newed programs is setting new benchmarks for quality, with some manufacturers reporting a 20% higher customer satisfaction rate compared to third-party channels.
- This is complemented by the rapid adoption of AI-driven diagnostic tools, which automate functional and cosmetic grading, increasing accuracy by up to 30% and enabling greater scalability. These systems often rely on proprietary diagnostic software for in-depth analysis. Furthermore, growing legislative support for the right to repair is expanding access to parts and schematics, which simplifies the device refurbishment process.
- This regulatory momentum, part of broader circular supply chain models, ensures that the market has a more consistent and higher-quality inventory, reinforcing the value of second-hand phone certification and quality assurance services.
What challenges does the Refurbished Smartphone Industry face during its growth?
- Supply chain fragmentation and inventory scarcity present a key challenge to industry growth, creating volatility in the availability of high-quality devices.
- The market faces persistent operational and regulatory challenges. Supply chain fragmentation remains a primary hurdle, as a significant volume of devices circulates in informal peer-to-peer resale alternatives, creating inventory scarcity for formal refurbishers.
- This inconsistency in mobile device remarketing is compounded by the challenge of maintaining refurbishment quality consistency across diverse models and conditions, which can impact the value of a certified renewed device warranty. Furthermore, navigating complex e-waste management regulations and extended producer responsibility laws imposes significant compliance costs.
- Balancing these rules with the practicalities of a global reverse logistics network for end-of-life device handling presents an ongoing operational test for all players managing the consumer electronics lifecycle, often requiring investments that can increase operational costs by 10-15%.
Exclusive Technavio Analysis on Customer Landscape
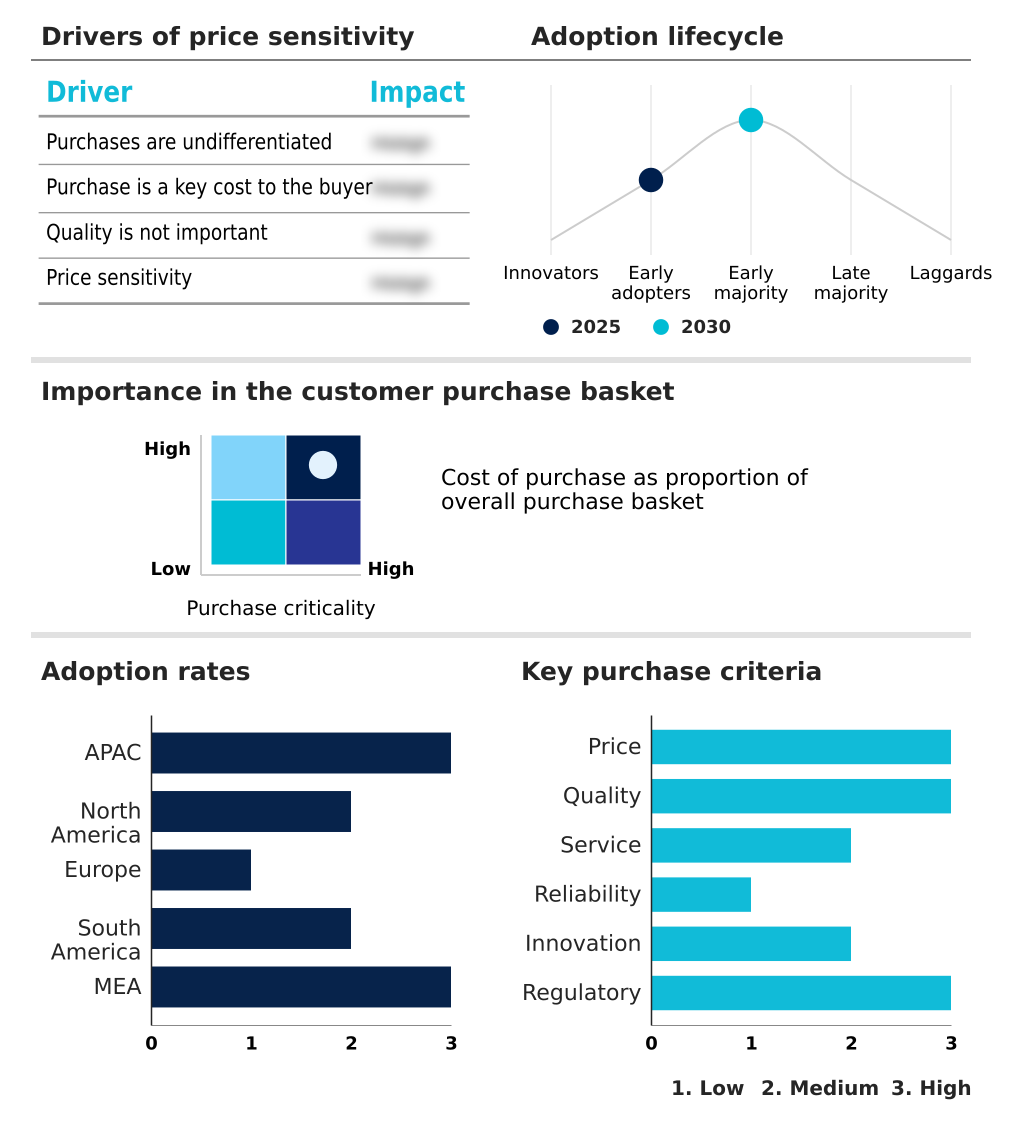
The refurbished smartphone market forecasting report includes the adoption lifecycle of the market, covering from the innovator’s stage to the laggard’s stage. It focuses on adoption rates in different regions based on penetration. Furthermore, the refurbished smartphone market report also includes key purchase criteria and drivers of price sensitivity to help companies evaluate and develop their market growth analysis strategies.
Customer Landscape of Refurbished Smartphone Industry
Competitive Landscape
Companies are implementing various strategies, such as strategic alliances, refurbished smartphone market forecast, partnerships, mergers and acquisitions, geographical expansion, and product/service launches, to enhance their presence in the industry.
4Gadgets Ltd. - Offerings are centered on a certified marketplace for pre-owned smartphones and consumer electronics, ensuring quality assurance and value for cost-conscious buyers.
The industry research and growth report includes detailed analyses of the competitive landscape of the market and information about key companies, including:
- 4Gadgets Ltd.
- Amazon.com Inc.
- Apple Inc.
- BACK MARKET Inc.
- Best Buy Co. Inc.
- Cashify
- ecoATM LLC.
- Gazelle Inc.
- Mobile Klinik
- musicMagpie plc
- Phonebot Pty Ltd.
- Reboxed Ltd.
- Recommerce Group
- Refurbed Marketplace GmbH
- Revibe FZCO
- Samsung Electronics Co. Ltd.
- Smart Cellular
- Swappie Oy
- The Big Phone Store Ltd.
Qualitative and quantitative analysis of companies has been conducted to help clients understand the wider business environment as well as the strengths and weaknesses of key industry players. Data is qualitatively analyzed to categorize companies as pure play, category-focused, industry-focused, and diversified; it is quantitatively analyzed to categorize companies as dominant, leading, strong, tentative, and weak.
Recent Development and News in Refurbished smartphone market
- In March, 2025, Back Market announced reaching a milestone of seventeen million active users, driven by a thirty-six percent increase in new user acquisition during the first half of the year.
- In March, 2025, Back Market highlighted its advocacy for the European Union Ecodesign Directive, leveraging the regulatory tailwinds to expand its network of certified refurbishers and promote repairability.
- In January, 2025, Samsung Electronics introduced its New Galaxy AI Subscription Club in selected markets, a program designed to increase the accessibility of its latest premium devices through structured trade-in cycles.
- In September, 2025, Back Market reported surpassing seventeen million active users globally, noting a growth trend driven by its curated selection of certified pre-owned smartphones backed by comprehensive buyer protections.
Dive into Technavio’s robust research methodology, blending expert interviews, extensive data synthesis, and validated models for unparalleled Refurbished Smartphone Market insights. See full methodology.
| Market Scope | |
|---|---|
| Page number | 286 |
| Base year | 2025 |
| Historic period | 2020-2024 |
| Forecast period | 2026-2030 |
| Growth momentum & CAGR | Accelerate at a CAGR of 14.3% |
| Market growth 2026-2030 | USD 74221.9 million |
| Market structure | Fragmented |
| YoY growth 2025-2026(%) | 13.5% |
| Key countries | China, India, Japan, South Korea, Australia, Singapore, US, Canada, Mexico, Germany, UK, France, Italy, Spain, Russia, Brazil, Argentina, Colombia, South Africa, UAE, Egypt, Saudi Arabia and Nigeria |
| Competitive landscape | Leading Companies, Market Positioning of Companies, Competitive Strategies, and Industry Risks |
Research Analyst Overview
- The refurbished smartphone market is maturing into a highly structured segment of the consumer electronics industry, moving beyond simple resale and refurbishment. A pivotal boardroom-level consideration is how to leverage OEM certified re-newed programs and the broader secondary electronics market to enhance brand loyalty and meet circular economy principles.
- The implementation of AI-driven diagnostic tools has become a competitive differentiator; these systems improve the device refurbishment process, with some operators reporting a 30% increase in processing throughput. This technological integration is essential for managing a consistent supply chain logistics network and ensuring rigorous quality assurance services, including component replacement standards and battery health verification.
- Adherence to data sanitization protocols and extended producer responsibility mandates for e-waste management are non-negotiable. As the market grows, so does the importance of the re-commerce marketplace in providing product authenticity verification and stabilizing resale value, addressing challenges related to end-of-life device handling and right-to-repair legislation.
What are the Key Data Covered in this Refurbished Smartphone Market Research and Growth Report?
-
What is the expected growth of the Refurbished Smartphone Market between 2026 and 2030?
-
USD 74.22 billion, at a CAGR of 14.3%
-
-
What segmentation does the market report cover?
-
The report is segmented by OS (Android, and iOS), Price Range (Low-priced, Medium-priced, and Premium), Distribution Channel (Online, and Offline) and Geography (APAC, North America, Europe, South America, Middle East and Africa)
-
-
Which regions are analyzed in the report?
-
APAC, North America, Europe, South America and Middle East and Africa
-
-
What are the key growth drivers and market challenges?
-
Expanding corporate sustainability mandates and ESG initiatives, Supply chain fragmentation and inventory scarcity
-
-
Who are the major players in the Refurbished Smartphone Market?
-
4Gadgets Ltd., Amazon.com Inc., Apple Inc., BACK MARKET Inc., Best Buy Co. Inc., Cashify, ecoATM LLC., Gazelle Inc., Mobile Klinik, musicMagpie plc, Phonebot Pty Ltd., Reboxed Ltd., Recommerce Group, Refurbed Marketplace GmbH, Revibe FZCO, Samsung Electronics Co. Ltd., Smart Cellular, Swappie Oy and The Big Phone Store Ltd.
-
Market Research Insights
- The market's dynamism is shaped by a convergence of economic and technological factors. The strategic implementation of mobile device remarketing and official pre-owned programs has become central to optimizing the consumer electronics lifecycle. Advanced device grading automation and stringent used smartphone quality control protocols are now standard, with some platforms reporting a 20% improvement in grading accuracy.
- This focus on refurbishment quality consistency and second-hand phone certification builds consumer trust. Furthermore, sustainable mobile technology is supported by electronics reuse and recycling initiatives and evolving environmental transparency mandates, which are reshaping circular supply chain models. As an alternative to peer-to-peer resale alternatives, the professional sector offers certified renewed device warranty options.
- Trade-in value optimization through corporate electronics buyback schemes has improved inventory turnover rates by over 15%, ensuring a steady flow for professional remanufacturing.
We can help! Our analysts can customize this refurbished smartphone market research report to meet your requirements.
 RIA -
RIA - 
