
Mobile Device Management (MDM) Market Size 2025-2029
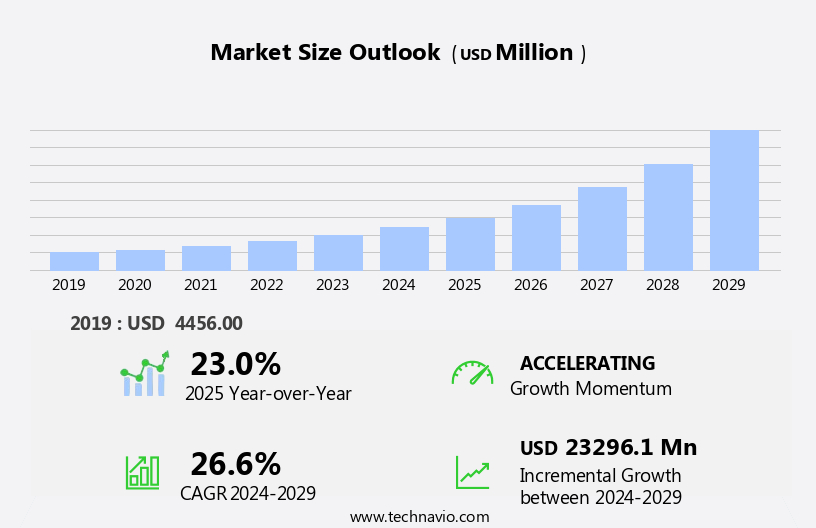
The mobile device management (MDM) market size is forecast to increase by USD 23.3 billion at a CAGR of 26.6% between 2024 and 2029.
- The market is experiencing significant growth, driven by the increasing use of mobile devices in enterprises and the subsequent demand for efficient methods to manage and secure these devices. This trend is further fueled by the availability of cloud-based MDM solutions, which offer scalability, flexibility, and cost savings. However, regulatory hurdles impact adoption, as organizations must ensure compliance with data privacy and security regulations when implementing MDM solutions. Supply chain inconsistencies also temper growth potential, as suppliers may not always deliver the latest technology or software updates in a timely manner. The market is experiencing significant growth due to the increasing use of mobile devices, such as smartphones and tablets, in enterprises. With Bring Your Own Device (BYOD) gaining popularity, securing these devices and ensuring data protection has become a top priority for businesses.
- Open-source MDM solutions offer an alternative for cost-conscious organizations, but they may lack the advanced features and support offered by proprietary solutions. To capitalize on market opportunities and navigate challenges effectively, companies should focus on addressing regulatory compliance, ensuring supply chain reliability, and offering a balance of features and affordability in their MDM solutions
What will be the Size of the Mobile Device Management (MDM) Market during the forecast period?
- The market is witnessing significant advancements with the integration of various technologies to enhance security and streamline device management. Biometric authentication and single sign-on solutions are gaining popularity, offering seamless access to corporate networks and applications. Mobile device integration with enterprise systems is becoming the norm, allowing for real-time data synchronization and improved productivity. Zero trust security approaches are being adopted, ensuring secure access to corporate data, even on personal devices. Mobile device backup and dashboard solutions provide businesses with essential data protection and visibility into their mobile fleets. Mobile threat intelligence solutions offer proactive security measures, while mobile device integrations and APIs facilitate seamless development and deployment of customized MDM solutions. MDM solutions are essential for managing the productivity of laptops, smartphones, and tablets running on Android, iOS, and other platforms.
- Device management consoles provide centralized control, enabling administrators to monitor, manage, and secure mobile devices effectively. Mobile device forensics and monitoring solutions offer valuable insights into potential security breaches and help maintain compliance with industry regulations. Overall, the MDM market is evolving rapidly, offering businesses innovative solutions to manage and secure their mobile devices and data.
How is this Mobile Device Management (MDM) Industry segmented?
The mobile device management (MDM) industry research report provides comprehensive data (region-wise segment analysis), with forecasts and estimates in "USD million" for the period 2025-2029, as well as historical data from 2019-2023 for the following segments.
- End-user
- Large enterprises
- SMEs
- Deployment
- On premise
- Cloud based
- Component
- Solutions
- Services
- Geography
- North America
- US
- Canada
- Europe
- France
- Germany
- UK
- APAC
- Australia
- China
- India
- Japan
- South Korea
- Rest of World (ROW)
- North America
By End-user Insights
The large enterprises segment is estimated to witness significant growth during the forecast period. In today's business landscape, mobile devices have become an integral part of enterprise operations, leading to a significant increase in mobile device adoption. However, this shift brings new challenges, such as data security, mobile device malware, and mobile device attacks. To mitigate these risks, large enterprises are turning to mobile device management (MDM) solutions. These solutions enable IT departments to centrally manage and monitor employee-owned and corporate-issued devices, ensuring compliance with security policies. Cloud-based MDM solutions offer the flexibility to manage devices remotely, while on-premises MDM caters to organizations with specific security requirements. Mobile device inventory management helps IT departments keep track of devices, while mobile app management ensures that only approved applications are used. Furthermore, the adoption of advanced technologies, including AI, big data, cloud, and the Internet of Things (IoT), in sectors such as finance, healthcare, retail, and telecommunications, is fueling the demand for BYOD and enterprise mobility solutions and services.
Mobile device configuration and remote device management enable IT departments to make changes to devices in real-time. Mobile device vulnerabilities, such as phishing and ransomware attacks, are a growing concern. MDM solutions provide data loss prevention, email security, and threat detection to safeguard sensitive information. Mobile device patching and upgrades ensure that devices are up-to-date with the latest security features. Mobile device hardware and employee productivity are also essential considerations. MDM solutions offer device provisioning, remote access, and endpoint security to ensure optimal device performance and employee productivity. Device enrollment simplifies the process of adding new devices to the network, while mobile device reporting provides valuable insights into device usage and performance.
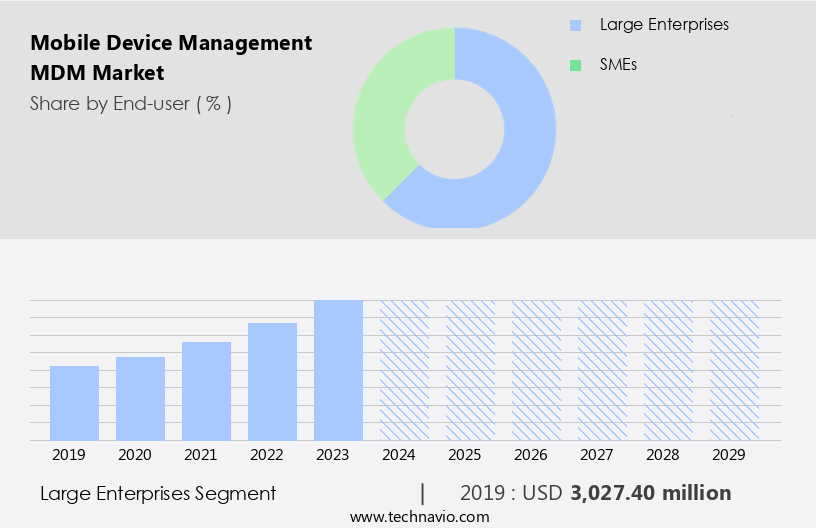
The Large enterprises segment was valued at USD 3.03 billion in 2019 and showed a gradual increase during the forecast period. Hybrid MDM solutions cater to organizations with a mix of corporate-owned and employee-owned devices. Mobile device deployment and mobile device encryption are crucial components of MDM solutions, ensuring secure and efficient deployment and protection of data. Mobile device analytics offer valuable insights into device usage patterns and trends, enabling IT departments to make informed decisions. Mobile device management solutions are essential for large enterprises to effectively manage and secure their mobile workforce, enhance productivity, and mitigate risks. MDM solutions offer a range of features, including device inventory management, mobile app management, mobile device configuration, remote device management, mobile threat detection, and data loss prevention, among others. By implementing MDM solutions, enterprises can ensure that their mobile devices are secure, compliant, and optimally performing. Enterprise mobility management (EMM) refers to the set of policies, technologies, and practices that enable IT administrators to manage mobile devices, such as smartphones and laptops, in an enterprise environment. EMM solutions include Mobile Device Management (MDM), Mobile Application Management (MAM), Mobile Content Management (MCM), and Mobile Security.
Regional Analysis
APAC is estimated to contribute 47% to the growth of the global market during the forecast period. Technavio's analysts have elaborately explained the regional trends and drivers that shape the market during the forecast period. StartFragment The Mobile Device Management (MDM) market is rapidly expanding as businesses prioritize security and efficiency in managing their mobile ecosystems. With the rise of enterprise mobility, solutions integrating multifactor authentication enhance security by ensuring user identity verification. Seamless mobile device synchronization enables real-time data access across platforms. Developers leverage mobile device SDK and mobile device APIs to create robust applications that meet business needs. Organizations rely on a device management console for centralized control, utilizing a mobile device dashboard for real-time insights. Proactive mobile device monitoring is crucial for detecting anomalies and ensuring compliance.
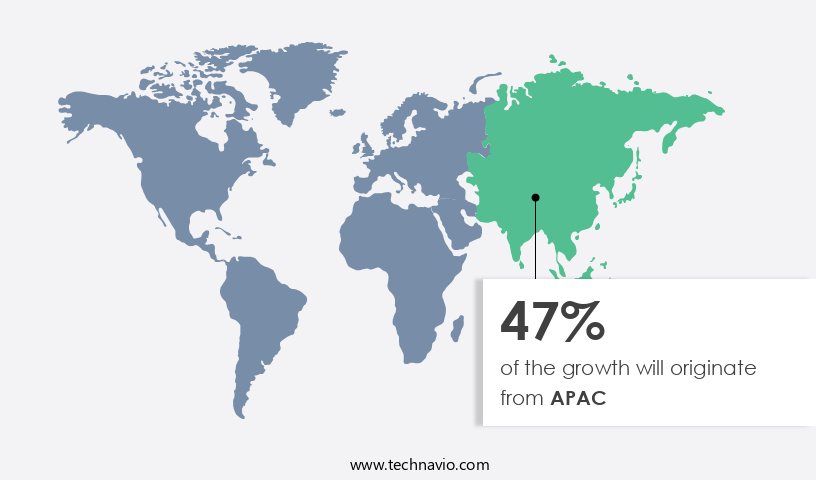
The market in the Asia Pacific (APAC) region is experiencing significant growth due to the increasing adoption of enterprise mobility and digital transformation solutions. The Bring Your Own Device (BYOD) policy and enterprise mobility are becoming increasingly popular in APAC as smartphone and Internet penetration rise. Advanced technologies, such as artificial intelligence (AI), big data, cloud, and the Internet of Things (IoT), are being adopted widely in sectors like banking, financial services and insurance (BFSI), healthcare, retail, and telecommunications, driving the demand for mobile device management solutions and services. Mobile devices are becoming essential tools for employees, leading to an increase in mobile device usage and the need for robust security measures.
Data security is a major concern for businesses, with mobile device malware, phishing, and vulnerabilities posing significant threats. Windows mobile devices are also targeted by attackers, making mobile device patching and upgrades crucial. Mobile device management solutions offer features like application control, device compliance, device provisioning, mobile device reporting, and remote access, ensuring endpoint security and employee productivity. On-premises and cloud-based MDM solutions cater to different business needs, with cloud-based solutions offering flexibility and scalability. Hybrid MDM solutions provide a balance between on-premises and cloud-based offerings. Mobile device inventory management, mobile app management, and mobile content management are essential components of MDM solutions.
Mobile threat detection and mobile device wipe capabilities are crucial for mitigating mobile device threats and ensuring data loss prevention. Mobile email security, mobile device encryption, and mobile device analytics are other essential features of MDM solutions. Mobile device upgrades, device enrollment, and remote device management facilitate seamless deployment and management of mobile devices. Mobile device configuration and mobile device configuration policies ensure device compliance and consistent settings across devices. Mobile device ransomware and other mobile device attacks are becoming more common, making mobile device security a top priority for businesses. The mobile device management market in APAC is expected to continue growing due to the increasing adoption of enterprise mobility, digital transformation, and advanced technologies. MDM solutions offer essential features like data security, application control, device compliance, and remote access, making them indispensable for businesses with mobile workforces.
Market Dynamics
Our researchers analyzed the data with 2024 as the base year, along with the key drivers, trends, and challenges. A holistic analysis of drivers will help companies refine their marketing strategies to gain a competitive advantage.
What are the Mobile Device Management (MDM) market drivers leading to the rise in the adoption of Industry?
- The growing prevalence of mobile devices in enterprises serves as the primary catalyst for market expansion. Enterprises are embracing mobile devices as part of their business strategies, enabling employees to work remotely and increase productivity through enterprise mobility and Bring Your Own Device (BYOD) policies. Mobile devices, including smartphones and tablets, are becoming essential tools for employees to access organizational data and applications. Accordingly, Mobile Device Management (MDM) solutions have gained significant traction in the corporate world to ensure mobile device usage aligns with enterprise security policies. MDM solutions offer various functionalities, such as application control, on-premises MDM, mobile device wipe, mobile device patching, mobile email security, hybrid MDM, mobile app management, and mobile device inventory.
- These features help organizations manage and secure mobile devices, ensuring data privacy and security. The adoption of MDM solutions is driven by the need to support diverse mobile devices and the increasing use of mobile devices for business purposes. As the mobile workforce grows, organizations require efficient ways to manage and secure mobile devices, making MDM solutions an indispensable tool for businesses. The market dynamics of MDM are influenced by the growing mobile device usage in enterprises and the need to manage and secure these devices effectively.
What are the Mobile Device Management (MDM) market trends shaping the Industry?
- The increasing demand for cloud-based solutions represents a significant market trend in the present business landscape. Cloud technologies offer numerous benefits, including cost savings, scalability, and flexibility, making them an attractive option for businesses seeking to streamline their operations and enhance productivity. The market is witnessing substantial growth due to the increasing usage of mobile devices in businesses and the necessity for securing these devices. With the rise of Bring Your Own Device (BYOD) policies, employees are utilizing their personal smartphones and tablets for work, leading organizations to seek efficient methods for managing and securing these devices. Cloud-based MDM solutions have gained popularity due to their flexibility, scalability, and ability to provide remote device management, mobile device configuration, mobile threat detection, device compliance, device provisioning, and mobile device upgrades.
- These solutions enable businesses to ensure employee productivity while maintaining mobile security and device compliance. Additionally, remote access features allow organizations to manage devices from a centralized location, making it easier to implement policies and address issues promptly. Overall, the market is driven by the need to secure and manage the growing number of mobile devices in the corporate environment.
How does Mobile Device Management (MDM) market faces challenges face during its growth?
- The expansion of the industry is significantly influenced by the availability of open-source mobile device management solutions, posing a notable challenge for market growth. The market faces a challenge from the availability of open-source solutions, which may hinder its growth. Open-source MDM software, developed and offered for free by organizations or developer communities, is increasingly being adopted by businesses with limited IT budgets. Notable open-source MDM solutions include Flyve, One, ManageEngine, and Miradore. The cost-effectiveness of open-source software is a significant draw for organizations. Moreover, the flexibility of open-source MDM software enables customization and extension to cater to specific business requirements. However, organizations must consider potential drawbacks, such as lack of company support and the need for in-house expertise to manage and maintain the software.
- Despite these challenges, the MDM market continues to grow due to the increasing importance of endpoint security, mobile device reporting, mobile device ransomware, device enrollment, mobile device threats, mobile content management, and mobile device deployment. Mobile device encryption and mobile device analytics are also critical components driving market growth. Organizations must weigh the benefits and challenges of open-source MDM solutions against proprietary alternatives to make informed decisions.
Exclusive Customer Landscape
The mobile device management (MDM) market forecasting report includes the adoption lifecycle of the market, covering from the innovator's stage to the laggard's stage. It focuses on adoption rates in different regions based on penetration. Furthermore, the mobile device management (MDM) market report also includes key purchase criteria and drivers of price sensitivity to help companies evaluate and develop their market growth analysis strategies.
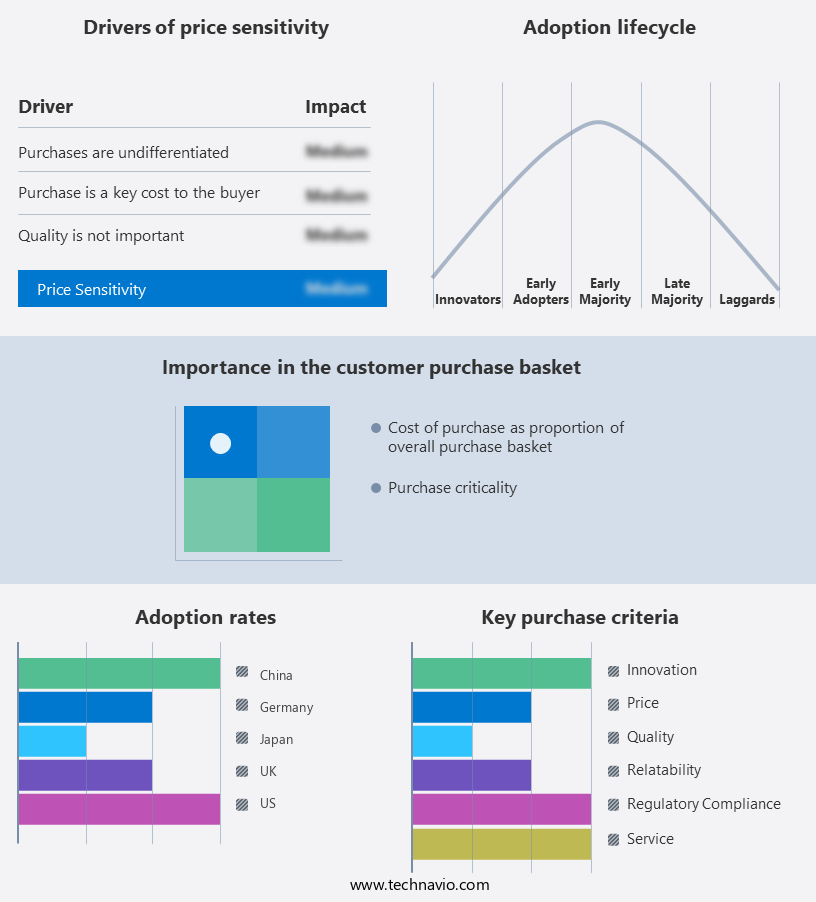
Customer Landscape
Key Companies & Market Insights
Companies are implementing various strategies, such as strategic alliances, mobile device management (MDM) market forecast, partnerships, mergers and acquisitions, geographical expansion, and product/service launches, to enhance their presence in the industry.
Broadcom Inc. - This company specializes in mobile device management, delivering solutions such as Symantec MDM.
The industry research and growth report includes detailed analyses of the competitive landscape of the market and information about key companies, including:
- Broadcom Inc.
- Cisco Systems Inc.
- Citrix Systems Inc.
- Dell Technologies Inc.
- DXC Technology Co.
- Google LLC
- HCL Technologies Ltd.
- International Business Machines Corp.
- Ivanti Software Inc.
- JAMF Holding Corp.
- Matrix42 GmbH
- Microsoft Corp.
- Nippon Telegraph and Telephone Corp.
- Oracle Corp.
- ProMobi Technologies Pvt. Ltd.
- Sophos Ltd.
- SOTI Inc.
- Verizon Communications Inc.
- Zoho Corp. Pvt. Ltd.
Qualitative and quantitative analysis of companies has been conducted to help clients understand the wider business environment as well as the strengths and weaknesses of key industry players. Data is qualitatively analyzed to categorize companies as pure play, category-focused, industry-focused, and diversified; it is quantitatively analyzed to categorize companies as dominant, leading, strong, tentative, and weak.
Recent Development and News in Mobile Device Management (MDM) Market
- In February 2024, IBM announced the acquisition of Waze Mobile, a leading Mobile Device Management (MDM) provider, to strengthen its hybrid cloud offerings and enhance its MDM capabilities for enterprise clients (IBM Press Release). This strategic move aimed to cater to the growing demand for remote work solutions and secure mobile device management.
- In March 2025, Microsoft unveiled its new Intune MDM solution, which integrated advanced security features, including zero-trust access and conditional access policies, to address the increasing security concerns in the remote work environment (Microsoft Blog). This technological advancement positioned Microsoft as a major player in the MDM market, offering a comprehensive solution for businesses.
- In July 2024, VMware and Google Cloud formed a partnership to offer a unified cloud management platform, integrating VMware's Workspace ONE and Google's Chrome Enterprise (VMware Press Release). This collaboration aimed to provide a seamless end-user experience and better manage and secure devices across various platforms, further expanding the reach of MDM solutions.
Research Analyst Overview
The market continues to evolve, driven by the increasing adoption of mobile devices in various sectors. Cloud-based MDM solutions have gained significant traction due to their flexibility and scalability, enabling organizations to securely manage and monitor their mobile devices from a centralized platform. Data security remains a top priority, with mobile device malware, phishing, and vulnerabilities posing significant threats. MDM solutions provide essential features such as device enrollment, patching, and encryption to mitigate these risks. The mobile workforce's reliance on mobile devices for productivity necessitates robust MDM solutions. Application control, device compliance, and remote access are crucial components of MDM, ensuring employee productivity while maintaining security.
On-premises MDM and hybrid MDM solutions cater to organizations with specific security requirements. Remote device management and configuration enable IT teams to manage devices outside the office, while mobile threat detection and analytics provide valuable insights into device usage and potential risks. Device provisioning, mobile device upgrades, and mobile email security are essential features for businesses looking to optimize their mobile device deployments. Mobile device inventory management offers visibility into the entire fleet of devices, facilitating efficient device management. The MDM market's continuous dynamism reflects the evolving nature of mobile device hardware, software, and usage patterns. Device wipe and mobile device patching are critical functions for maintaining device security and ensuring compliance with regulatory requirements. In the ever-changing mobile device landscape, MDM solutions play a vital role in safeguarding data, enhancing productivity, and maintaining device compliance. The ongoing unfolding of market activities underscores the importance of staying informed and adapting to emerging trends and threats.
Dive into Technavio's strong research methodology, blending expert interviews, extensive data synthesis, and validated models for unparalleled Mobile Device Management (MDM) Market insights. See full methodology.
|
Market Scope |
|
|
Report Coverage |
Details |
|
Page number |
216 |
|
Base year |
2024 |
|
Historic period |
2019-2023 |
|
Forecast period |
2025-2029 |
|
Growth momentum & CAGR |
Accelerate at a CAGR of 26.6% |
|
Market growth 2025-2029 |
USD 23.29 billion |
|
Market structure |
Fragmented |
|
YoY growth 2024-2025(%) |
23.0 |
|
Key countries |
China, US, Japan, Germany, UK, Canada, India, South Korea, Australia, and France |
|
Competitive landscape |
Leading Companies, Market Positioning of Companies, Competitive Strategies, and Industry Risks |
What are the Key Data Covered in this Mobile Device Management (MDM) Market Research and Growth Report?
- CAGR of the Mobile Device Management (MDM) industry during the forecast period
- Detailed information on factors that will drive the growth and forecasting between 2025 and 2029
- Precise estimation of the size of the market and its contribution of the industry in focus to the parent market
- Accurate predictions about upcoming growth and trends and changes in consumer behaviour
- Growth of the market across APAC, Europe, North America, South America, and Middle East and Africa
- Thorough analysis of the market's competitive landscape and detailed information about companies
- Comprehensive analysis of factors that will challenge the mobile device management (MDM) market growth of industry companies
We can help! Our analysts can customize this mobile device management (MDM) market research report to meet your requirements.
 RIA -
RIA - 
