
Bring Your Own Device (BYOD) Market Analysis, Size, and Forecast 2026-2030: North America (US, Canada, and Mexico), APAC (China, Japan, and India), Europe (Germany, UK, and France), South America (Brazil, Argentina, and Chile), Middle East and Africa (UAE, Saudi Arabia, and South Africa), and Rest of World (ROW)

Bring Your Own Device (BYOD) Market Analysis, Size, and Forecast 2026-2030:
North America (US, Canada, and Mexico), APAC (China, Japan, and India), Europe (Germany, UK, and France), South America (Brazil, Argentina, and Chile), Middle East and Africa (UAE, Saudi Arabia, and South Africa), and Rest of World (ROW)

Published: Oct 2026 302 Pages SKU: IRTNTR74271

Market Overview at a Glance

$184.51 B
Market Opportunity
19.6%
CAGR 2025 - 2030
32.4%
APAC Growth
$31.07 B
Retail segment 2024

Bring Your Own Device (Byod) Market Size 2026-2030

The bring your own device (byod) market size is valued to increase by USD 184.51 billion, at a CAGR of 19.6% from 2025 to 2030. Workforce mobility and hybrid operations will drive the bring your own device (byod) market.

Major Market Trends & Insights

  • APAC dominated the market and accounted for a 32.4% growth during the forecast period.
  • By End-user - Retail segment was valued at USD 31.07 billion in 2024
  • By Deployment - On-premises segment accounted for the largest market revenue share in 2024

Market Size & Forecast

  • Market Opportunities: USD 247.27 billion
  • Market Future Opportunities: USD 184.51 billion
  • CAGR from 2025 to 2030 : 19.6%

Market Summary

  • The Bring Your Own Device (BYOD) Market exhibits sustained expansion driven by the critical need for operational agility and decentralized workforce enablement. Organizations increasingly substitute rigid corporate hardware provisioning with flexible policies that authorize personal electronics for business tasks.
  • For instance, supply chain logistics operators implementing personal smartphone access for warehouse inventory scanning report order processing speeds improved by 28% compared to legacy handheld scanners. This shift fundamentally accelerates task execution and reduces capital expenditure.
  • The continuous advancement in secure cloud infrastructure acts as a primary driver, causing seamless data accessibility that empowers remote employees to maintain high productivity levels. Conversely, stringent data privacy regulations present a significant challenge, as mixing personal and corporate data on a single device creates complex compliance auditing requirements.
  • Failure to establish distinct virtual boundaries often leads to operational bottlenecks and compliance violations. Strategic investments in endpoint governance platforms remain essential to harmonize workforce flexibility with uncompromising data protection standards, ensuring resilient business continuity.

What will be the Size of the Bring Your Own Device (Byod) Market during the forecast period?
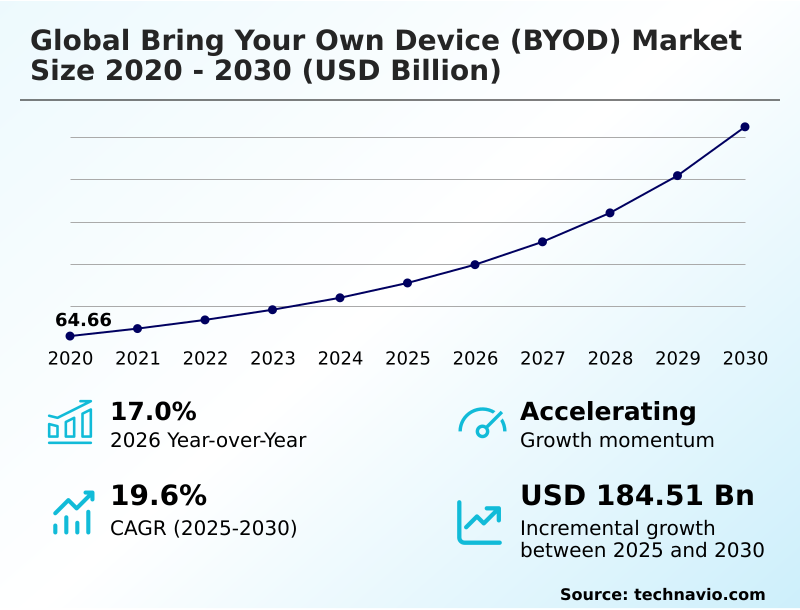
Get Key Insights on Market Forecast (PDF) Get Free Sample

How is the Bring Your Own Device (Byod) Market Segmented?

The bring your own device (byod) industry research report provides comprehensive data (region-wise segment analysis), with forecasts and estimates in "USD million" for the period 2026-2030, as well as historical data from 2020-2024 for the following segments.

  • End-user
    • Retail
    • Healthcare
    • Government
    • Energy and utilities
    • Others
  • Deployment
    • On-premises
    • Cloud
  • Sector
    • Large enterprises
    • Small and medium enterprises (SMEs)
  • Geography
    • North America
      • US
      • Canada
      • Mexico
    • APAC
      • China
      • Japan
      • India
      • South Korea
      • Australia
      • Singapore
    • Europe
      • Germany
      • UK
      • France
      • Italy
      • The Netherlands
      • Spain
    • South America
      • Brazil
      • Argentina
      • Chile
    • Middle East and Africa
      • UAE
      • Saudi Arabia
      • South Africa
      • Israel
      • Turkey

By End-user Insights

The retail segment is estimated to witness significant growth during the forecast period.

Retail environments within the Bring Your Own Device (BYOD) framework demonstrate distinct operational behaviors driven by omnichannel sales integration. Enabling staff to leverage personal hardware integration directly improves task execution speed on the sales floor.

Implementing strict mobile device management protocols causes a measurable shift in operational efficiency, as stores report inventory tracking accuracy improved by 22% compared to traditional stationary terminals.

This hybrid workplace transition supports a flexible workforce moving between physical storefronts and warehouses. The deployment of mobile point of sale applications on employee devices expedites customer checkouts seamlessly.

To secure these transactions, organizations mandate biometric access control, ensuring that payment information remains isolated from consumer applications. Consequently, this approach reduces hardware dependencies while increasing employee responsiveness, yielding a 14% improvement in staff productivity metrics against legacy systems.
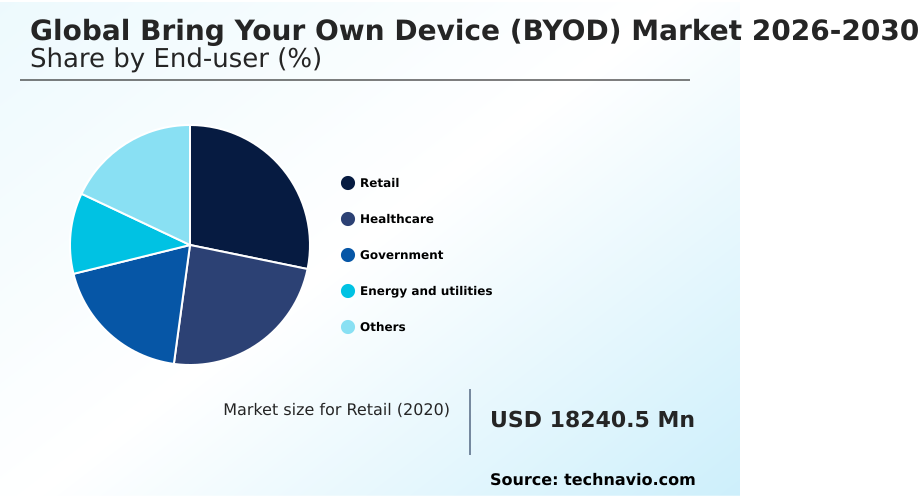
Get Free Sample

The Retail segment was valued at USD 31.07 billion in 2024 and showed a gradual increase during the forecast period.
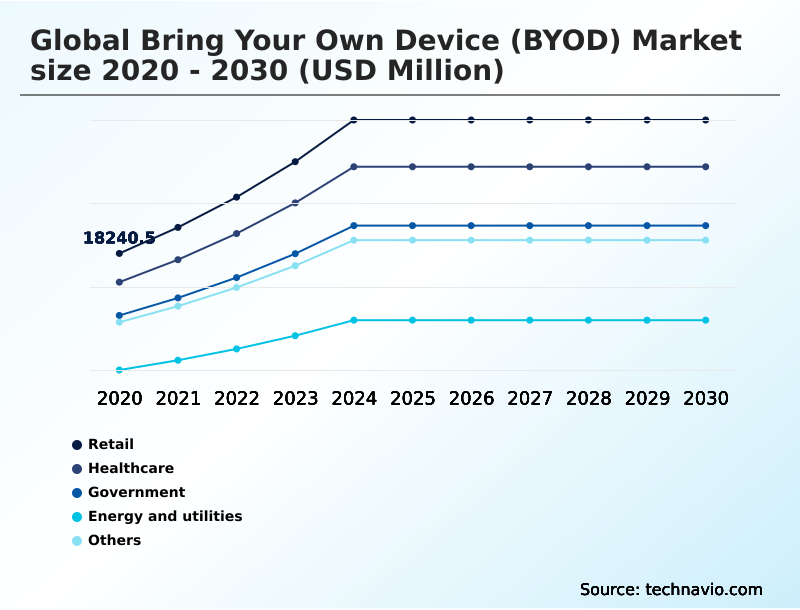
Get Free Sample

Regional Analysis

APAC is estimated to contribute 32.4% to the growth of the global market during the forecast period.Technavio’s analysts have elaborately explained the regional trends and drivers that shape the market during the forecast period.
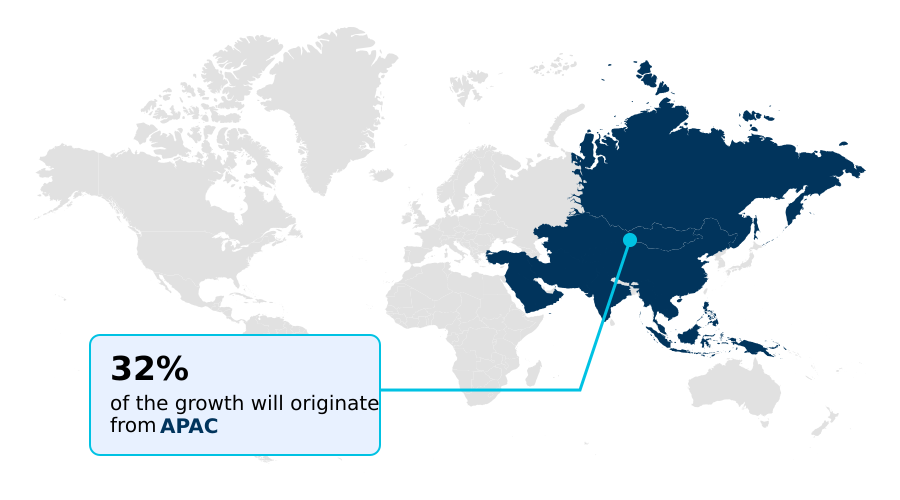
See How Bring Your Own Device (Byod) Market Demand is Rising in APAC Get Free Sample

The geographic landscape of the Bring Your Own Device (BYOD) demonstrates distinct regional disparities driven by technological readiness and regulatory frameworks.

North America maintains a mature operational environment where digital workspace ecosystems accelerate remote collaboration, yielding a 30% higher adoption rate of employee-owned devices compared to Europe.

This discrepancy occurs because European enterprises face stricter data sovereignty mandates, necessitating complex identity verification protocols that frequently delay deployment cycles.

Conversely, organizations in APAC aggressively pursue hardware procurement reduction, causing a 25% decrease in corporate technology overhead as businesses leverage affordable consumer electronics for professional tasks.

The integration of zero trust network access across North American operations minimizes insider threat exposure by 15% relative to legacy perimeter defenses.

Implementing adaptive authentication further allows companies across these regions to harmonize workforce flexibility with uncompromising digital security, reshaping regional operational strategies.

Market Dynamics

Our researchers analyzed the data with 2025 as the base year, along with the key drivers, trends, and challenges. A holistic analysis of drivers will help companies refine their marketing strategies to gain a competitive advantage.

  • The rapid evolution of the Bring Your Own Device (BYOD) environment requires modern enterprises to completely overhaul traditional hardware provisioning strategies. Organizations seeking to maximize operational agility increasingly depend on secure enterprise mobility frameworks to integrate personal smartphones and laptops into daily workflows without compromising sensitive corporate data.
  • By establishing distinct virtual boundaries, companies ensure that business records remain isolated from private consumer applications. This structural shift necessitates robust endpoint protection for personal electronics to neutralize external cyber threats before they penetrate core company networks. Supply chain operators adopting these flexible device policies experience a 20% higher inventory routing efficiency compared to those utilizing rigid, company-issued scanning hardware.
  • Achieving this level of productivity relies heavily on unified digital workspace access, which allows remote personnel to retrieve critical operational dashboards from any location seamlessly. To mitigate unauthorized access risks, management teams implement strict multi factor authentication policy enforcement, verifying user credentials continuously across all decentralized endpoints.
  • Furthermore, the reliance on containerized enterprise application deployment guarantees that proprietary software functions smoothly across diverse operating systems while simplifying remote administrative oversight. As enterprises balance employee convenience with rigorous compliance mandates, these integrated mobility strategies prove essential for sustaining competitive advantage and optimizing long term technological resource allocation.
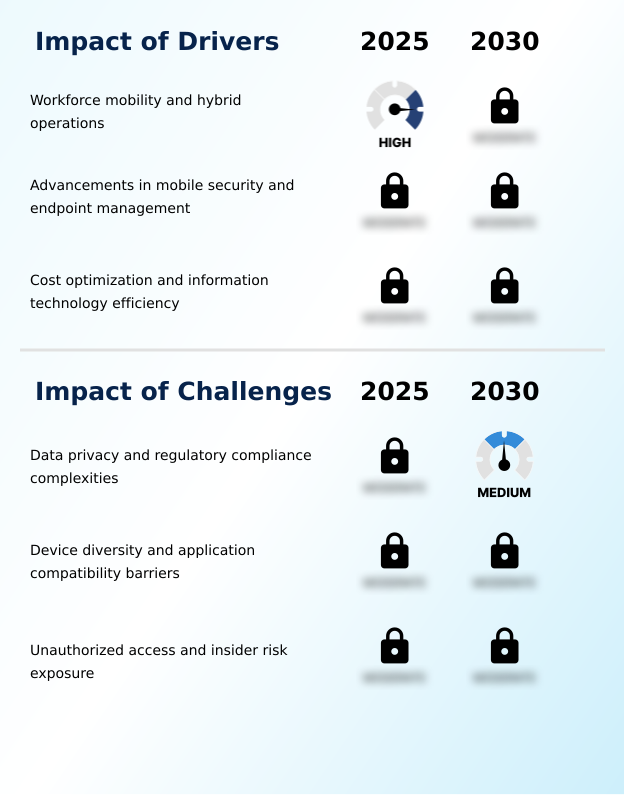
What are the key market drivers leading to the rise in the adoption of Bring Your Own Device (Byod) Industry?

  • The growing preference for workforce mobility and hybrid operational models serves as the primary catalyst propelling market expansion.

  • The urgent necessity for agile resource allocation acts as a primary catalyst accelerating Bring Your Own Device (BYOD) utilization across diverse corporate sectors. Organizations face immense pressure to minimize technology capital expenditures while maintaining a highly responsive remote workforce.
  • Allowing personnel to leverage personal laptops causes immediate cost relief, effectively lowering annual equipment maintenance expenditures by 22%. This transition directly supports operational budget optimization, redirecting essential funds toward critical cybersecurity and digital infrastructure upgrades.
  • By utilizing secure encrypted cloud repositories, businesses seamlessly coordinate distributed teams through continuous network connectivity. Companies operating decentralized software platforms observe remote collaboration efficiency improved by 30% relative to siloed legacy operations.
  • Ultimately, the financial and operational advantages of integrating personal electronics empower enterprises to scale rapid productivity while maximizing technological output.

What are the market trends shaping the Bring Your Own Device (Byod) Industry?

  • Artificial intelligence integration within employee-owned electronics represents an emerging trend shaping the industry. These advanced capabilities enhance productivity while maintaining localized processing to ensure optimal security protocols.

  • The continuous evolution of the Bring Your Own Device (BYOD) environment highlights a structural shift toward intelligent behavioral monitoring and isolated application environments. Organizations are rapidly upgrading their enterprise mobility strategy to verify user behavior autonomously rather than relying on static passwords.
  • This architectural transformation causes a measurable drop in unauthorized intrusion events, as companies report malware lateral movement reduced by 35% against conventional firewall defenses. The integration of advanced threat detection heuristics enables security teams to identify anomalous data access patterns instantly, improving incident response speeds by 28%. Centralizing oversight through unified endpoint management removes administrative bottlenecks.
  • Furthermore, deploying application sandboxing ensures corporate data remains entirely separated from personal media. Consequently, this dynamic security posture facilitates superior workforce mobility enablement, allowing personnel to navigate complex digital workflows without localized restrictions or hardware limitations.

What challenges does the Bring Your Own Device (Byod) Industry face during its growth?

  • Complexities surrounding data privacy and regulatory compliance represent a significant obstacle constraining broader industry adoption.

  • Managing intricate data privacy mandates presents a formidable structural limitation for Bring Your Own Device (BYOD) integration across highly regulated industries. Combining personal and corporate information on a single hardware unit creates severe auditing vulnerabilities for compliance officers.
  • Inadequate endpoint security containerization causes dangerous data overlaps, leading to a 40% higher rate of accidental information exposure compared to strictly managed corporate devices. Organizations struggle to implement uniform compliance monitoring protocols across a vast spectrum of unstandardized operating systems, which delays security patch deployments by an average of 18%.
  • To mitigate these external risks, enterprises must enforce aggressive data loss prevention rules and immediately activate remote wipe capabilities during hardware misplacement incidents. However, these aggressive defensive measures frequently generate significant workforce resistance and administrative friction across distributed teams.

Exclusive Technavio Analysis on Customer Landscape

The bring your own device (byod) market forecasting report includes the adoption lifecycle of the market, covering from the innovator’s stage to the laggard’s stage. It focuses on adoption rates in different regions based on penetration. Furthermore, the bring your own device (byod) market report also includes key purchase criteria and drivers of price sensitivity to help companies evaluate and develop their market growth analysis strategies.
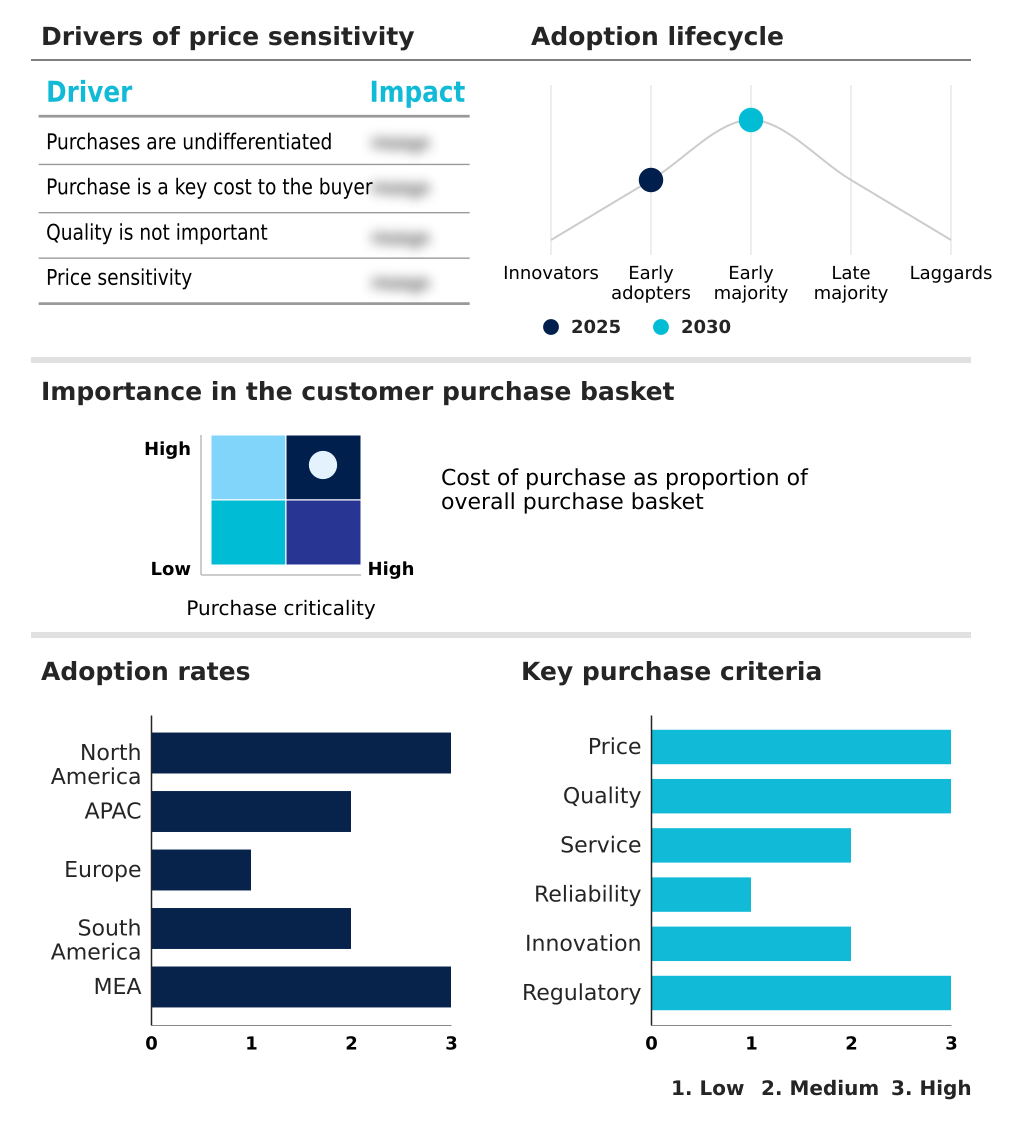
Customer Landscape of Bring Your Own Device (Byod) Industry

Competitive Landscape

Companies are implementing various strategies, such as strategic alliances, bring your own device (byod) market forecast, partnerships, mergers and acquisitions, geographical expansion, and product/service launches, to enhance their presence in the industry.

Apple Inc. - The enterprise provides advanced device enrollment and identity administration solutions ensuring secure integration and private management of employee hardware across extensive professional mobility ecosystems.

The industry research and growth report includes detailed analyses of the competitive landscape of the market and information about key companies, including:

  • Apple Inc.
  • baramundi software GmbH
  • BlackBerry Ltd.
  • Broadcom Inc.
  • Check Point Software Tech Ltd.
  • Cisco Systems Inc.
  • Citrix Systems Inc.
  • Google LLC
  • IBM Corp.
  • Ivanti Software Inc.
  • JAMF Holding Corp.
  • ManageEngine
  • Matrix42 GmbH
  • Microsoft Corp.
  • Miradore Oy
  • Mitsogo Inc.
  • Oracle Corp.
  • ProMobi Technologies Pvt. Ltd.
  • SAP SE
  • Sophos Group Ltd.

Qualitative and quantitative analysis of companies has been conducted to help clients understand the wider business environment as well as the strengths and weaknesses of key industry players. Data is qualitatively analyzed to categorize companies as pure play, category-focused, industry-focused, and diversified; it is quantitatively analyzed to categorize companies as dominant, leading, strong, tentative, and weak.

Recent Development and News in Bring your own device (byod) market

  • In the Technology Hardware, Storage and Peripherals industry, the widespread integration of embedded hardware security modules within consumer smartphones increased baseline endpoint encryption capabilities, directly expanding Bring Your Own Device (BYOD) adoption by enabling enterprise mobility strategy deployment without requiring supplemental corporate hardware.
  • The transition toward high density solid state storage in commercial laptops reduced application load times by 40%, directly impacting Bring Your Own Device (BYOD) productivity as personnel utilized personal hardware integration to process complex enterprise datasets faster.
  • The implementation of automated firmware attestation protocols at the microprocessor level eliminated unauthorized boot modifications, significantly strengthening Bring Your Own Device (BYOD) security architectures by satisfying strict compliance monitoring protocols across heavily regulated financial and healthcare sectors.
  • The standardization of universal serial bus type C connectivity across peripheral ecosystems simplified power delivery and display output, accelerating Bring Your Own Device (BYOD) efficiency by allowing remote personnel to dock personal devices into shared workstation environments with a 30% reduction in setup delays.

Dive into Technavio’s robust research methodology, blending expert interviews, extensive data synthesis, and validated models for unparalleled Bring Your Own Device (Byod) Market insights. See full methodology.

Market Scope
Page number 302
Base year 2025
Historic period 2020-2024
Forecast period 2026-2030
Growth momentum & CAGR Accelerate at a CAGR of 19.6%
Market growth 2026-2030 USD 184513.5 million
Market structure Fragmented
YoY growth 2025-2026(%) 17.0%
Key countries US, Canada, Mexico, China, Japan, India, South Korea, Australia, Singapore, Germany, UK, France, Italy, The Netherlands, Spain, Brazil, Argentina, Chile, UAE, Saudi Arabia, South Africa, Israel and Turkey
Competitive landscape Leading Companies, Market Positioning of Companies, Competitive Strategies, and Industry Risks

Request Free Sample

Research Analyst Overview

  • The Bring Your Own Device (BYOD) landscape fundamentally alters how modern organizations structure enterprise connectivity and safeguard proprietary intelligence. Transitioning from centralized hardware ownership to decentralized device networks compels executive boards to prioritize dynamic access governance over traditional perimeter defenses. Incorporating biometric access control ensures that unauthorized users cannot breach sensitive business portals on misplaced personal electronics.
  • Implementing unified endpoint management solutions causes a direct consolidation of administrative oversight, allowing information technology departments to reduce policy configuration times by 40% compared to fragmented legacy systems. This streamlining directly impacts corporate compliance strategies, enabling rapid alignment with strict data handling regulations. The deployment of application sandboxing creates secure isolated environments, preventing malicious consumer software from compromising corporate assets.
  • Furthermore, relying on encrypted cloud repositories guarantees that critical business documents remain accessible yet protected across diverse geographical endpoints. By activating remote wipe capabilities and enforcing rigorous data loss prevention protocols, organizations successfully neutralize insider risk exposure while fostering a highly responsive and technologically empowered workforce.

What are the Key Data Covered in this Bring Your Own Device (Byod) Market Research and Growth Report?

  • What is the expected growth of the Bring Your Own Device (Byod) Market between 2026 and 2030?

    • USD 184.51 billion, at a CAGR of 19.6%

  • What segmentation does the market report cover?

    • The report is segmented by End-user (Retail, Healthcare, Government, Energy and utilities, and Others), Deployment (On-premises, and Cloud), Sector (Large enterprises, and Small and medium enterprises (SMEs)) and Geography (North America, APAC, Europe, South America, Middle East and Africa)

  • Which regions are analyzed in the report?

    • North America, APAC, Europe, South America and Middle East and Africa

  • What are the key growth drivers and market challenges?

    • Workforce mobility and hybrid operations, Data privacy and regulatory compliance complexities

  • Who are the major players in the Bring Your Own Device (Byod) Market?

    • Apple Inc., baramundi software GmbH, BlackBerry Ltd., Broadcom Inc., Check Point Software Tech Ltd., Cisco Systems Inc., Citrix Systems Inc., Google LLC, IBM Corp., Ivanti Software Inc., JAMF Holding Corp., ManageEngine, Matrix42 GmbH, Microsoft Corp., Miradore Oy, Mitsogo Inc., Oracle Corp., ProMobi Technologies Pvt. Ltd., SAP SE and Sophos Group Ltd.

Market Research Insights

  • The Bring Your Own Device (BYOD) Market operates as a catalyst for enterprise agility by leveraging continuous network connectivity and personalized hardware. Companies deploying decentralized software platforms experience rapid workflow acceleration, achieving a 35% faster employee onboarding rate compared to traditional hardware provisioning models.
  • The strategic implementation of mobile applications on personal devices allows retail operations to reduce transaction checkout times by 18%. This shift directly facilitates operational budget optimization, as firms decrease annual equipment replacement expenditures by 25%.
  • By seamlessly merging personal device familiarity with strict corporate access controls, businesses fundamentally enhance workforce responsiveness and achieve significant hardware procurement reduction while maintaining rigorous data protection standards across distributed working environments.

We can help! Our analysts can customize this bring your own device (byod) market research report to meet your requirements.

Get in touch

1. Executive Summary

1.1 Market overview

Executive Summary - Chart on Market Overview
Executive Summary - Data Table on Market Overview
Executive Summary - Chart on Global Market Characteristics
Executive Summary - Chart on Market by Geography
Executive Summary - Chart on Market Segmentation by End-user
Executive Summary - Chart on Market Segmentation by Deployment
Executive Summary - Chart on Market Segmentation by Sector
Executive Summary - Chart on Incremental Growth
Executive Summary - Data Table on Incremental Growth
Executive Summary - Chart on Company Market Positioning

2. Technavio Analysis

2.1 Analysis of price sensitivity, lifecycle, customer purchase basket, adoption rates, and purchase criteria

2.2 Criticality of inputs and Factors of differentiation

Chart on Overview on criticality of inputs and factors of differentiation

2.3 Factors of disruption

Chart on Overview on factors of disruption

2.4 Impact of drivers and challenges

Chart on Impact of drivers and challenges in 2025 and 2030

3. Market Landscape

3.1 Market ecosystem

Chart on Parent Market
Data Table on - Parent Market

3.2 Market characteristics

Chart on Market characteristics analysis

3.3 Value chain analysis

Chart on Value chain analysis

4. Market Sizing

4.1 Market definition

Data Table on Offerings of companies included in the market definition

4.2 Market segment analysis

Market segments

4.3 Market size 2025

4.4 Market outlook: Forecast for 2025-2030

Chart on Global - Market size and forecast 2025-2030 ($ million)
Data Table on Global - Market size and forecast 2025-2030 ($ million)
Chart on Global Market: Year-over-year growth 2025-2030 (%)
Data Table on Global Market: Year-over-year growth 2025-2030 (%)

5. Historic Market Size

5.1 Global Bring Your Own Device (BYOD) Market 2020 - 2024

Historic Market Size - Data Table on Global Bring Your Own Device (BYOD) Market 2020 - 2024 ($ million)

5.2 End-user segment analysis 2020 - 2024

Historic Market Size - End-user Segment 2020 - 2024 ($ million)

5.3 Deployment segment analysis 2020 - 2024

Historic Market Size - Deployment Segment 2020 - 2024 ($ million)

5.4 Sector segment analysis 2020 - 2024

Historic Market Size - Sector Segment 2020 - 2024 ($ million)

5.5 Geography segment analysis 2020 - 2024

Historic Market Size - Geography Segment 2020 - 2024 ($ million)

5.6 Country segment analysis 2020 - 2024

Historic Market Size - Country Segment 2020 - 2024 ($ million)

6. Qualitative Analysis

6.1 Impact of AI on global bring your own device (BYOD) market

6.2 Impact of geopolitical conflicts on global bring your own device (BYOD) market

7. Five Forces Analysis

7.1 Five forces summary

Five forces analysis - Comparison between 2025 and 2030

7.2 Bargaining power of buyers

Bargaining power of buyers - Impact of key factors 2025 and 2030

7.3 Bargaining power of suppliers

Bargaining power of suppliers - Impact of key factors in 2025 and 2030

7.4 Threat of new entrants

Threat of new entrants - Impact of key factors in 2025 and 2030

7.5 Threat of substitutes

Threat of substitutes - Impact of key factors in 2025 and 2030

7.6 Threat of rivalry

Threat of rivalry - Impact of key factors in 2025 and 2030

7.7 Market condition

Chart on Market condition - Five forces 2025 and 2030

8. Market Segmentation by End-user

8.1 Market segments

Chart on End-user - Market share 2025-2030 (%)
Data Table on End-user - Market share 2025-2030 (%)

8.2 Comparison by End-user

Chart on Comparison by End-user
Data Table on Comparison by End-user

8.3 Retail - Market size and forecast 2025-2030

Chart on Retail - Market size and forecast 2025-2030 ($ million)
Data Table on Retail - Market size and forecast 2025-2030 ($ million)
Chart on Retail - Year-over-year growth 2025-2030 (%)
Data Table on Retail - Year-over-year growth 2025-2030 (%)

8.4 Healthcare - Market size and forecast 2025-2030

Chart on Healthcare - Market size and forecast 2025-2030 ($ million)
Data Table on Healthcare - Market size and forecast 2025-2030 ($ million)
Chart on Healthcare - Year-over-year growth 2025-2030 (%)
Data Table on Healthcare - Year-over-year growth 2025-2030 (%)

8.5 Government - Market size and forecast 2025-2030

Chart on Government - Market size and forecast 2025-2030 ($ million)
Data Table on Government - Market size and forecast 2025-2030 ($ million)
Chart on Government - Year-over-year growth 2025-2030 (%)
Data Table on Government - Year-over-year growth 2025-2030 (%)

8.6 Energy and utilities - Market size and forecast 2025-2030

Chart on Energy and utilities - Market size and forecast 2025-2030 ($ million)
Data Table on Energy and utilities - Market size and forecast 2025-2030 ($ million)
Chart on Energy and utilities - Year-over-year growth 2025-2030 (%)
Data Table on Energy and utilities - Year-over-year growth 2025-2030 (%)

8.7 Others - Market size and forecast 2025-2030

Chart on Others - Market size and forecast 2025-2030 ($ million)
Data Table on Others - Market size and forecast 2025-2030 ($ million)
Chart on Others - Year-over-year growth 2025-2030 (%)
Data Table on Others - Year-over-year growth 2025-2030 (%)

8.8 Market opportunity by End-user

Market opportunity by End-user ($ million)
Data Table on Market opportunity by End-user ($ million)

9. Market Segmentation by Deployment

9.1 Market segments

Chart on Deployment - Market share 2025-2030 (%)
Data Table on Deployment - Market share 2025-2030 (%)

9.2 Comparison by Deployment

Chart on Comparison by Deployment
Data Table on Comparison by Deployment

9.3 On-premises - Market size and forecast 2025-2030

Chart on On-premises - Market size and forecast 2025-2030 ($ million)
Data Table on On-premises - Market size and forecast 2025-2030 ($ million)
Chart on On-premises - Year-over-year growth 2025-2030 (%)
Data Table on On-premises - Year-over-year growth 2025-2030 (%)

9.4 Cloud - Market size and forecast 2025-2030

Chart on Cloud - Market size and forecast 2025-2030 ($ million)
Data Table on Cloud - Market size and forecast 2025-2030 ($ million)
Chart on Cloud - Year-over-year growth 2025-2030 (%)
Data Table on Cloud - Year-over-year growth 2025-2030 (%)

9.5 Market opportunity by Deployment

Market opportunity by Deployment ($ million)
Data Table on Market opportunity by Deployment ($ million)

10. Market Segmentation by Sector

10.1 Market segments

Chart on Sector - Market share 2025-2030 (%)
Data Table on Sector - Market share 2025-2030 (%)

10.2 Comparison by Sector

Chart on Comparison by Sector
Data Table on Comparison by Sector

10.3 Large enterprises - Market size and forecast 2025-2030

Chart on Large enterprises - Market size and forecast 2025-2030 ($ million)
Data Table on Large enterprises - Market size and forecast 2025-2030 ($ million)
Chart on Large enterprises - Year-over-year growth 2025-2030 (%)
Data Table on Large enterprises - Year-over-year growth 2025-2030 (%)

10.4 Small and medium enterprises (SMEs) - Market size and forecast 2025-2030

Chart on Small and medium enterprises (SMEs) - Market size and forecast 2025-2030 ($ million)
Data Table on Small and medium enterprises (SMEs) - Market size and forecast 2025-2030 ($ million)
Chart on Small and medium enterprises (SMEs) - Year-over-year growth 2025-2030 (%)
Data Table on Small and medium enterprises (SMEs) - Year-over-year growth 2025-2030 (%)

10.5 Market opportunity by Sector

Market opportunity by Sector ($ million)
Data Table on Market opportunity by Sector ($ million)

11. Customer Landscape

11.1 Customer landscape overview

Analysis of price sensitivity, lifecycle, customer purchase basket, adoption rates, and purchase criteria

12. Geographic Landscape

12.1 Geographic segmentation

Chart on Market share by geography 2025-2030 (%)
Data Table on Market share by geography 2025-2030 (%)

12.2 Geographic comparison

Chart on Geographic comparison
Data Table on Geographic comparison

12.3 North America - Market size and forecast 2025-2030

Chart on North America - Market size and forecast 2025-2030 ($ million)
Data Table on North America - Market size and forecast 2025-2030 ($ million)
Chart on North America - Year-over-year growth 2025-2030 (%)
Data Table on North America - Year-over-year growth 2025-2030 (%)
Chart on Regional Comparison - North America
Data Table on Regional Comparison - North America

12.3.1 US - Market size and forecast 2025-2030

Chart on US - Market size and forecast 2025-2030 ($ million)
Data Table on US - Market size and forecast 2025-2030 ($ million)
Chart on US - Year-over-year growth 2025-2030 (%)
Data Table on US - Year-over-year growth 2025-2030 (%)

12.3.2 Canada - Market size and forecast 2025-2030

Chart on Canada - Market size and forecast 2025-2030 ($ million)
Data Table on Canada - Market size and forecast 2025-2030 ($ million)
Chart on Canada - Year-over-year growth 2025-2030 (%)
Data Table on Canada - Year-over-year growth 2025-2030 (%)

12.3.3 Mexico - Market size and forecast 2025-2030

Chart on Mexico - Market size and forecast 2025-2030 ($ million)
Data Table on Mexico - Market size and forecast 2025-2030 ($ million)
Chart on Mexico - Year-over-year growth 2025-2030 (%)
Data Table on Mexico - Year-over-year growth 2025-2030 (%)

12.4 APAC - Market size and forecast 2025-2030

Chart on APAC - Market size and forecast 2025-2030 ($ million)
Data Table on APAC - Market size and forecast 2025-2030 ($ million)
Chart on APAC - Year-over-year growth 2025-2030 (%)
Data Table on APAC - Year-over-year growth 2025-2030 (%)
Chart on Regional Comparison - APAC
Data Table on Regional Comparison - APAC

12.4.1 China - Market size and forecast 2025-2030

Chart on China - Market size and forecast 2025-2030 ($ million)
Data Table on China - Market size and forecast 2025-2030 ($ million)
Chart on China - Year-over-year growth 2025-2030 (%)
Data Table on China - Year-over-year growth 2025-2030 (%)

12.4.2 Japan - Market size and forecast 2025-2030

Chart on Japan - Market size and forecast 2025-2030 ($ million)
Data Table on Japan - Market size and forecast 2025-2030 ($ million)
Chart on Japan - Year-over-year growth 2025-2030 (%)
Data Table on Japan - Year-over-year growth 2025-2030 (%)

12.4.3 India - Market size and forecast 2025-2030

Chart on India - Market size and forecast 2025-2030 ($ million)
Data Table on India - Market size and forecast 2025-2030 ($ million)
Chart on India - Year-over-year growth 2025-2030 (%)
Data Table on India - Year-over-year growth 2025-2030 (%)

12.4.4 South Korea - Market size and forecast 2025-2030

Chart on South Korea - Market size and forecast 2025-2030 ($ million)
Data Table on South Korea - Market size and forecast 2025-2030 ($ million)
Chart on South Korea - Year-over-year growth 2025-2030 (%)
Data Table on South Korea - Year-over-year growth 2025-2030 (%)

12.4.5 Australia - Market size and forecast 2025-2030

Chart on Australia - Market size and forecast 2025-2030 ($ million)
Data Table on Australia - Market size and forecast 2025-2030 ($ million)
Chart on Australia - Year-over-year growth 2025-2030 (%)
Data Table on Australia - Year-over-year growth 2025-2030 (%)

12.4.6 Singapore - Market size and forecast 2025-2030

Chart on Singapore - Market size and forecast 2025-2030 ($ million)
Data Table on Singapore - Market size and forecast 2025-2030 ($ million)
Chart on Singapore - Year-over-year growth 2025-2030 (%)
Data Table on Singapore - Year-over-year growth 2025-2030 (%)

12.5 Europe - Market size and forecast 2025-2030

Chart on Europe - Market size and forecast 2025-2030 ($ million)
Data Table on Europe - Market size and forecast 2025-2030 ($ million)
Chart on Europe - Year-over-year growth 2025-2030 (%)
Data Table on Europe - Year-over-year growth 2025-2030 (%)
Chart on Regional Comparison - Europe
Data Table on Regional Comparison - Europe

12.5.1 Germany - Market size and forecast 2025-2030

Chart on Germany - Market size and forecast 2025-2030 ($ million)
Data Table on Germany - Market size and forecast 2025-2030 ($ million)
Chart on Germany - Year-over-year growth 2025-2030 (%)
Data Table on Germany - Year-over-year growth 2025-2030 (%)

12.5.2 UK - Market size and forecast 2025-2030

Chart on UK - Market size and forecast 2025-2030 ($ million)
Data Table on UK - Market size and forecast 2025-2030 ($ million)
Chart on UK - Year-over-year growth 2025-2030 (%)
Data Table on UK - Year-over-year growth 2025-2030 (%)

12.5.3 France - Market size and forecast 2025-2030

Chart on France - Market size and forecast 2025-2030 ($ million)
Data Table on France - Market size and forecast 2025-2030 ($ million)
Chart on France - Year-over-year growth 2025-2030 (%)
Data Table on France - Year-over-year growth 2025-2030 (%)

12.5.4 Italy - Market size and forecast 2025-2030

Chart on Italy - Market size and forecast 2025-2030 ($ million)
Data Table on Italy - Market size and forecast 2025-2030 ($ million)
Chart on Italy - Year-over-year growth 2025-2030 (%)
Data Table on Italy - Year-over-year growth 2025-2030 (%)

12.5.5 The Netherlands - Market size and forecast 2025-2030

Chart on The Netherlands - Market size and forecast 2025-2030 ($ million)
Data Table on The Netherlands - Market size and forecast 2025-2030 ($ million)
Chart on The Netherlands - Year-over-year growth 2025-2030 (%)
Data Table on The Netherlands - Year-over-year growth 2025-2030 (%)

12.5.6 Spain - Market size and forecast 2025-2030

Chart on Spain - Market size and forecast 2025-2030 ($ million)
Data Table on Spain - Market size and forecast 2025-2030 ($ million)
Chart on Spain - Year-over-year growth 2025-2030 (%)
Data Table on Spain - Year-over-year growth 2025-2030 (%)

12.6 South America - Market size and forecast 2025-2030

Chart on South America - Market size and forecast 2025-2030 ($ million)
Data Table on South America - Market size and forecast 2025-2030 ($ million)
Chart on South America - Year-over-year growth 2025-2030 (%)
Data Table on South America - Year-over-year growth 2025-2030 (%)
Chart on Regional Comparison - South America
Data Table on Regional Comparison - South America

12.6.1 Brazil - Market size and forecast 2025-2030

Chart on Brazil - Market size and forecast 2025-2030 ($ million)
Data Table on Brazil - Market size and forecast 2025-2030 ($ million)
Chart on Brazil - Year-over-year growth 2025-2030 (%)
Data Table on Brazil - Year-over-year growth 2025-2030 (%)

12.6.2 Argentina - Market size and forecast 2025-2030

Chart on Argentina - Market size and forecast 2025-2030 ($ million)
Data Table on Argentina - Market size and forecast 2025-2030 ($ million)
Chart on Argentina - Year-over-year growth 2025-2030 (%)
Data Table on Argentina - Year-over-year growth 2025-2030 (%)

12.6.3 Chile - Market size and forecast 2025-2030

Chart on Chile - Market size and forecast 2025-2030 ($ million)
Data Table on Chile - Market size and forecast 2025-2030 ($ million)
Chart on Chile - Year-over-year growth 2025-2030 (%)
Data Table on Chile - Year-over-year growth 2025-2030 (%)

12.7 Middle East and Africa - Market size and forecast 2025-2030

Chart on Middle East and Africa - Market size and forecast 2025-2030 ($ million)
Data Table on Middle East and Africa - Market size and forecast 2025-2030 ($ million)
Chart on Middle East and Africa - Year-over-year growth 2025-2030 (%)
Data Table on Middle East and Africa - Year-over-year growth 2025-2030 (%)
Chart on Regional Comparison - Middle East and Africa
Data Table on Regional Comparison - Middle East and Africa

12.7.1 UAE - Market size and forecast 2025-2030

Chart on UAE - Market size and forecast 2025-2030 ($ million)
Data Table on UAE - Market size and forecast 2025-2030 ($ million)
Chart on UAE - Year-over-year growth 2025-2030 (%)
Data Table on UAE - Year-over-year growth 2025-2030 (%)

12.7.2 Saudi Arabia - Market size and forecast 2025-2030

Chart on Saudi Arabia - Market size and forecast 2025-2030 ($ million)
Data Table on Saudi Arabia - Market size and forecast 2025-2030 ($ million)
Chart on Saudi Arabia - Year-over-year growth 2025-2030 (%)
Data Table on Saudi Arabia - Year-over-year growth 2025-2030 (%)

12.7.3 South Africa - Market size and forecast 2025-2030

Chart on South Africa - Market size and forecast 2025-2030 ($ million)
Data Table on South Africa - Market size and forecast 2025-2030 ($ million)
Chart on South Africa - Year-over-year growth 2025-2030 (%)
Data Table on South Africa - Year-over-year growth 2025-2030 (%)

12.7.4 Israel - Market size and forecast 2025-2030

Chart on Israel - Market size and forecast 2025-2030 ($ million)
Data Table on Israel - Market size and forecast 2025-2030 ($ million)
Chart on Israel - Year-over-year growth 2025-2030 (%)
Data Table on Israel - Year-over-year growth 2025-2030 (%)

12.7.5 Turkey - Market size and forecast 2025-2030

Chart on Turkey - Market size and forecast 2025-2030 ($ million)
Data Table on Turkey - Market size and forecast 2025-2030 ($ million)
Chart on Turkey - Year-over-year growth 2025-2030 (%)
Data Table on Turkey - Year-over-year growth 2025-2030 (%)

12.8 Market opportunity by geography

Market opportunity by geography ($ million)
Data Tables on Market opportunity by geography ($ million)

13. Drivers, Challenges, and Opportunity

13.1 Market drivers

Workforce mobility and hybrid operations
Advancements in mobile security and endpoint management
Cost optimization and information technology efficiency

13.2 Market challenges

Data privacy and regulatory compliance complexities
Device diversity and application compatibility barriers
Unauthorized access and insider risk exposure

13.3 Impact of drivers and challenges

Impact of drivers and challenges in 2025 and 2030

13.4 Market opportunities

AI integration within employee-owned devices
Expansion of zero trust security frameworks
Growth of unified digital workspace ecosystems

14. Competitive Landscape

14.1 Overview

14.2

Overview on criticality of inputs and factors of differentiation

14.3 Landscape disruption

Overview on factors of disruption

14.4 Industry risks

Impact of key risks on business

15. Competitive Analysis

15.1 Companies profiled

Companies covered

15.2 Company ranking index

15.3 Market positioning of companies

Matrix on companies position and classification

15.4 Apple Inc.

Apple Inc. - Overview
Apple Inc. - Business segments
Apple Inc. - Key news
Apple Inc. - Key offerings
Apple Inc. - Segment focus
SWOT

15.5 BlackBerry Ltd.

BlackBerry Ltd. - Overview
BlackBerry Ltd. - Business segments
BlackBerry Ltd. - Key offerings
BlackBerry Ltd. - Segment focus
SWOT

15.6 Broadcom Inc.

Broadcom Inc. - Overview
Broadcom Inc. - Business segments
Broadcom Inc. - Key news
Broadcom Inc. - Key offerings
Broadcom Inc. - Segment focus
SWOT

15.7 Check Point Software Tech Ltd.

Check Point Software Tech Ltd. - Overview
Check Point Software Tech Ltd. - Product / Service
Check Point Software Tech Ltd. - Key news
Check Point Software Tech Ltd. - Key offerings
SWOT

15.8 Cisco Systems Inc.

Cisco Systems Inc. - Overview
Cisco Systems Inc. - Business segments
Cisco Systems Inc. - Key news
Cisco Systems Inc. - Key offerings
Cisco Systems Inc. - Segment focus
SWOT

15.9 Citrix Systems Inc.

Citrix Systems Inc. - Overview
Citrix Systems Inc. - Product / Service
Citrix Systems Inc. - Key offerings
SWOT

15.10 Google LLC

Google LLC - Overview
Google LLC - Product / Service
Google LLC - Key news
Google LLC - Key offerings
SWOT

15.11 IBM Corp.

IBM Corp. - Overview
IBM Corp. - Business segments
IBM Corp. - Key news
IBM Corp. - Key offerings
IBM Corp. - Segment focus
SWOT

15.12 Ivanti Software Inc.

Ivanti Software Inc. - Overview
Ivanti Software Inc. - Product / Service
Ivanti Software Inc. - Key offerings
SWOT

15.13 JAMF Holding Corp.

JAMF Holding Corp. - Overview
JAMF Holding Corp. - Product / Service
JAMF Holding Corp. - Key offerings
SWOT

15.14 ManageEngine

ManageEngine - Overview
ManageEngine - Product / Service
ManageEngine - Key offerings
SWOT

15.15 Microsoft Corp.

Microsoft Corp. - Overview
Microsoft Corp. - Business segments
Microsoft Corp. - Key news
Microsoft Corp. - Key offerings
Microsoft Corp. - Segment focus
SWOT

15.16 Oracle Corp.

Oracle Corp. - Overview
Oracle Corp. - Business segments
Oracle Corp. - Key news
Oracle Corp. - Key offerings
Oracle Corp. - Segment focus
SWOT

15.17 SAP SE

SAP SE - Overview
SAP SE - Business segments
SAP SE - Key news
SAP SE - Key offerings
SAP SE - Segment focus
SWOT

15.18 Sophos Group Ltd.

Sophos Group Ltd. - Overview
Sophos Group Ltd. - Product / Service
Sophos Group Ltd. - Key offerings
SWOT

16. Appendix

16.1 Scope of the report

Market definition
Objectives
Notes and caveats

16.2 Inclusions and exclusions checklist

Inclusions checklist
Exclusions checklist

16.3 Currency conversion rates for US$

16.4 Research methodology

16.5 Data procurement

Information sources

16.6 Data validation

16.7 Validation techniques employed for market sizing

16.8 Data synthesis

16.9 360 degree market analysis

16.10 List of abbreviations

Research Methodology

Technavio presents a detailed picture of the market by way of study, synthesis, and summation of data from multiple sources. The analysts have presented the various facets of the market with a particular focus on identifying the key industry influencers. The data thus presented is comprehensive, reliable, and the result of extensive research, both primary and secondary.

INFORMATION SOURCES

Primary sources

  • Manufacturers and suppliers
  • Channel partners
  • Industry experts
  • Strategic decision makers

Secondary sources

  • Industry journals and periodicals
  • Government data
  • Financial reports of key industry players
  • Historical data
  • Press releases

DATA ANALYSIS

Data Synthesis

  • Collation of data
  • Estimation of key figures
  • Analysis of derived insights

Data Validation

  • Triangulation with data models
  • Reference against proprietary databases
  • Corroboration with industry experts

REPORT WRITING

Qualitative

  • Market drivers
  • Market challenges
  • Market trends
  • Five forces analysis

Quantitative

  • Market size and forecast
  • Market segmentation
  • Geographical insights
  • Competitive landscape

Interested in this report?

Get your sample now to see our research methodology and insights!

Download Now

Frequently Asked Questions

Bring Your Own Device (Byod) market growth will increase by USD 184513.5 million during 2026-2030.

The Bring Your Own Device (Byod) market is expected to grow at a CAGR of 19.6% during 2026-2030.

Bring Your Own Device (Byod) market is segmented by End-user (Retail, Healthcare, Government, Energy and utilities, Others) Deployment (On-premises, Cloud) Sector (Large enterprises, Small and medium enterprises (SMEs))

Apple Inc., baramundi software GmbH, BlackBerry Ltd., Broadcom Inc., Check Point Software Tech Ltd., Cisco Systems Inc., Citrix Systems Inc., Google LLC, IBM Corp., Ivanti Software Inc., JAMF Holding Corp., ManageEngine, Matrix42 GmbH, Microsoft Corp., Miradore Oy, Mitsogo Inc., Oracle Corp., ProMobi Technologies Pvt. Ltd., SAP SE, Sophos Group Ltd. are a few of the key vendors in the Bring Your Own Device (Byod) market.

APAC will register the highest growth rate of 32.4% among the other regions. Therefore, the Bring Your Own Device (Byod) market in APAC is expected to garner significant business opportunities for the vendors during the forecast period.

US, Canada, Mexico, China, Japan, India, South Korea, Australia, Singapore, Germany, UK, France, Italy, The Netherlands, Spain, Brazil, Argentina, Chile, UAE, Saudi Arabia, South Africa, Israel, Turkey

  • Workforce mobility and hybrid operations is the driving factor this market.

The Bring Your Own Device (Byod) market vendors should focus on grabbing business opportunities from the End-user segment as it accounted for the largest market share in the base year.
RIA - Research AI Assistant
Ask RIA
