Residential Faucets Market Analysis, Size, and Forecast 2026-2030: North America (US, Canada, and Mexico), APAC (China, India, and Japan), Europe (Germany, UK, and France), Middle East and Africa (Saudi Arabia, UAE, and Turkey), South America (Brazil, Argentina, and Chile), and Rest of World (ROW)

Residential Faucets Market Analysis, Size, and Forecast 2026-2030:
North America (US, Canada, and Mexico), APAC (China, India, and Japan), Europe (Germany, UK, and France), Middle East and Africa (Saudi Arabia, UAE, and Turkey), South America (Brazil, Argentina, and Chile), and Rest of World (ROW)

Published: May 2026 297 Pages SKU: IRTNTR74410

Market Overview at a Glance

$8.35 B
Market Opportunity
8.8%
CAGR 2025 - 2030
30.9%
North America Growth
$10.13 B
Bathroom faucets segment 2024

Residential Faucets Market Size and Growth Forecast 2026-2030

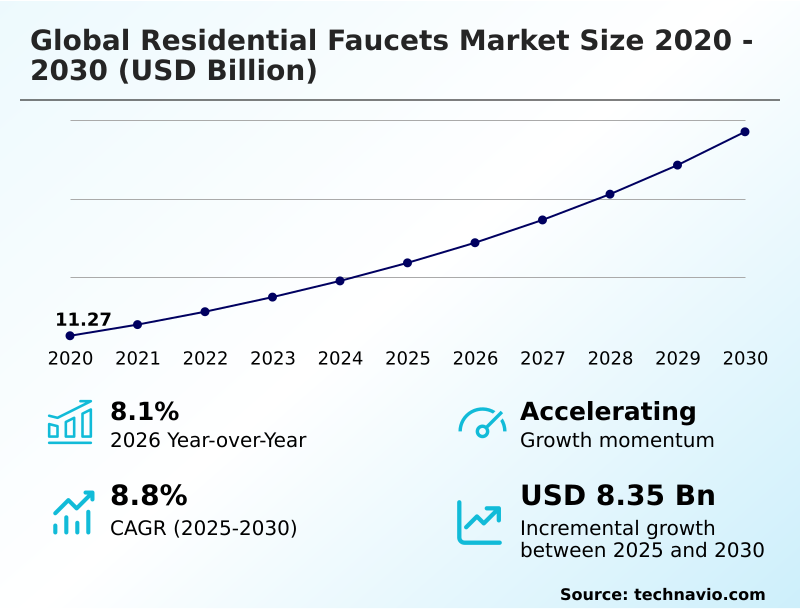
The Residential Faucets Market size was valued at USD 15.91 billion in 2025 growing at a CAGR of 8.8% during the forecast period 2026-2030.

North America accounts for 30.9% of incremental growth during the forecast period. The Bathroom faucets segment by Application was valued at USD 10.13 billion in 2024, while the Offline segment holds the largest revenue share by Distribution Channel.

The market is projected to grow by USD 12.99 billion from 2020 to 2030, with USD 8.35 billion of the growth expected during the forecast period of 2025 to 2030.

Get Key Insights on Market Forecast (PDF) Request Free Sample

Residential Faucets Market Overview

The residential faucets market is experiencing a significant transformation, with year-over-year growth reaching 8.1% as demand shifts toward technologically advanced and sustainable fixtures. This evolution is defined by the convergence of smart home interoperability and stringent water conservation goals, compelling manufacturers to innovate beyond traditional mechanics. For instance, in a new multi-family housing development pursuing green building certifications like LEED, the specification of water-efficient fixtures is non-negotiable. These projects now favor touchless sensory technology and faucets made from lead-free brass to enhance hygiene and ensure regulatory compliance. In practice, equipping a 200-unit building with such systems not only reduces water consumption but also aligns with tenant expectations for modern, connected living spaces. The market is also accommodating a robust do-it-yourself segment, with manufacturers simplifying DIY faucet installation procedures for renovations and bathroom upgrades, thereby broadening the consumer base.

Drivers, Trends, and Challenges in the Residential Faucets Market

Procurement decisions in the residential faucets market are increasingly complex, balancing long-term performance with evolving technological and regulatory demands. The impact of raw material volatility on faucet pricing remains a primary concern for supply chain managers, influencing the cost analysis of brass versus plastic faucets and the economic viability of using premium materials.

The choice between lead-free brass vs stainless steel faucet durability is a critical specification point, particularly with the impact of the EU Drinking Water Directive on materials becoming a global benchmark. For installers, understanding the nuances of DIY installation of single-hole bathroom faucets is as important as troubleshooting magnetic docking systems on sprayers in high-end kitchens.

In the context of smart homes, the challenges of smart home interoperability for faucets and the need for smart faucet integration with Apple HomeKit are defining consumer satisfaction.

A key decision point for specifiers is choosing faucets for high-end urban housing developments, where selecting the best pull-down kitchen faucets for workstation sinks or upgrading to high-arc faucets for better clearance can significantly impact perceived value. The role of faucets in LEED green building certification is critical, driving demand for water-saving benefits of WaterSense certified faucets.

A standard faucet's flow rate of 2.2 gallons per minute is over 45% higher than a WaterSense-labeled model, a metric that directly impacts utility savings and compliance. This also extends to sourcing eco-friendly faucets with recycled materials and ensuring safety through thermostatic mixing valves for anti-scald protection.

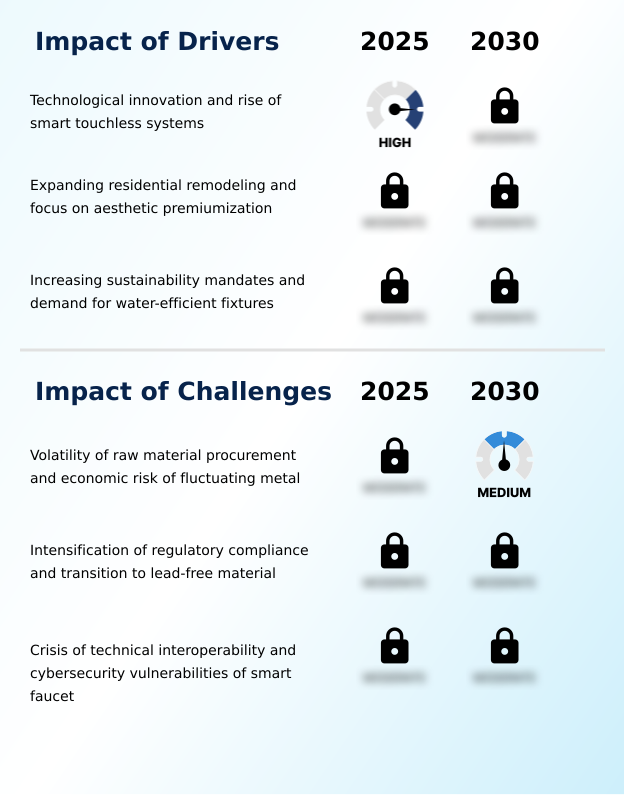
Primary Growth Driver: Technological innovation and the rise of smart, touchless systems are key drivers propelling growth in the residential faucets market.

Market growth is propelled by a dual focus on aesthetic premiumization and sustainability, particularly in high-growth regions like APAC, which is forecast to expand at 9.4%.

Homeowners globally are prioritizing minimalist aesthetics and design-led innovation, demanding fixtures that serve as architectural focal points. This driver is supported by an expanding palette of durable finishes and forms.

Simultaneously, pressing environmental concerns and the desire for utility savings are accelerating the adoption of eco-friendly residential faucets. Mandates for water conservation are pushing manufacturers to engineer high-performance aeration systems that reduce consumption without sacrificing pressure.

This convergence of style and function ensures that fixtures meet both the visual and ethical standards of modern eco-conscious residential living.

Emerging Market Trend: The integration of sensory technology and hybrid command interfaces is a defining market trend. This shift prioritizes residential sensor-based systems for enhanced hygiene and convenience.

A significant market trend is the push toward sophisticated digital integration, which introduces both opportunities and complexities. The adoption of hybrid command interfaces, which combine manual control with voice-activated dispensing, is expanding, yet the industry grapples with technical interoperability.

As digital water networks become more common, nearly 30% of consumer dissatisfaction in the premium segment stems from the failure of smart faucets to connect seamlessly with diverse home automation platforms. This fragmentation creates significant cybersecurity vulnerabilities, turning a simple plumbing fixture into a potential network entry point.

Consequently, manufacturers are under pressure to standardize communication protocols and invest in robust firmware to build consumer trust in connected home ecosystems.

Key Industry Challenge: The volatility of raw material procurement and the economic risk associated with fluctuating metal prices present a key challenge to industry growth.

The most pressing market challenges stem from supply chain volatility and stringent regulatory compliance. The fluctuating cost of raw material procurement, particularly for brass and zinc, directly impacts profitability and pricing stability.

Concurrently, the global transition toward lead-free plumbing mandates, such as the requirement for a maximum lead content of 0.25% in components contacting drinking water, forces costly redesigns and retooling. This necessitates rigorous validation of alternative materials like 304 stainless steel or specialized polymers.

For popular finishes like PVD-coated matte black, ensuring consistency and durability while managing rising input costs is a significant operational hurdle. These pressures are further compounded by the technical demands of integrating electronics for hands-free operation, creating a complex manufacturing landscape.

Explore Full Market Dynamics Analysis Request Free Sample

Residential Faucets Market Segmentation

The residential faucets industry research report provides comprehensive data including region-wise segment analysis, with forecasts and analysis for the period 2026-2030, as well as historical data from 2020-2024 for the following segments.

Market Segment by Application
  • Bathroom faucets
  • Kitchen faucets
Market Segment by Distribution channel
  • Offline
  • Online
Market Segment by Material
  • Brass
  • Stainless steel
  • Chrome
  • Bronze
  • Plastic
Market Segment by Geography
North America
US, Canada, Mexico
APAC
China, India, Japan, South Korea, Australia, Indonesia
Europe
Germany, UK, France, Italy, Spain, The Netherlands
Middle East and Africa
Saudi Arabia, UAE, Turkey, South Africa, Israel
South America
Brazil, Argentina, Chile

Application Segment Analysis

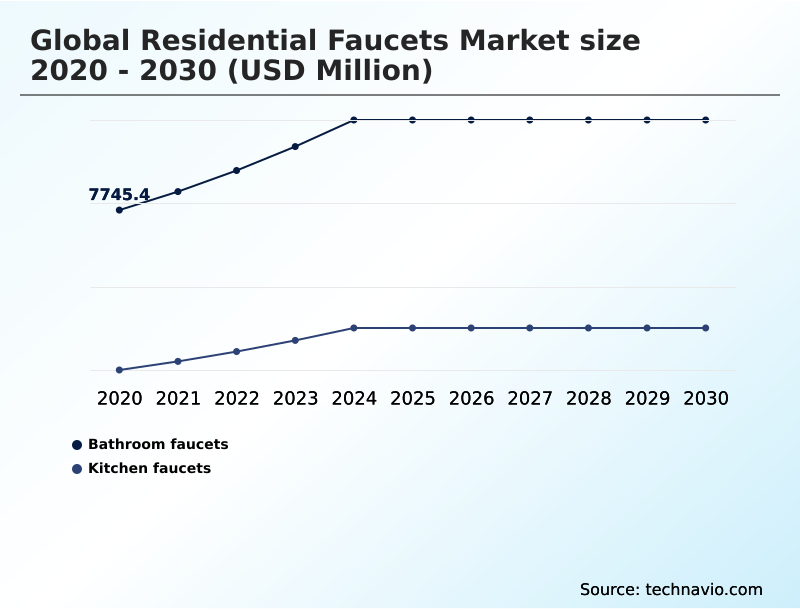
The bathroom faucets segment is estimated to witness significant growth during the forecast period.

The bathroom faucets segment, which accounts for over two-thirds of the residential market, is driven by a focus on personal wellness and aesthetic upgrades.

Homeowners are increasingly specifying premium configurations like widespread faucets and wall-mounted faucets to achieve spa-like environments, moving beyond purely functional hardware. This trend elevates the importance of thermostatic mixing valves for anti-scald protection and precision temperature control.

The industry-wide adoption of ceramic disc valves has become a standard, significantly enhancing durability and reducing maintenance.

Concurrently, a push towards sustainability is fueling demand for advanced water-saving technologies that comply with stringent environmental standards without compromising the user experience, supporting the market's ongoing aesthetic premiumization.

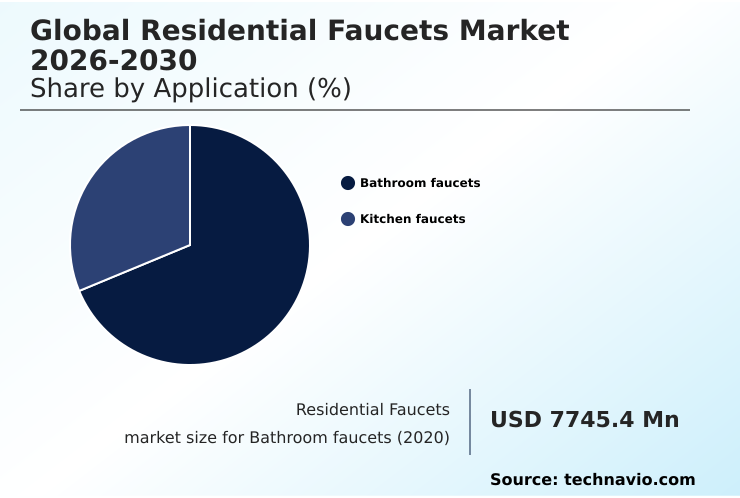
The Bathroom faucets segment was valued at USD 10.13 billion in 2024 and showed a gradual increase during the forecast period.

Residential Faucets Market by Region: North America Leads with 30.9% Growth Share

North America is estimated to contribute 30.9% to the growth of the global market during the forecast period.

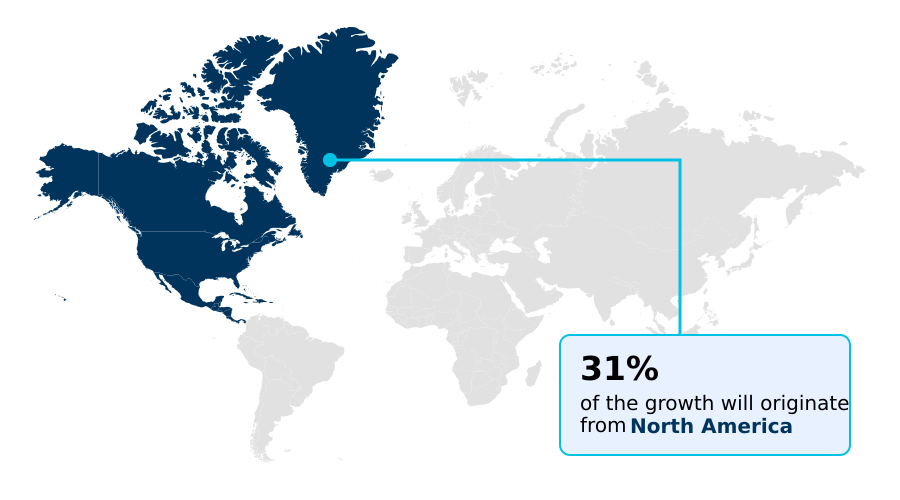
The geographic landscape of the residential faucets market is characterized by a close rivalry between mature and emerging regions. North America contributes 30.9% of the growth, driven by a strong appetite for smart touchless systems and hygienic touchless systems.

In parallel, APAC, contributing 29.9% of the growth, is fueled by rapid urbanization and new construction, where professional-grade quality is increasingly sought.

Across these diverse regions, there is a common thread of tightening sustainability mandates, which elevates the importance of durable and corrosion-resistant finishes that extend product lifecycles.

Compliance with these environmental standards, alongside the integration of smart home automation, has become a critical factor for manufacturers aiming to secure market share in both high-end renovations and large-scale residential developments.

Customer Landscape Analysis for the Residential Faucets Market

The residential faucets market forecasting report includes the adoption lifecycle of the market, covering from the innovator’s stage to the laggard’s stage. It focuses on adoption rates in different regions based on penetration. Furthermore, the residential faucets market report also includes key purchase criteria and drivers of price sensitivity to help companies evaluate and develop their market growth analysis strategies.

Competitive Landscape of the Residential Faucets Market

Companies are implementing various strategies, such as strategic alliances, partnerships, mergers and acquisitions, geographical expansion, and product/service launches, to enhance their presence in the residential faucets market industry.

BLANCO GmbH and Co. KG - Delivers innovative residential fixtures, integrating touch-activated technology and water-efficient designs for contemporary kitchen and bathroom applications.

The industry research and growth report includes detailed analyses of the competitive landscape of the market and information about key companies, including:

  • BLANCO GmbH and Co. KG
  • Brizo kitchen and bath Co.
  • Delta Faucet Co
  • Dornbracht GmbH and Co. KG
  • Duravit AG
  • Elkay Manufacturing Co.
  • Fortune Brands Innovations Inc.
  • FRANKE Holding AG
  • Geberit International AG
  • Gerber Plumbing Fixtures LLC
  • Jaquar Group
  • Kohler Co.
  • LIXIL Corp.
  • Moen Inc.
  • Oras Ltd.
  • Roca Sanitario S.A.
  • Speakman
  • Symmons Industries Inc.
  • Toto Ltd.
  • Villeroy and Boch AG

Qualitative and quantitative analysis of companies has been conducted to help clients understand the wider business environment as well as the strengths and weaknesses of key industry players. Data is qualitatively analyzed to categorize companies as pure play, category-focused, industry-focused, and diversified; it is quantitatively analyzed to categorize companies as dominant, leading, strong, tentative, and weak.

Recent Developments in the Residential Faucets Market

  • In October, 2024, Delta Faucet Co. enhanced its smart home offerings by adding full Apple HomeKit compatibility to its VoiceIQ system, expanding its connected faucet ecosystem for a larger user demographic.
  • In January, 2025, Brondell Inc. launched its Jema Kitchen Faucet Collection at the Kitchen and Bath Industry Show, merging patented spray technology with high-arch, minimalist aesthetics to enhance both utility and style.
  • In February, 2025, Delta Faucet Co. expanded its technical ecosystem by transitioning its VoiceIQ technology to a consolidated DFC at Home platform, allowing for unified control of connected water products.
  • In April, 2025, The Government of India expanded its national manufacturing incentives to boost domestic production of high-precision sanitary ware, stimulating the establishment of new fabrication units for sensor-based and automated faucets.

Research Analyst Overview: Residential Faucets Market

Boardroom decisions are being shaped by the need to navigate a complex regulatory and technological environment, where the EU Drinking Water Directive is forcing a fundamental reassessment of material supply chains. The market's accelerating growth momentum is contingent on a vendor's ability to master both material science and software.

This includes the deployment of physical vapor deposition for durable, PVD-coated matte black finishes and the engineering of high-performance aeration systems. The pivot towards hygienic touchless systems and water-saving technologies is no longer optional. Firms must offer a portfolio ranging from traditional single-hole faucets and widespread faucets to advanced wall-mounted faucets with thermostatic mixing valves.

Core component quality, dictated by ceramic disc valves and lead-free brass, is paramount. Success now depends on achieving seamless smart home interoperability for features like voice-activated dispensing across digital water networks.

This requires a strategic commitment to R&D for everything from pull-down sprayers to the underlying sensory technology and hybrid command interfaces, all while meeting stringent sustainability mandates for eco-friendly residential faucets.

Dive into Technavio’s robust research methodology, blending expert interviews, extensive data synthesis, and validated models for unparalleled Residential Faucets Market insights. See full methodology.

Request Free Sample

Market Scope
Page number 297
Base year 2025
Historic period 2020-2024
Forecast period 2026-2030
Growth momentum & CAGR Accelerate at a CAGR of 8.8%
Market growth 2026-2030 USD 8348.7 million
Market structure Fragmented
YoY growth 2025-2026(%) 8.1%
Key countries US, Canada, Mexico, China, India, Japan, South Korea, Australia, Indonesia, Germany, UK, France, Italy, Spain, The Netherlands, Saudi Arabia, UAE, Turkey, South Africa, Israel, Brazil, Argentina and Chile
Competitive landscape Leading Companies, Market Positioning of Companies, Competitive Strategies, and Industry Risks

Residential Faucets Market: Key Questions Answered in This Report

  • What is the expected growth of the Residential Faucets Market between 2026 and 2030?

    • The Residential Faucets Market is expected to grow by USD 8.35 billion during 2026-2030, registering a CAGR of 8.8%. Year-over-year growth in 2026 is estimated at 8.1%%. This acceleration is shaped by technological innovation and rise of smart touchless systems, which is intensifying demand across multiple end-use verticals covered in the report.

  • What segmentation does the market report cover?

    • The report is segmented by Application (Bathroom faucets, and Kitchen faucets), Distribution Channel (Offline, and Online), Material (Brass, Stainless steel, Chrome, Bronze, and Plastic) and Geography (North America, APAC, Europe, Middle East and Africa, South America). Among these, the Bathroom faucets segment is estimated to witness significant growth during the forecast period, driven by rising adoption across key application areas. Each segment includes detailed qualitative and quantitative analysis, along with historical data from 2020-2024 and forecasts through 2030 with year-over-year growth rates.

  • Which regions are analyzed in the report?

    • The report covers North America, APAC, Europe, Middle East and Africa and South America. North America is estimated to contribute 30.9% to market growth during the forecast period. Country-level analysis includes US, Canada, Mexico, China, India, Japan, South Korea, Australia, Indonesia, Germany, UK, France, Italy, Spain, The Netherlands, Saudi Arabia, UAE, Turkey, South Africa, Israel, Brazil, Argentina and Chile, with dedicated market size tables and year-over-year growth for each.

  • What are the key growth drivers and market challenges?

    • The primary driver is technological innovation and rise of smart touchless systems, which is accelerating investment and industry demand. The main challenge is volatility of raw material procurement and economic risk of fluctuating metal, creating operational barriers for key market participants. The report quantifies the impact of each driver and challenge across 2026 and 2030 with comparative analysis.

  • Who are the major players in the Residential Faucets Market?

    • Key vendors include BLANCO GmbH and Co. KG, Brizo kitchen and bath Co., Delta Faucet Co, Dornbracht GmbH and Co. KG, Duravit AG, Elkay Manufacturing Co., Fortune Brands Innovations Inc., FRANKE Holding AG, Geberit International AG, Gerber Plumbing Fixtures LLC, Jaquar Group, Kohler Co., LIXIL Corp., Moen Inc., Oras Ltd., Roca Sanitario S.A., Speakman, Symmons Industries Inc., Toto Ltd. and Villeroy and Boch AG. The report provides qualitative and quantitative analysis categorizing companies as dominant, leading, strong, tentative, and weak based on their market positioning. Company profiles include business segment analysis, SWOT assessment, key offerings, and recent strategic developments.

Residential Faucets Market Research Insights

Market dynamics are increasingly shaped by distinct consumer priorities and channel strategies. While the offline distribution channel maintains its dominance, the online sector is demonstrating accelerated growth, appealing to homeowners undertaking residential remodeling projects.

The preference for specific features is also segmenting the market; for example, the bathroom segment, which is substantially larger than the kitchen segment, is a focal point for aesthetic upgrades and water-saving innovations. Demand for antimicrobial coatings and durable ergonomic design is becoming standard, especially in fixtures intended for high-traffic family bathrooms.

Furthermore, achieving green building certifications under frameworks like LEED requires specifying water-efficient fixtures, influencing procurement decisions in new construction and making sustainability a key competitive differentiator for manufacturers.

We can help! Our analysts can customize this residential faucets market research report to meet your requirements.

Get in touch

1. Executive Summary

1.1 Market overview

Executive Summary - Chart on Market Overview
Executive Summary - Data Table on Market Overview
Executive Summary - Chart on Global Market Characteristics
Executive Summary - Chart on Market by Geography
Executive Summary - Chart on Market Segmentation by Application
Executive Summary - Chart on Market Segmentation by Distribution Channel
Executive Summary - Chart on Market Segmentation by Material
Executive Summary - Chart on Incremental Growth
Executive Summary - Data Table on Incremental Growth
Executive Summary - Chart on Company Market Positioning

2. Technavio Analysis

2.1 Analysis of price sensitivity, lifecycle, customer purchase basket, adoption rates, and purchase criteria

2.2 Criticality of inputs and Factors of differentiation

Chart on Overview on criticality of inputs and factors of differentiation

2.3 Factors of disruption

Chart on Overview on factors of disruption

2.4 Impact of drivers and challenges

Chart on Impact of drivers and challenges in 2025 and 2030

3. Market Landscape

3.1 Market ecosystem

Chart on Parent Market
Data Table on - Parent Market

3.2 Market characteristics

Chart on Market characteristics analysis

3.3 Value chain analysis

Chart on Value chain analysis

4. Market Sizing

4.1 Market definition

Data Table on Offerings of companies included in the market definition

4.2 Market segment analysis

Market segments

4.3 Market size 2025

4.4 Market outlook: Forecast for 2025-2030

Chart on Global - Market size and forecast 2025-2030 ($ million)
Data Table on Global - Market size and forecast 2025-2030 ($ million)
Chart on Global Market: Year-over-year growth 2025-2030 (%)
Data Table on Global Market: Year-over-year growth 2025-2030 (%)

5. Historic Market Size

5.1 Global Residential Faucets Market 2020 - 2024

Historic Market Size - Data Table on Global Residential Faucets Market 2020 - 2024 ($ million)

5.2 Application segment analysis 2020 - 2024

Historic Market Size - Application Segment 2020 - 2024 ($ million)

5.3 Distribution Channel segment analysis 2020 - 2024

Historic Market Size - Distribution Channel Segment 2020 - 2024 ($ million)

5.4 Material segment analysis 2020 - 2024

Historic Market Size - Material Segment 2020 - 2024 ($ million)

5.5 Geography segment analysis 2020 - 2024

Historic Market Size - Geography Segment 2020 - 2024 ($ million)

5.6 Country segment analysis 2020 - 2024

Historic Market Size - Country Segment 2020 - 2024 ($ million)

6. Qualitative Analysis

6.1 Impact of AI in Global Residential Faucets Market

6.2 Impact of geopolitical conflict for Global Residential Faucets Market

7. Five Forces Analysis

7.1 Five forces summary

Five forces analysis - Comparison between 2025 and 2030

7.2 Bargaining power of buyers

Bargaining power of buyers - Impact of key factors 2025 and 2030

7.3 Bargaining power of suppliers

Bargaining power of suppliers - Impact of key factors in 2025 and 2030

7.4 Threat of new entrants

Threat of new entrants - Impact of key factors in 2025 and 2030

7.5 Threat of substitutes

Threat of substitutes - Impact of key factors in 2025 and 2030

7.6 Threat of rivalry

Threat of rivalry - Impact of key factors in 2025 and 2030

7.7 Market condition

Chart on Market condition - Five forces 2025 and 2030

8. Market Segmentation by Application

8.1 Market segments

Chart on Application - Market share 2025-2030 (%)
Data Table on Application - Market share 2025-2030 (%)

8.2 Comparison by Application

Chart on Comparison by Application
Data Table on Comparison by Application

8.3 Bathroom faucets - Market size and forecast 2025-2030

Chart on Bathroom faucets - Market size and forecast 2025-2030 ($ million)
Data Table on Bathroom faucets - Market size and forecast 2025-2030 ($ million)
Chart on Bathroom faucets - Year-over-year growth 2025-2030 (%)
Data Table on Bathroom faucets - Year-over-year growth 2025-2030 (%)

8.4 Kitchen faucets - Market size and forecast 2025-2030

Chart on Kitchen faucets - Market size and forecast 2025-2030 ($ million)
Data Table on Kitchen faucets - Market size and forecast 2025-2030 ($ million)
Chart on Kitchen faucets - Year-over-year growth 2025-2030 (%)
Data Table on Kitchen faucets - Year-over-year growth 2025-2030 (%)

8.5 Market opportunity by Application

Market opportunity by Application ($ million)
Data Table on Market opportunity by Application ($ million)

9. Market Segmentation by Distribution Channel

9.1 Market segments

Chart on Distribution Channel - Market share 2025-2030 (%)
Data Table on Distribution Channel - Market share 2025-2030 (%)

9.2 Comparison by Distribution Channel

Chart on Comparison by Distribution Channel
Data Table on Comparison by Distribution Channel

9.3 Offline - Market size and forecast 2025-2030

Chart on Offline - Market size and forecast 2025-2030 ($ million)
Data Table on Offline - Market size and forecast 2025-2030 ($ million)
Chart on Offline - Year-over-year growth 2025-2030 (%)
Data Table on Offline - Year-over-year growth 2025-2030 (%)

9.4 Online - Market size and forecast 2025-2030

Chart on Online - Market size and forecast 2025-2030 ($ million)
Data Table on Online - Market size and forecast 2025-2030 ($ million)
Chart on Online - Year-over-year growth 2025-2030 (%)
Data Table on Online - Year-over-year growth 2025-2030 (%)

9.5 Market opportunity by Distribution Channel

Market opportunity by Distribution Channel ($ million)
Data Table on Market opportunity by Distribution Channel ($ million)

10. Market Segmentation by Material

10.1 Market segments

Chart on Material - Market share 2025-2030 (%)
Data Table on Material - Market share 2025-2030 (%)

10.2 Comparison by Material

Chart on Comparison by Material
Data Table on Comparison by Material

10.3 Brass - Market size and forecast 2025-2030

Chart on Brass - Market size and forecast 2025-2030 ($ million)
Data Table on Brass - Market size and forecast 2025-2030 ($ million)
Chart on Brass - Year-over-year growth 2025-2030 (%)
Data Table on Brass - Year-over-year growth 2025-2030 (%)

10.4 Stainless steel - Market size and forecast 2025-2030

Chart on Stainless steel - Market size and forecast 2025-2030 ($ million)
Data Table on Stainless steel - Market size and forecast 2025-2030 ($ million)
Chart on Stainless steel - Year-over-year growth 2025-2030 (%)
Data Table on Stainless steel - Year-over-year growth 2025-2030 (%)

10.5 Chrome - Market size and forecast 2025-2030

Chart on Chrome - Market size and forecast 2025-2030 ($ million)
Data Table on Chrome - Market size and forecast 2025-2030 ($ million)
Chart on Chrome - Year-over-year growth 2025-2030 (%)
Data Table on Chrome - Year-over-year growth 2025-2030 (%)

10.6 Bronze - Market size and forecast 2025-2030

Chart on Bronze - Market size and forecast 2025-2030 ($ million)
Data Table on Bronze - Market size and forecast 2025-2030 ($ million)
Chart on Bronze - Year-over-year growth 2025-2030 (%)
Data Table on Bronze - Year-over-year growth 2025-2030 (%)

10.7 Plastic - Market size and forecast 2025-2030

Chart on Plastic - Market size and forecast 2025-2030 ($ million)
Data Table on Plastic - Market size and forecast 2025-2030 ($ million)
Chart on Plastic - Year-over-year growth 2025-2030 (%)
Data Table on Plastic - Year-over-year growth 2025-2030 (%)

10.8 Market opportunity by Material

Market opportunity by Material ($ million)
Data Table on Market opportunity by Material ($ million)

11. Customer Landscape

11.1 Customer landscape overview

Analysis of price sensitivity, lifecycle, customer purchase basket, adoption rates, and purchase criteria

12. Geographic Landscape

12.1 Geographic segmentation

Chart on Market share by geography 2025-2030 (%)
Data Table on Market share by geography 2025-2030 (%)

12.2 Geographic comparison

Chart on Geographic comparison
Data Table on Geographic comparison

12.3 North America - Market size and forecast 2025-2030

Chart on North America - Market size and forecast 2025-2030 ($ million)
Data Table on North America - Market size and forecast 2025-2030 ($ million)
Chart on North America - Year-over-year growth 2025-2030 (%)
Data Table on North America - Year-over-year growth 2025-2030 (%)
Chart on Regional Comparison - North America
Data Table on Regional Comparison - North America

12.3.1 US - Market size and forecast 2025-2030

Chart on US - Market size and forecast 2025-2030 ($ million)
Data Table on US - Market size and forecast 2025-2030 ($ million)
Chart on US - Year-over-year growth 2025-2030 (%)
Data Table on US - Year-over-year growth 2025-2030 (%)

12.3.2 Canada - Market size and forecast 2025-2030

Chart on Canada - Market size and forecast 2025-2030 ($ million)
Data Table on Canada - Market size and forecast 2025-2030 ($ million)
Chart on Canada - Year-over-year growth 2025-2030 (%)
Data Table on Canada - Year-over-year growth 2025-2030 (%)

12.3.3 Mexico - Market size and forecast 2025-2030

Chart on Mexico - Market size and forecast 2025-2030 ($ million)
Data Table on Mexico - Market size and forecast 2025-2030 ($ million)
Chart on Mexico - Year-over-year growth 2025-2030 (%)
Data Table on Mexico - Year-over-year growth 2025-2030 (%)

12.4 APAC - Market size and forecast 2025-2030

Chart on APAC - Market size and forecast 2025-2030 ($ million)
Data Table on APAC - Market size and forecast 2025-2030 ($ million)
Chart on APAC - Year-over-year growth 2025-2030 (%)
Data Table on APAC - Year-over-year growth 2025-2030 (%)
Chart on Regional Comparison - APAC
Data Table on Regional Comparison - APAC

12.4.1 China - Market size and forecast 2025-2030

Chart on China - Market size and forecast 2025-2030 ($ million)
Data Table on China - Market size and forecast 2025-2030 ($ million)
Chart on China - Year-over-year growth 2025-2030 (%)
Data Table on China - Year-over-year growth 2025-2030 (%)

12.4.2 India - Market size and forecast 2025-2030

Chart on India - Market size and forecast 2025-2030 ($ million)
Data Table on India - Market size and forecast 2025-2030 ($ million)
Chart on India - Year-over-year growth 2025-2030 (%)
Data Table on India - Year-over-year growth 2025-2030 (%)

12.4.3 Japan - Market size and forecast 2025-2030

Chart on Japan - Market size and forecast 2025-2030 ($ million)
Data Table on Japan - Market size and forecast 2025-2030 ($ million)
Chart on Japan - Year-over-year growth 2025-2030 (%)
Data Table on Japan - Year-over-year growth 2025-2030 (%)

12.4.4 South Korea - Market size and forecast 2025-2030

Chart on South Korea - Market size and forecast 2025-2030 ($ million)
Data Table on South Korea - Market size and forecast 2025-2030 ($ million)
Chart on South Korea - Year-over-year growth 2025-2030 (%)
Data Table on South Korea - Year-over-year growth 2025-2030 (%)

12.4.5 Australia - Market size and forecast 2025-2030

Chart on Australia - Market size and forecast 2025-2030 ($ million)
Data Table on Australia - Market size and forecast 2025-2030 ($ million)
Chart on Australia - Year-over-year growth 2025-2030 (%)
Data Table on Australia - Year-over-year growth 2025-2030 (%)

12.4.6 Indonesia - Market size and forecast 2025-2030

Chart on Indonesia - Market size and forecast 2025-2030 ($ million)
Data Table on Indonesia - Market size and forecast 2025-2030 ($ million)
Chart on Indonesia - Year-over-year growth 2025-2030 (%)
Data Table on Indonesia - Year-over-year growth 2025-2030 (%)

12.5 Europe - Market size and forecast 2025-2030

Chart on Europe - Market size and forecast 2025-2030 ($ million)
Data Table on Europe - Market size and forecast 2025-2030 ($ million)
Chart on Europe - Year-over-year growth 2025-2030 (%)
Data Table on Europe - Year-over-year growth 2025-2030 (%)
Chart on Regional Comparison - Europe
Data Table on Regional Comparison - Europe

12.5.1 Germany - Market size and forecast 2025-2030

Chart on Germany - Market size and forecast 2025-2030 ($ million)
Data Table on Germany - Market size and forecast 2025-2030 ($ million)
Chart on Germany - Year-over-year growth 2025-2030 (%)
Data Table on Germany - Year-over-year growth 2025-2030 (%)

12.5.2 UK - Market size and forecast 2025-2030

Chart on UK - Market size and forecast 2025-2030 ($ million)
Data Table on UK - Market size and forecast 2025-2030 ($ million)
Chart on UK - Year-over-year growth 2025-2030 (%)
Data Table on UK - Year-over-year growth 2025-2030 (%)

12.5.3 France - Market size and forecast 2025-2030

Chart on France - Market size and forecast 2025-2030 ($ million)
Data Table on France - Market size and forecast 2025-2030 ($ million)
Chart on France - Year-over-year growth 2025-2030 (%)
Data Table on France - Year-over-year growth 2025-2030 (%)

12.5.4 Italy - Market size and forecast 2025-2030

Chart on Italy - Market size and forecast 2025-2030 ($ million)
Data Table on Italy - Market size and forecast 2025-2030 ($ million)
Chart on Italy - Year-over-year growth 2025-2030 (%)
Data Table on Italy - Year-over-year growth 2025-2030 (%)

12.5.5 Spain - Market size and forecast 2025-2030

Chart on Spain - Market size and forecast 2025-2030 ($ million)
Data Table on Spain - Market size and forecast 2025-2030 ($ million)
Chart on Spain - Year-over-year growth 2025-2030 (%)
Data Table on Spain - Year-over-year growth 2025-2030 (%)

12.5.6 The Netherlands - Market size and forecast 2025-2030

Chart on The Netherlands - Market size and forecast 2025-2030 ($ million)
Data Table on The Netherlands - Market size and forecast 2025-2030 ($ million)
Chart on The Netherlands - Year-over-year growth 2025-2030 (%)
Data Table on The Netherlands - Year-over-year growth 2025-2030 (%)

12.6 Middle East and Africa - Market size and forecast 2025-2030

Chart on Middle East and Africa - Market size and forecast 2025-2030 ($ million)
Data Table on Middle East and Africa - Market size and forecast 2025-2030 ($ million)
Chart on Middle East and Africa - Year-over-year growth 2025-2030 (%)
Data Table on Middle East and Africa - Year-over-year growth 2025-2030 (%)
Chart on Regional Comparison - Middle East and Africa
Data Table on Regional Comparison - Middle East and Africa

12.6.1 Saudi Arabia - Market size and forecast 2025-2030

Chart on Saudi Arabia - Market size and forecast 2025-2030 ($ million)
Data Table on Saudi Arabia - Market size and forecast 2025-2030 ($ million)
Chart on Saudi Arabia - Year-over-year growth 2025-2030 (%)
Data Table on Saudi Arabia - Year-over-year growth 2025-2030 (%)

12.6.2 UAE - Market size and forecast 2025-2030

Chart on UAE - Market size and forecast 2025-2030 ($ million)
Data Table on UAE - Market size and forecast 2025-2030 ($ million)
Chart on UAE - Year-over-year growth 2025-2030 (%)
Data Table on UAE - Year-over-year growth 2025-2030 (%)

12.6.3 Turkey - Market size and forecast 2025-2030

Chart on Turkey - Market size and forecast 2025-2030 ($ million)
Data Table on Turkey - Market size and forecast 2025-2030 ($ million)
Chart on Turkey - Year-over-year growth 2025-2030 (%)
Data Table on Turkey - Year-over-year growth 2025-2030 (%)

12.6.4 South Africa - Market size and forecast 2025-2030

Chart on South Africa - Market size and forecast 2025-2030 ($ million)
Data Table on South Africa - Market size and forecast 2025-2030 ($ million)
Chart on South Africa - Year-over-year growth 2025-2030 (%)
Data Table on South Africa - Year-over-year growth 2025-2030 (%)

12.6.5 Israel - Market size and forecast 2025-2030

Chart on Israel - Market size and forecast 2025-2030 ($ million)
Data Table on Israel - Market size and forecast 2025-2030 ($ million)
Chart on Israel - Year-over-year growth 2025-2030 (%)
Data Table on Israel - Year-over-year growth 2025-2030 (%)

12.7 South America - Market size and forecast 2025-2030

Chart on South America - Market size and forecast 2025-2030 ($ million)
Data Table on South America - Market size and forecast 2025-2030 ($ million)
Chart on South America - Year-over-year growth 2025-2030 (%)
Data Table on South America - Year-over-year growth 2025-2030 (%)
Chart on Regional Comparison - South America
Data Table on Regional Comparison - South America

12.7.1 Brazil - Market size and forecast 2025-2030

Chart on Brazil - Market size and forecast 2025-2030 ($ million)
Data Table on Brazil - Market size and forecast 2025-2030 ($ million)
Chart on Brazil - Year-over-year growth 2025-2030 (%)
Data Table on Brazil - Year-over-year growth 2025-2030 (%)

12.7.2 Argentina - Market size and forecast 2025-2030

Chart on Argentina - Market size and forecast 2025-2030 ($ million)
Data Table on Argentina - Market size and forecast 2025-2030 ($ million)
Chart on Argentina - Year-over-year growth 2025-2030 (%)
Data Table on Argentina - Year-over-year growth 2025-2030 (%)

12.7.3 Chile - Market size and forecast 2025-2030

Chart on Chile - Market size and forecast 2025-2030 ($ million)
Data Table on Chile - Market size and forecast 2025-2030 ($ million)
Chart on Chile - Year-over-year growth 2025-2030 (%)
Data Table on Chile - Year-over-year growth 2025-2030 (%)

12.8 Market opportunity by geography

Market opportunity by geography ($ million)
Data Tables on Market opportunity by geography ($ million)

13. Drivers, Challenges, and Opportunity

13.1 Market drivers

Technological innovation and rise of smart touchless systems
Expanding residential remodeling and focus on aesthetic premiumization
Increasing sustainability mandates and demand for water-efficient fixtures

13.2 Market challenges

Volatility of raw material procurement and economic risk of fluctuating metal
Intensification of regulatory compliance and transition to lead-free material
Crisis of technical interoperability and cybersecurity vulnerabilities of smart faucet

13.3 Impact of drivers and challenges

Impact of drivers and challenges in 2025 and 2030

13.4 Market opportunities

Integration of sensory technology and hybrid command interfaces
Growth of high-performance aeration and water conservation mandates
Expansion of digital water networks and smart home interoperability

14. Competitive Landscape

14.1 Overview

14.2

Overview on criticality of inputs and factors of differentiation

14.3 Landscape disruption

Overview on factors of disruption

14.4 Industry risks

Impact of key risks on business

15. Competitive Analysis

15.1 Companies profiled

Companies covered

15.2 Company ranking index

15.3 Market positioning of companies

Matrix on companies position and classification

15.4 Delta Faucet Co

Delta Faucet Co - Overview
Delta Faucet Co - Product / Service
Delta Faucet Co - Key offerings
SWOT

15.5 Dornbracht GmbH and Co. KG

Dornbracht GmbH and Co. KG - Overview
Dornbracht GmbH and Co. KG - Product / Service
Dornbracht GmbH and Co. KG - Key offerings
SWOT

15.6 Duravit AG

Duravit AG - Overview
Duravit AG - Product / Service
Duravit AG - Key offerings
SWOT

15.7 Elkay Manufacturing Co.

Elkay Manufacturing Co. - Overview
Elkay Manufacturing Co. - Product / Service
Elkay Manufacturing Co. - Key offerings
SWOT

15.8 Fortune Brands Innovations Inc.

Fortune Brands Innovations Inc. - Overview
Fortune Brands Innovations Inc. - Business segments
Fortune Brands Innovations Inc. - Key offerings
Fortune Brands Innovations Inc. - Segment focus
SWOT

15.9 FRANKE Holding AG

FRANKE Holding AG - Overview
FRANKE Holding AG - Product / Service
FRANKE Holding AG - Key offerings
SWOT

15.10 Geberit International AG

Geberit International AG - Overview
Geberit International AG - Business segments
Geberit International AG - Key offerings
Geberit International AG - Segment focus
SWOT

15.11 Jaquar Group

Jaquar Group - Overview
Jaquar Group - Product / Service
Jaquar Group - Key offerings
SWOT

15.12 Kohler Co.

Kohler Co. - Overview
Kohler Co. - Product / Service
Kohler Co. - Key offerings
SWOT

15.13 LIXIL Corp.

LIXIL Corp. - Overview
LIXIL Corp. - Business segments
LIXIL Corp. - Key offerings
LIXIL Corp. - Segment focus
SWOT

15.14 Moen Inc.

Moen Inc. - Overview
Moen Inc. - Product / Service
Moen Inc. - Key offerings
SWOT

15.15 Roca Sanitario S.A.

Roca Sanitario S.A. - Overview
Roca Sanitario S.A. - Product / Service
Roca Sanitario S.A. - Key offerings
SWOT

15.16 Symmons Industries Inc.

Symmons Industries Inc. - Overview
Symmons Industries Inc. - Product / Service
Symmons Industries Inc. - Key offerings
SWOT

15.17 Toto Ltd.

Toto Ltd. - Overview
Toto Ltd. - Business segments
Toto Ltd. - Key offerings
Toto Ltd. - Segment focus
SWOT

15.18 Villeroy and Boch AG

Villeroy and Boch AG - Overview
Villeroy and Boch AG - Business segments
Villeroy and Boch AG - Key news
Villeroy and Boch AG - Key offerings
Villeroy and Boch AG - Segment focus
SWOT

16. Appendix

16.1 Scope of the report

Market definition
Objectives
Notes and caveats

16.2 Inclusions and exclusions checklist

Inclusions checklist
Exclusions checklist

16.3 Currency conversion rates for US$

16.4 Research methodology

16.5 Data procurement

Information sources

16.6 Data validation

16.7 Validation techniques employed for market sizing

16.8 Data synthesis

16.9 360 degree market analysis

16.10 List of abbreviations

Research Methodology

Technavio presents a detailed picture of the market by way of study, synthesis, and summation of data from multiple sources. The analysts have presented the various facets of the market with a particular focus on identifying the key industry influencers. The data thus presented is comprehensive, reliable, and the result of extensive research, both primary and secondary.

INFORMATION SOURCES

Primary sources

  • Manufacturers and suppliers
  • Channel partners
  • Industry experts
  • Strategic decision makers

Secondary sources

  • Industry journals and periodicals
  • Government data
  • Financial reports of key industry players
  • Historical data
  • Press releases

DATA ANALYSIS

Data Synthesis

  • Collation of data
  • Estimation of key figures
  • Analysis of derived insights

Data Validation

  • Triangulation with data models
  • Reference against proprietary databases
  • Corroboration with industry experts

REPORT WRITING

Qualitative

  • Market drivers
  • Market challenges
  • Market trends
  • Five forces analysis

Quantitative

  • Market size and forecast
  • Market segmentation
  • Geographical insights
  • Competitive landscape

Interested in this report?

Get your sample now to see our research methodology and insights!

Download Now

Frequently Asked Questions

Residential Faucets market growth will increase by USD 8348.7 million during 2026-2030.

The Residential Faucets market is expected to grow at a CAGR of 8.8% during 2026-2030.

Residential Faucets market is segmented by Application (Bathroom faucets, Kitchen faucets) Distribution channel (Offline, Online) Material (Brass, Stainless steel, Chrome, Bronze, Plastic)

BLANCO GmbH and Co. KG, Brizo kitchen and bath Co., Delta Faucet Co, Dornbracht GmbH and Co. KG, Duravit AG, Elkay Manufacturing Co., Fortune Brands Innovations Inc., FRANKE Holding AG, Geberit International AG, Gerber Plumbing Fixtures LLC, Jaquar Group, Kohler Co., LIXIL Corp., Moen Inc., Oras Ltd., Roca Sanitario S.A., Speakman, Symmons Industries Inc., Toto Ltd., Villeroy and Boch AG are a few of the key vendors in the Residential Faucets market.

North America will register the highest growth rate of 30.9% among the other regions. Therefore, the Residential Faucets market in North America is expected to garner significant business opportunities for the vendors during the forecast period.

US, Canada, Mexico, China, India, Japan, South Korea, Australia, Indonesia, Germany, UK, France, Italy, Spain, The Netherlands, Saudi Arabia, UAE, Turkey, South Africa, Israel, Brazil, Argentina, Chile

  • Technological innovation and rise of smart touchless systems is the driving factor this market.

The Residential Faucets market vendors should focus on grabbing business opportunities from the Application segment as it accounted for the largest market share in the base year.
RIA - Research AI Assistant
Ask RIA