Residential Gas Generator Market Size 2025-2029
The residential gas generator market size is forecast to increase by USD 672 million, at a CAGR of 7.4% between 2024 and 2029.
- The market is experiencing significant growth due to the increasing preference for backup power solutions in the face of frequent power outages and grid instability. Gas generators offer several advantages, including longer runtime hours and the ability to power larger appliances and systems compared to alternative backup power packs. However, the availability of these alternatives, such as solar and battery-powered systems, poses a challenge to the market. The growing popularity of these alternatives, driven by advancements in technology and decreasing costs, is compelling some consumers to opt for renewable energy solutions over traditional gas generators. Nevertheless, the reliability and efficiency of gas generators, particularly during prolonged power outages, make them an attractive option for many households.
- Companies in the market can capitalize on this demand by focusing on innovation, efficiency, and cost competitiveness, while also addressing the environmental concerns associated with gas-powered generators. Effective marketing strategies and partnerships with utility companies and home builders can also help expand market reach and penetration. Overall, the market presents both opportunities and challenges, requiring strategic planning and adaptability to navigate the evolving energy landscape.
What will be the Size of the Residential Gas Generator Market during the forecast period?

Explore in-depth regional segment analysis with market size data - historical 2019-2023 and forecasts 2025-2029 - in the full report.
Request Free Sample
The market continues to evolve, driven by the increasing demand for reliable backup power solutions. Fuel efficiency is a key focus, with advancements in engine technology leading to improved performance and longer run times. Oil filters and air filters play crucial roles in maintaining generator longevity, while carbon monoxide detectors ensure safe operation. Power outlets, inverter generators, and generator panels are essential components of home power systems, providing seamless integration of backup power into residential applications. Indoor generators and gasoline generators offer flexibility for various usage scenarios, while whole-house protection and solar integration enable grid independence.
Market dynamics are shaped by ongoing developments in technology, safety regulations, and consumer preferences. Inverter generators, for instance, offer quieter operation and improved fuel efficiency compared to conventional generators. Remote monitoring and automatic transfer switches enhance convenience and reliability. Fuel lines, engine lubricants, and generator repair services ensure optimal generator performance. Ul certification and NFPA codes set safety standards, while generator sizing and installation services cater to diverse customer needs. Generator dealers provide expert advice and maintenance solutions, offering peace of mind for homeowners seeking backup power. The market's continuous unfolding is marked by evolving patterns, from engine RPM and cylinder count to load management and parallel operation.
As the market adapts to changing consumer demands and technological advancements, it remains a dynamic and exciting space for innovation and growth.
How is this Residential Gas Generator Industry segmented?
The residential gas generator industry research report provides comprehensive data (region-wise segment analysis), with forecasts and estimates in "USD million" for the period 2025-2029, as well as historical data from 2019-2023 for the following segments.
- Type
- Stationary
- Portable
- Fuel Type
- Natural gas
- Propane
- Power Output
- Up to 5 kW
- 5 - 10 kW
- 10 - 15 kW
- 15 - 20 kW
- Over 20 kW
- Application
- Primary power source
- Backup power source
- Recreational use
- Variant
- Automatic transfer switch (ATS)
- Manual transfer switch (MTS)
- No transfer switch
- Power Rating
- 0-100 kVA
- 101-350 kVA
- 351-1000 kVA
- Above 1000 KVA
- Geography
- North America
- US
- Canada
- Europe
- France
- Germany
- Italy
- The Netherlands
- UK
- APAC
- China
- India
- Japan
- Rest of World (ROW)
- North America
By Type Insights
The stationary segment is estimated to witness significant growth during the forecast period.
In the realm of residential power solutions, stationary gas generators have emerged as a popular choice for backup power and grid independence. These generators can be hardwired to a home's main power distribution unit panel, enabling seamless integration with cooling systems and critical load protection. Manual operation is an option, but automatic transfer switches provide added convenience during power outages. When the utility grid fails, the transfer switch isolates the electrical wiring and initiates generator operation, delivering power to the lines. Upon power restoration, the reverse action occurs, with the incoming feed reverting to the utility service and the generator returning to standby mode.
This transition typically takes between 10 and 30 seconds. Safety regulations, such as NFPA codes, govern the installation and operation of these systems. Fuel lines and generator repair require regular maintenance, along with the replacement of engine lubricants, oil filters, air filters, and spark plugs. Inverter generators and dual fuel models offer increased fuel efficiency and versatility. Smart home integration and solar power systems expand the capabilities of these generators, providing additional energy storage and backup power options. Generator size and engine rpm are crucial factors in determining power output. Noise level and exhaust system considerations are essential for outdoor installations.
Generator dealers offer service contracts and installation services to ensure optimal performance and safety. Parallel operation and automatic transfer switches enable whole-house protection, while manual transfer switches and voltage regulators provide additional control. Safety regulations mandate the use of carbon monoxide detectors, exhaust mufflers, and proper fuel tank installation. UL certification ensures compliance with safety standards. Remote monitoring and generator panels offer added convenience and peace of mind, while generator sheds and portable models provide flexibility in various applications. In summary, the market showcases a dynamic and evolving landscape, with a focus on efficiency, safety, and integration with various power systems.
From conventional generators to smart home solutions, these systems provide essential backup power and grid independence for homes and businesses.
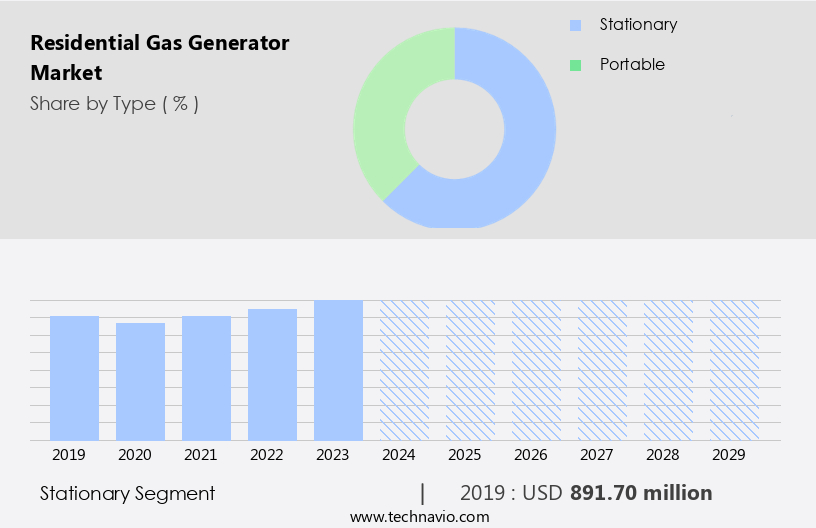
The Stationary segment was valued at USD 891.70 million in 2019 and showed a gradual increase during the forecast period.
Regional Analysis
North America is estimated to contribute 39% to the growth of the global market during the forecast period. Technavio's analysts have elaborately explained the regional trends and drivers that shape the market during the forecast period.

The market in North America is experiencing significant growth, with the United States leading the demand. The increasing frequency and severity of natural disasters, such as hurricanes, windstorms, floods, and earthquakes, have resulted in prolonged power outages, necessitating backup power solutions. Pipeline capacity expansion, driven by the abundant gas supply from shale formations, is a crucial factor fueling the market's growth. In response to this demand, various offerings have emerged to cater to diverse consumer needs. These include conventional generators, inverter generators, and standby generators. Cooling systems, surge protection, and remote monitoring are essential features in these generators, ensuring efficient performance and safety.
Manufacturers are also focusing on integrating smart home technology and solar power systems for enhanced functionality and energy efficiency. Engine lubricants, oil filters, air filters, and carbon monoxide detectors are essential components of generator maintenance kits, ensuring reliable and long-lasting operation. Safety regulations, such as NFPA codes and UL certification, are stringently enforced to ensure generator safety and performance. Installation services, generator repair, and generator service contracts are also available to cater to the growing demand for these essential power solutions. Diesel and natural gas generators, available in various engine sizes, offer different power output levels to meet diverse residential power requirements.
Parallel operation and automatic transfer switches enable seamless integration of multiple generators for whole-house protection. Moreover, noise level, fuel efficiency, and fuel tanks are essential considerations for outdoor generators. Generator sheds and generator transfer switches are essential accessories for safe and efficient generator operation. In conclusion, the market in North America is witnessing substantial growth due to the increasing demand for backup power solutions in the face of natural disasters and power outages. Manufacturers are responding to this demand by offering a range of generators with advanced features and technologies to cater to diverse consumer needs.
Market Dynamics
Our researchers analyzed the data with 2024 as the base year, along with the key drivers, trends, and challenges. A holistic analysis of drivers will help companies refine their marketing strategies to gain a competitive advantage.
In the market, consumers seek reliable backup power solutions for their homes during power outages. These generators run on natural gas or propane, providing a cleaner and more efficient alternative to diesel generators. The market caters to various consumer needs, offering portable and standby models. Portable gas generators are ideal for camping trips or temporary power backup, while standby generators are permanently installed and automatically start during power loss. Gas generators boast several advantages over other power sources. They have longer run times, produce fewer emissions, and require less maintenance than diesel generators. Additionally, natural gas and propane are abundant and easily accessible fuels, ensuring a consistent power supply. The market continues to grow, driven by increasing power outages, advancements in technology, and consumer demand for cleaner and more efficient backup power solutions. Homeowners consider factors such as power output, fuel efficiency, noise level, and ease of use when selecting a residential gas generator. Some models come equipped with advanced features like automatic transfer switches, remote monitoring systems, and parallel capabilities, enhancing their functionality and convenience. Overall, the market offers a wide range of options catering to diverse consumer needs and preferences.
What are the key market drivers leading to the rise in the adoption of Residential Gas Generator Industry?
- The increasing demand for gas generators is the primary factor fueling market growth. (Within the context of this prompt, the "growing popularity" and "key driver" of the market can be expressed as "increasing demand" for gas generators.)
- The demand for residential gas generators has been on the rise in recent years due to their numerous advantages over conventional diesel generators. Natural gas, a dominant fuel source obtained from tight rock formations using advanced technologies like horizontal drilling and smart communication, is increasingly accessible and cleaner than diesel. Gas generators operate on this cleaner fuel, reducing greenhouse gas emissions, making them an eco-friendly alternative. Unlike diesel generators, which require storage, regular maintenance, and refilling, gas generators can be refilled using gas pipelines from utilities. Moreover, gas generators offer added benefits such as battery backup, cooling systems, surge protection, and smart home integration, making them an attractive choice for emergency power needs.
- Critical load protection is ensured through engine lubricants, exhaust mufflers, and generator repair kits. Gas generators also provide grid independence, enabling remote monitoring and reducing reliance on the power grid. NFPA codes ensure safety standards, while fuel lines and generator repair are essential for optimal performance. In summary, the shift towards cleaner fuel sources, ease of refueling, and advanced features make residential gas generators a preferred choice for emergency power solutions.
What are the market trends shaping the Residential Gas Generator Industry?
- The emerging trend in the market involves the increasing availability of alternative backup power packs as a viable solution. These innovative power solutions are gaining popularity and are a must-have for ensuring uninterrupted power supply.
- In the residential power market, traditional gas generators have faced increasing competition from alternative backup solutions due to rising fuel and equipment costs, maintenance expenses, storage requirements, and emission regulations. Among these alternatives, power packs with inverter technology and large battery capacity have gained significant popularity. These power packs offer several advantages, including ease of use with AC wall plug-style outlets and USB ports, quiet operation, and fuel efficiency. Moreover, they are environmentally friendly and can be integrated with solar power for extended run time.
- Generator panels, oil filters, air filters, carbon monoxide detectors, and inverter generators are essential components of these power packs, ensuring whole-house protection and backup power during power outages. The market for residential power systems continues to evolve, with an emphasis on innovation and sustainability.
What challenges does the Residential Gas Generator Industry face during its growth?
- The growth of the industry is significantly influenced by the limited availability of viable alternatives.
- The market has seen a shift towards alternative power solutions due to rising maintenance and fuel costs, as well as increasing environmental concerns. Battery power packs and inverter technology are gaining popularity as cost-effective and eco-friendly backup power options. These power packs, which typically consist of a large battery and an inbuilt inverter, offer user-friendly features such as AC wall-plug-styled outlets and USB ports. They are also easy to design, build, and operate securely, with the DC output from the battery efficiently converted to AC power using an inverter. Safety regulations, including Ul certification, are crucial considerations in the residential generator market.
- Alternative power solutions, such as portable generators, dual fuel generators, natural gas generators, and standby generators, must adhere to these regulations. Additionally, engine size, engine rpm, manual transfer switches, service contracts, spark plugs, and parallel operation are essential factors when choosing a generator. For those seeking larger power outputs, diesel generators may be a preferred option. Generator sizing is essential to ensure adequate power for essential appliances and systems during power outages. Proper generator service is crucial to maintain optimal performance and longevity. Overall, the residential generator market offers a range of options to meet various power needs and preferences, with a focus on safety, efficiency, and cost-effectiveness.
Exclusive Customer Landscape
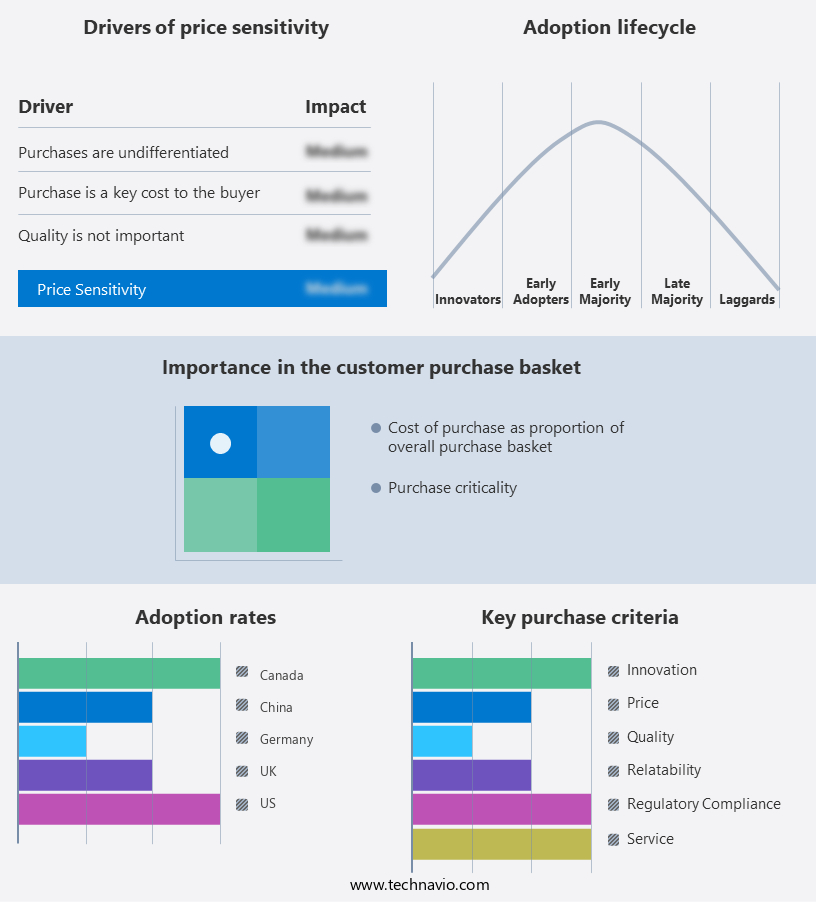
The residential gas generator market forecasting report includes the adoption lifecycle of the market, covering from the innovator's stage to the laggard's stage. It focuses on adoption rates in different regions based on penetration. Furthermore, the residential gas generator market report also includes key purchase criteria and drivers of price sensitivity to help companies evaluate and develop their market growth analysis strategies.
Customer Landscape
Key Companies & Market Insights
Companies are implementing various strategies, such as strategic alliances, residential gas generator market forecast, partnerships, mergers and acquisitions, geographical expansion, and product/service launches, to enhance their presence in the industry.
Aggreko Plc - The company specializes in providing high-performance residential gas generators, including the 1375 kVA and 1875 kVA models.
The industry research and growth report includes detailed analyses of the competitive landscape of the market and information about key companies, including:
- Aggreko Plc
- Atlas Copco AB
- Briggs and Stratton LLC
- Caterpillar Inc.
- Champion Power Equipment Inc.
- Cummins Inc.
- DuroMax Power Equipment
- Generac Holdings Inc.
- Honda Motor Co. Ltd.
- HIMOINSA SL
- Kohler Co.
- PR INDUSTRIAL Srl
- Pulsar Products Inc.
- Rolls Royce Holdings Plc
- WEN Products
Qualitative and quantitative analysis of companies has been conducted to help clients understand the wider business environment as well as the strengths and weaknesses of key industry players. Data is qualitatively analyzed to categorize companies as pure play, category-focused, industry-focused, and diversified; it is quantitatively analyzed to categorize companies as dominant, leading, strong, tentative, and weak.
Recent Development and News in Residential Gas Generator Market
- In January 2024, Caterpillar Inc. (NYSE: CAT) announced the launch of its new 30 kW residential standby generator, the Caterpillar CG30, designed to provide backup power for homes during power outages (Caterpillar Press Release, 2024). This addition to their product line expanded their offerings in the market.
- In March 2024, Generac Holdings Inc. (NYSE: GNRC) and Tesla, Inc. (NASDAQ: TSLA) announced a strategic partnership to integrate Generac's backup power systems with Tesla's Powerwall home battery (Generac Press Release, 2024). This collaboration aimed to provide a more comprehensive and efficient energy storage solution for residential customers.
- In April 2025, Briggs & Stratton Corporation, a leading manufacturer of power generation equipment, was acquired by Kohler Co. For approximately USD550 million (Reuters, 2025). This acquisition significantly increased Kohler's presence in the market, making it a major player alongside Caterpillar and Generac.
- In May 2025, the European Union (EU) approved new regulations to phase out the sale of new fossil fuel-powered generators by 2030, with exceptions for backup power systems (European Commission, 2025). This policy change is expected to drive demand for alternative, cleaner energy-based residential backup power solutions.
Research Analyst Overview
- In the market, site surveys play a crucial role in determining generator capacity and optimal placement for efficient performance. Generator optimization is a key trend, with base load management systems and automatic shutdown features ensuring consistent power delivery and regulatory compliance. Generator insurance and financing options cater to varying budgets and risk management needs. Fuel management systems and fuel delivery services ensure uninterrupted power supply, while parallel wiring kits enable seamless connection to the grid during peak load periods. Safety features, such as high temperature shutdown and engine diagnostics, are essential for generator technology, ensuring reliable operation and preventing potential hazards.
- Preventive maintenance schedules and remote start capabilities enhance convenience and prolong generator lifespan. Generator controls, power factor correction, and electrical permits ensure code compliance and efficient energy consumption. Generator capacity, generator footprint, and installation requirements vary among engine types and efficiency ratings, making it essential to consider these factors during the purchasing process. Generator monitoring systems and generator testing are essential for maintaining optimal performance and identifying potential issues before they become major problems. Overload protection and generator capacity are critical considerations for businesses relying on backup power, while fuel storage and fuel delivery logistics are essential for ensuring uninterrupted power supply.
- Overall, the market is dynamic, with a focus on efficiency, safety, and reliability.
Dive into Technavio's robust research methodology, blending expert interviews, extensive data synthesis, and validated models for unparalleled Residential Gas Generator Market insights. See full methodology.
|
Market Scope |
|
|
Report Coverage |
Details |
|
Page number |
282 |
|
Base year |
2024 |
|
Historic period |
2019-2023 |
|
Forecast period |
2025-2029 |
|
Growth momentum & CAGR |
Accelerate at a CAGR of 7.4% |
|
Market growth 2025-2029 |
USD 672 million |
|
Market structure |
Fragmented |
|
YoY growth 2024-2025(%) |
6.8 |
|
Key countries |
US, Canada, UK, China, Germany, France, Japan, The Netherlands, Italy, and India |
|
Competitive landscape |
Leading Companies, Market Positioning of Companies, Competitive Strategies, and Industry Risks |
What are the Key Data Covered in this Residential Gas Generator Market Research and Growth Report?
- CAGR of the Residential Gas Generator industry during the forecast period
- Detailed information on factors that will drive the growth and forecasting between 2025 and 2029
- Precise estimation of the size of the market and its contribution of the industry in focus to the parent market
- Accurate predictions about upcoming growth and trends and changes in consumer behaviour
- Growth of the market across North America, Europe, APAC, Middle East and Africa, and South America
- Thorough analysis of the market's competitive landscape and detailed information about companies
- Comprehensive analysis of factors that will challenge the residential gas generator market growth of industry companies
We can help! Our analysts can customize this residential gas generator market research report to meet your requirements.
 RIA -
RIA - 
