Residential Solar Photovoltaic (PV) Systems Market Analysis APAC, Europe, North America, Middle East and Africa, South America - China, US, Germany, India, UK - Size and Forecast 2024-2028

Residential Solar Photovoltaic (PV) Systems Market Analysis APAC, Europe, North America, Middle East and Africa, South America - China, US, Germany, India, UK - Size and Forecast 2024-2028

Published: Aug 2024 180 Pages SKU: IRTNTR46617

Market Overview at a Glance

$13.25 B
Market Opportunity
4.73%
CAGR
4.22
YoY growth 2023-2024(%)

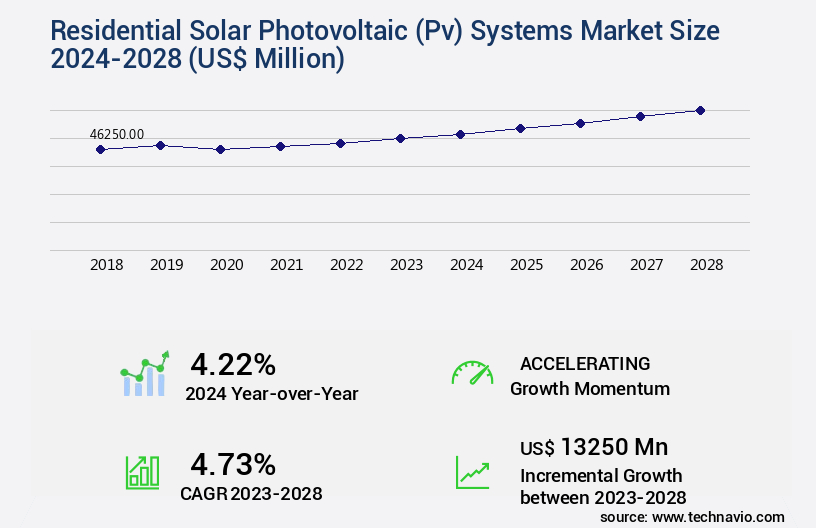
Residential Solar Photovoltaic (PV) Systems Market Size 2024-2028

The Residential Solar Photovoltaic (PV) systems market size is valued to increase USD 13.25 billion, at a CAGR of 4.73% from 2023 to 2028. Favourable government policies for solar power will drive the Residential Solar Photovoltaic (PV) systems market.

Major Market Trends & Insights

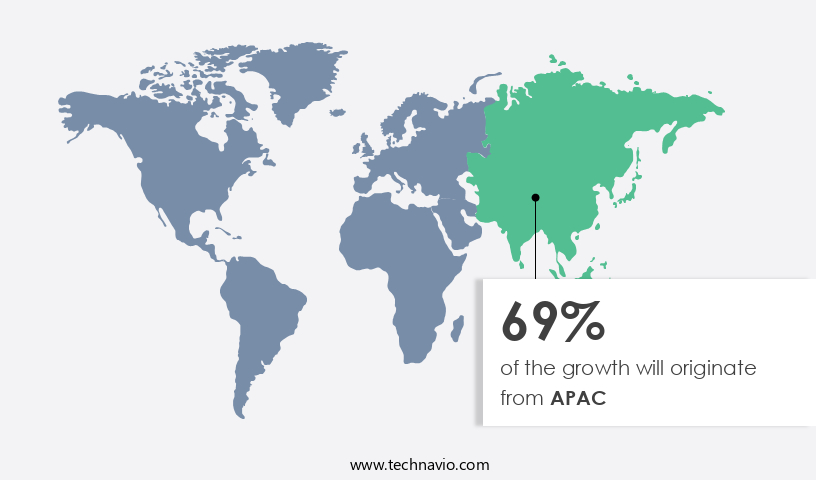
  • APAC dominated the market and accounted for a 69% growth during the forecast period.
  • By Type - On grid segment was valued at USD 41.14 billion in 2022
  • By Technology - Crystalline silicon segment accounted for the largest market revenue share in 2022

Market Size & Forecast

  • Market Opportunities: USD 38.81 million
  • Market Future Opportunities: USD 13250.00 million
  • CAGR : 4.73%
  • APAC: Largest market in 2022

Market Summary

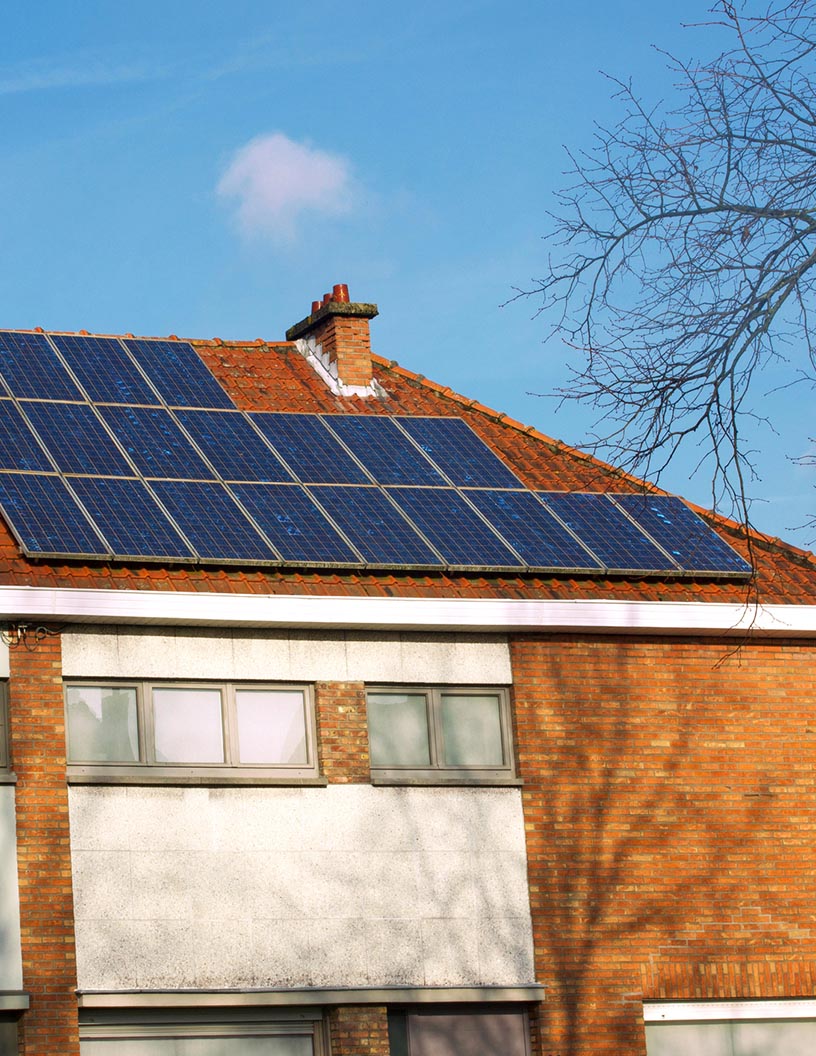
  • The market represents a significant and continually evolving sector in the renewable energy industry. Core technologies, including monocrystalline, polycrystalline, and thin-film solar cells, are driving advancements in the efficiency and affordability of residential solar systems. Applications span from standalone systems for off-grid homes to grid-connected systems for net metering and energy independence. Service types, such as installation, maintenance, and monitoring, are essential components of the market's growth. The increasing adoption of microgrids and the rising number of alternative energy sources contribute to the market's dynamic landscape.
  • Favorable government policies, including incentives and subsidies, continue to fuel the market's expansion. For instance, according to the Solar Energy Industries Association, solar accounted for 43% of all new electric generating capacity added in the United States in 2020. These trends and more highlight the market's continuous evolution and the opportunities and challenges shaping its future.

What will be the Size of the Residential Solar Photovoltaic (PV) Systems Market during the forecast period?

Residential Solar Photovoltaic (Pv) Systems Market Size

Get Key Insights on Market Forecast (PDF) Request Free Sample

How is the Residential Solar Photovoltaic (PV) Systems Market Segmented and what are the key trends of market segmentation?

The Residential Solar Photovoltaic (PV) systems industry research report provides comprehensive data (region-wise segment analysis), with forecasts and estimates in "USD million" for the period 2024-2028, as well as historical data from 2018-2022 for the following segments.

  • Type
    • On grid
    • Off grid
  • Technology
    • Crystalline silicon
    • Thin film
  • Geography
    • North America
      • US
    • Europe
      • Germany
      • UK
    • APAC
      • China
      • India
    • Rest of World (ROW)

By Type Insights

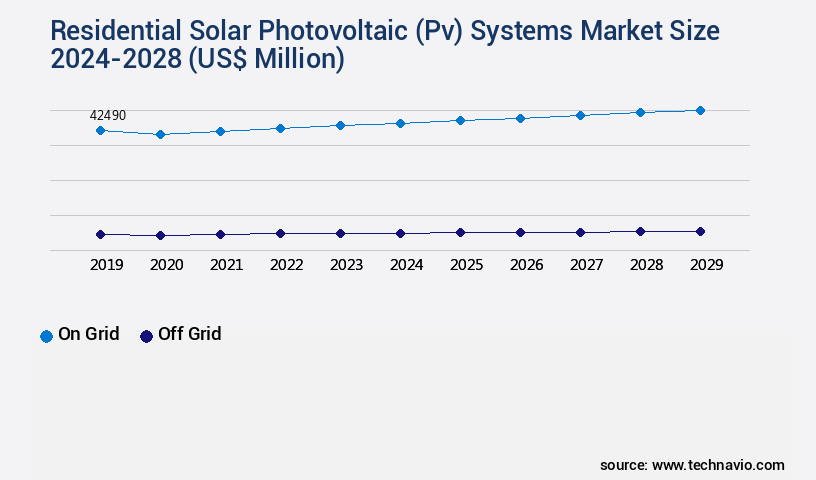
The on grid segment is estimated to witness significant growth during the forecast period.

The market is witnessing significant growth as homeowners seek to reduce energy consumption and costs. According to recent studies, the adoption of solar PV systems in residential applications has risen by approximately 18%, with an estimated 2 million households in the US now utilizing solar energy. Looking ahead, industry experts anticipate a continued expansion, with expectations of a 25% increase in the number of solar installations over the next five years. Key components of these systems include solar irradiance modeling for optimal panel placement, NEC compliance for electrical safety, and solar panel degradation analysis for predictive maintenance.

String inverters, system performance monitoring, and PV system design ensure efficient energy conversion and capacity factor optimization. Demand-side management and grid integration enable the systems to balance power consumption and supply, while electrical safety standards and rooftop solar installation processes maintain regulatory compliance. Crystalline silicon remains the dominant solar panel technology, with high efficiency and reliability. Charge controllers and PV module testing ensure optimal performance, while solar array sizing and load balancing maintain system efficiency. Smart grid integration and energy storage systems, including battery storage capacity, provide additional benefits by storing excess energy for later use. Photovoltaic cells, system lifetime, and power electronic converters contribute to the overall system efficiency and performance.

Shading analysis and thin-film solar cells cater to specific application requirements, while solar energy harvesting and remote monitoring systems enable real-time system performance tracking. Performance ratios, dc-ac conversion, and energy consumption monitoring provide valuable insights into system efficiency and cost savings. Inverter technology plays a crucial role in converting DC power from solar panels to AC power for use in homes. Energy yield prediction models help homeowners optimize their energy production and consumption, ultimately reducing their reliance on traditional power sources.

Residential Solar Photovoltaic (Pv) Systems Market Size

Request Free Sample

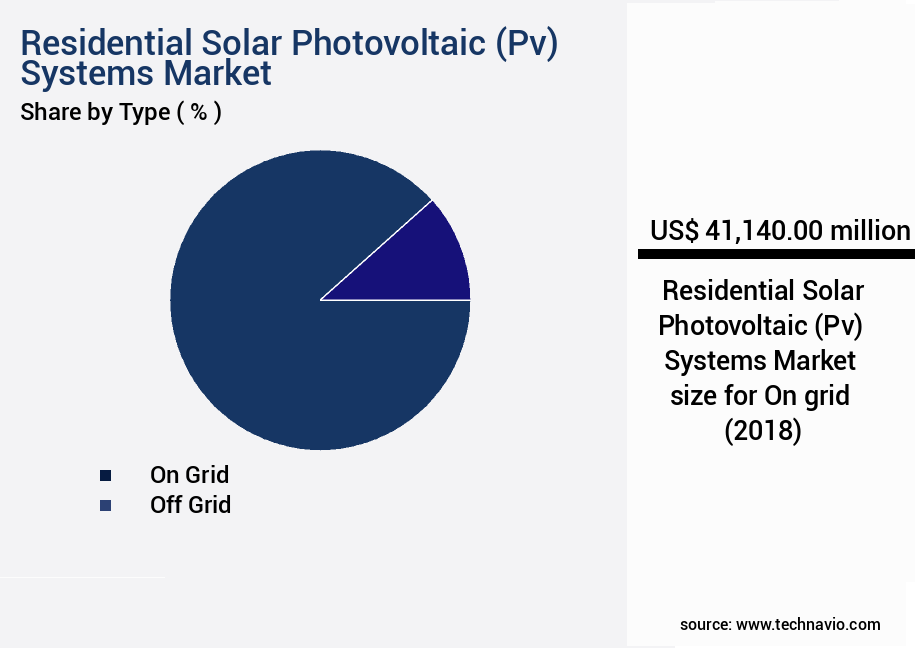
The On grid segment was valued at USD 41.14 billion in 2018 and showed a gradual increase during the forecast period.

Residential Solar Photovoltaic (Pv) Systems Market Size

Request Free Sample

Regional Analysis

APAC is estimated to contribute 69% to the growth of the global market during the forecast period.Technavio's analysts have elaborately explained the regional trends and drivers that shape the market during the forecast period.

Residential Solar Photovoltaic (Pv) Systems Market Share by Geography

See How Residential Solar Photovoltaic (PV) Systems Market Demand is Rising in APAC Request Free Sample

The market in the Asia-Pacific (APAC) region is experiencing substantial growth. In 2023, China, Japan, India, Australia, and South Korea were the major contributors to this expansion. China held over two-thirds of the global cumulative solar PV capacity and over half of Asia's cumulative solar PV capacity. The primary drivers of this growth are financial incentives, such as feed-in-tariffs (FiTs), in countries like China, Japan, Thailand, and Vietnam.

According to the International Energy Agency (IEA), China surpassed the US in annual solar installed capacity in 2023. The APAC residential solar PV systems market has seen rapid growth in recent years, with China leading the global solar power generation.

Market Dynamics

Our researchers analyzed the data with 2023 as the base year, along with the key drivers, trends, and challenges. A holistic analysis of drivers will help companies refine their marketing strategies to gain a competitive advantage.

The market encompasses the design, installation, and maintenance of solar energy solutions for households. This market is characterized by a growing emphasis on optimizing energy consumption and efficiency, with residential solar panel installation cost being a significant consideration for homeowners. The optimal pv system design for home use involves careful evaluation of factors such as shading impact on solar energy generation, comparing microinverters and string inverters, and integrating solar energy with home battery storage. The integration of solar energy with home battery storage is a key trend, with more than 50% of new residential installations incorporating energy storage in 2021.

The impact of temperature on solar panel efficiency and residential solar pv system maintenance procedures are crucial aspects of system performance assessment. Economic viability of rooftop solar energy is a critical factor influencing market growth, with homeowners calculating their solar energy consumption and optimizing energy storage for residential solar systems to maximize savings. Design considerations for residential solar power include evaluating grid-tied residential solar systems, analyzing residential solar energy production data, and adhering to safety regulations. Performance assessment of solar pv systems for homes is essential to ensure efficiency and reliability, with temperature effects and shading being significant performance determinants.

The market is witnessing a shift towards microinverters, with their adoption rates nearly doubling those of string inverters due to their advantages in system performance and flexibility. In conclusion, the market is experiencing robust growth, driven by the increasing economic viability of solar energy and the ongoing trend towards energy storage integration. The market's dynamics are shaped by factors such as optimal system design, performance assessment, and safety regulations. By focusing on these aspects, homeowners can make informed decisions and maximize the benefits of their residential solar installations.

Residential Solar Photovoltaic (Pv) Systems Market Size

What are the key market drivers leading to the rise in the adoption of Residential Solar Photovoltaic (PV) Systems Industry?

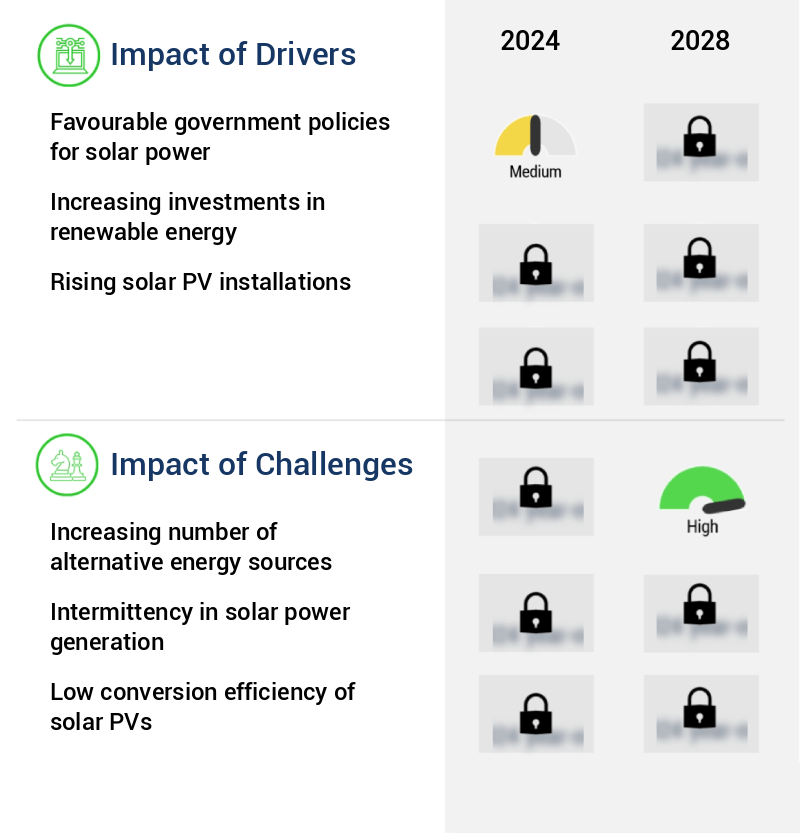
  • Favorable government policies significantly drive the solar power market's growth. These policies include incentives, subsidies, and regulatory frameworks that encourage the adoption and investment in solar energy solutions. 
  • Fossil fuels have long been the dominant energy source for power generation due to their natural abundance. However, the environmental implications of their use, particularly the significant emissions of greenhouse gases (GHG), have become a pressing concern for sustainability. To mitigate these emissions, the adoption of alternative energy sources, including solar photovoltaic (PV), wind power, and hydropower, is increasingly important. Governments worldwide are actively promoting the use of residential solar PV systems through various incentives. In the US, for instance, the solar investment tax credit (ITC) is a key federal policy mechanism that supports the deployment of solar energy.
  • This incentive allows residential and commercial users to deduct 30% of the cost of installing a solar energy system from their federal taxes. The solar industry's growth is a testament to the effectiveness of such policies. According to the Solar Energy Industries Association (SEIA), the US installed over 19.2 GWdc of solar PV capacity in 2020, marking a 43% increase from the previous year. This growth trend is expected to continue, with the SEIA forecasting that the US will reach 100 GW of solar capacity by 2024. The shift towards renewable energy sources is not only environmentally beneficial but also economically viable.
  • Solar energy systems have become increasingly affordable, with the cost of solar electricity dropping by 69% since 2010. This trend is expected to continue, making solar energy an increasingly attractive option for businesses and homeowners alike. In conclusion, the adoption of renewable energy sources, particularly solar PV, is a critical step towards reducing GHG emissions and promoting environmental sustainability. Governments' support through incentives and subsidies has played a significant role in driving the growth of the solar industry, making it an economically viable and increasingly popular choice for power generation.

What are the market trends shaping the Residential Solar Photovoltaic (PV) Systems Industry?

  • The increasing adoption of microgrids represents a significant market trend in the energy sector. This trend signifies a shift towards decentralized energy systems that offer greater resilience and efficiency.
  • Microgrids, small-scale power systems with integrated generation and storage resources, have gained significant importance due to power grid instability in certain regions. Operating independently or collaboratively with other small grids, microgrids can switch between grid-connected and island modes. In island mode, microgrids function autonomously, providing power during main grid outages or intentional disconnections. Microgrids' ability to operate independently makes them essential in areas prone to frequent power outages. The integration of microgrids into the main power grid results in hybrid microgrids, which offer additional benefits.
  • Microgrids' adoption is on the rise, with numerous industries, including healthcare and education, recognizing their value in ensuring power continuity. According to recent studies, the microgrid market is expected to witness substantial growth, with the number of installations increasing significantly. The market's expansion is driven by technological advancements, government initiatives, and the increasing demand for reliable and sustainable power sources.

What challenges does the Residential Solar Photovoltaic (PV) Systems Industry face during its growth?

  • The expansion of alternative energy sources presents a significant challenge to the industry's growth trajectory. With an increasing number of viable options emerging in the renewable energy sector, traditional energy companies must adapt and innovate to remain competitive. This trend poses both opportunities and challenges, requiring strategic planning and investment in research and development to stay ahead of the curve. 
  • The global power generation market remains heavily reliant on fossil fuels, with China, the US, and India leading the growth in wind energy production, according to the International Energy Agency. Despite the expanding renewable energy sector, many countries continue to favor fossil fuels due to their abundance and lower production costs compared to renewable energy. The high expense of establishing renewable energy farms and the inconsistent power output from these sources further hinders their widespread adoption. Moreover, the reduced cost of natural gas has led to an increase in power generation from this source, posing a challenge for solar power electricity generation.
  • The market's dynamics continue to evolve, with ongoing advancements in renewable energy technologies and shifting energy policies influencing the power generation landscape. The preference for fossil fuels remains strong, but the renewable energy sector's growth is expected to persist as countries seek to reduce their carbon footprint and meet energy demands sustainably.

Exclusive Customer Landscape

The Residential Solar Photovoltaic (PV) systems market forecasting report includes the adoption lifecycle of the market, covering from the innovator's stage to the laggard's stage. It focuses on adoption rates in different regions based on penetration. Furthermore, the Residential Solar Photovoltaic (PV) systems market report also includes key purchase criteria and drivers of price sensitivity to help companies evaluate and develop their market growth analysis strategies.

Residential Solar Photovoltaic (Pv) Systems Market Share by Geography

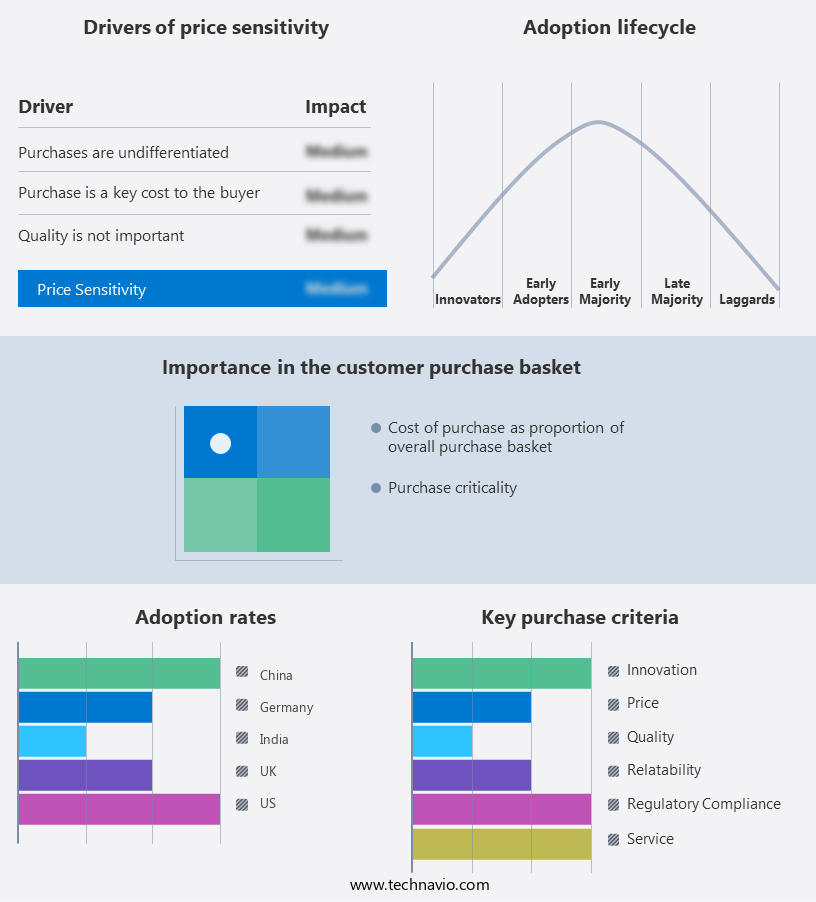
 Customer Landscape of Residential Solar Photovoltaic (PV) Systems Industry

Competitive Landscape & Market Insights

Companies are implementing various strategies, such as strategic alliances, Residential Solar Photovoltaic (PV) systems market forecast, partnerships, mergers and acquisitions, geographical expansion, and product/service launches, to enhance their presence in the industry.

ABB Ltd. - The company specializes in providing advanced Residential Solar Photovoltaic (PV) systems, including the UNO-R and Q CELLS Q.PEAK Duo models. These systems deliver efficient energy solutions for homeowners, contributing significantly to renewable energy adoption and reducing carbon footprints.

The industry research and growth report includes detailed analyses of the competitive landscape of the market and information about key companies, including:

  • ABB Ltd.
  • Canadian Solar Inc.
  • Enphase Energy Inc.
  • Hanwha Corp.
  • Huawei Technologies Co. Ltd.
  • Jiangsu SUMEC Group Co. Ltd.
  • JinkoSolar Holding Co. Ltd.
  • Kyocera Corp.
  • LG Corp.
  • Panasonic Holdings Corp.
  • Reliance Industries Ltd.
  • Schneider Electric SE
  • Sharp Corp.
  • SMA Solar Technology AG
  • SolarEdge Technologies Inc.
  • Sunrun Inc.
  • Tesla Inc.
  • TotalEnergies SE
  • Trina Solar Co. Ltd.
  • Vivint Inc.

Qualitative and quantitative analysis of companies has been conducted to help clients understand the wider business environment as well as the strengths and weaknesses of key industry players. Data is qualitatively analyzed to categorize companies as pure play, category-focused, industry-focused, and diversified; it is quantitatively analyzed to categorize companies as dominant, leading, strong, tentative, and weak.

Recent Development and News in Residential Solar Photovoltaic (PV) Systems Market

  • In January 2024, SunPower Corporation, a leading solar technology company, announced the launch of its Maxeon 4 solar panels, boasting record-breaking efficiency levels of up to 22.8% for residential installations (SunPower Press Release, 2024). This innovation sets a new standard in the residential solar market, promising increased energy production and reduced system sizes.
  • In March 2024, Tesla, Inc. And Panasonic Corporation strengthened their partnership by expanding their solar panel manufacturing collaboration in Buffalo, New York. The joint venture, SolarCity Gigafactory New York, increased its annual production capacity to 1.6 gigawatts (GW) (Tesla Press Release, 2024). This expansion positions Tesla as a major player in the residential solar market, with an enhanced ability to meet growing demand.
  • In May 2024, Sunrun, Inc., the largest residential solar, battery storage, and energy services company in the U.S., closed a USD300 million equity investment round, led by BlackRock Real Assets and the Public Sector Pension Investment Board (Sunrun Press Release, 2024). The funds will support Sunrun's growth initiatives, including expanding its customer base and increasing its solar and battery storage installations.
  • In April 2025, the U.S. Department of Energy (DOE) launched the Solar+ Decade Initiative, a public-private partnership aimed at deploying 100 GW of solar and 40 GW of energy storage by 2030 (DOE Press Release, 2025). This ambitious initiative includes a focus on residential solar systems, providing significant opportunities for market growth and technological advancements.

Dive into Technavio's robust research methodology, blending expert interviews, extensive data synthesis, and validated models for unparalleled Residential Solar Photovoltaic (PV) Systems Market insights. See full methodology.

Market Scope

Report Coverage

Details

Page number

180

Base year

2023

Historic period

2018-2022

Forecast period

2024-2028

Growth momentum & CAGR

Accelerate at a CAGR of 4.73%

Market growth 2024-2028

USD 13250 million

Market structure

Fragmented

YoY growth 2023-2024(%)

4.22

Key countries

China, US, Germany, India, and UK

Competitive landscape

Leading Companies, Market Positioning of Companies, Competitive Strategies, and Industry Risks

Request Free Sample

Research Analyst Overview

  • In the dynamic and evolving residential solar photovolvolic (PV) systems market, various elements continue to shape its landscape. Solar irradiance modeling plays a crucial role in optimizing system performance, ensuring efficient energy harvesting. NEC compliance is a significant consideration in PV system design, ensuring electrical safety and grid integration. Solar panel degradation and efficiency are essential factors influencing system lifetime. String inverters and power electronic converters facilitate dc-ac conversion, enhancing system performance. Capacity factor and demand-side management are critical performance ratios, reflecting the balance between energy production and consumption. System design involves intricacies like solar panel efficiency, shading analysis, and system lifetime.
  • PV module testing and battery storage capacity are integral to energy storage systems, enabling efficient energy management. Smart grid integration and load balancing are essential for optimizing grid interaction and managing energy consumption. Grid integration and electrical safety standards are key focus areas, ensuring seamless interaction between PV systems and the electrical grid. Solar energy harvesting through photovoltaic cells, thin-film solar cells, and crystalline silicon panels continues to advance, driving market growth. Remote monitoring systems facilitate performance analysis, enabling proactive maintenance and enhancing system efficiency. Charge controllers and inverter technology play vital roles in managing energy flow and optimizing system performance.
  • Energy consumption monitoring and energy yield prediction are essential for maximizing the value of solar energy investments. In summary, the residential solar PV systems market is characterized by continuous innovation and evolution, with a focus on optimizing system performance, ensuring grid interaction, and enhancing energy efficiency.

What are the Key Data Covered in this Residential Solar Photovoltaic (PV) Systems Market Research and Growth Report?

  • What is the expected growth of the Residential Solar Photovoltaic (PV) Systems Market between 2024 and 2028?

    • USD 13.25 billion, at a CAGR of 4.73%

  • What segmentation does the market report cover?

    • The report segmented by Type (On grid and Off grid), Technology (Crystalline silicon and Thin film), and Geography (APAC, Europe, North America, Middle East and Africa, and South America)

  • Which regions are analyzed in the report?

    • APAC, Europe, North America, Middle East and Africa, and South America

  • What are the key growth drivers and market challenges?

    • Favourable government policies for solar power, Increasing number of alternative energy sources

  • Who are the major players in the Residential Solar Photovoltaic (PV) Systems Market?

    • Key Companies ABB Ltd., Canadian Solar Inc., Enphase Energy Inc., Hanwha Corp., Huawei Technologies Co. Ltd., Jiangsu SUMEC Group Co. Ltd., JinkoSolar Holding Co. Ltd., Kyocera Corp., LG Corp., Panasonic Holdings Corp., Reliance Industries Ltd., Schneider Electric SE, Sharp Corp., SMA Solar Technology AG, SolarEdge Technologies Inc., Sunrun Inc., Tesla Inc., TotalEnergies SE, Trina Solar Co. Ltd., and Vivint Inc.

Market Research Insights

  • The market continues to expand, with an estimated 3 million installations in the US alone by 2025. This growth is driven by increasing energy efficiency consciousness, declining system costs, and advancements in technology. In 2020, the installed capacity of residential solar PV systems reached 15 GW, up from 10 GW in 2015. Power optimization techniques and system cost optimization have become crucial factors, with energy efficiency metrics such as power factor correction and harmonic distortion reduction playing significant roles. Net metering and feed-in tariffs facilitate the integration of solar energy into the grid, while ground fault protection, overcurrent protection, and lightning protection ensure system safety.
  • Renewable energy credits provide financial incentives, and financing options cater to various consumer budgets. Despite these advancements, challenges remain, including site suitability analysis, grid stability impact, and performance degradation modeling. Solar panel mounting and electrical wiring diagrams are essential considerations for installation, while back-up power systems ensure energy availability during power outages. Carbon footprint reduction, a key motivation for residential solar adoption, is estimated to save approximately 15,000 lbs of CO2 emissions per year per household.

We can help! Our analysts can customize this Residential Solar Photovoltaic (PV) systems market research report to meet your requirements.

Get in touch

1 Executive Summary

  • 1.1 Market overview
    • Executive Summary - Chart on Market Overview
    • Executive Summary - Data Table on Market Overview
    • Executive Summary - Chart on Global Market Characteristics
    • Executive Summary - Chart on Market by Geography
    • Executive Summary - Chart on Market Segmentation by Type
    • Executive Summary - Chart on Market Segmentation by Technology
    • Executive Summary - Chart on Incremental Growth
    • Executive Summary - Data Table on Incremental Growth
    • Executive Summary - Chart on Company Market Positioning

2 Market Landscape

  • 2.1 Market ecosystem
    • Parent Market
    • Data Table on - Parent Market
  • 2.2 Market characteristics
    • Market characteristics analysis
  • 2.3 Value chain analysis
    • Value Chain Analysis

3 Market Sizing

  • 3.1 Market definition
    • Offerings of companies included in the market definition
  • 3.2 Market segment analysis
    • Market segments
  • 3.3 Market size 2023
    • 3.4 Market outlook: Forecast for 2023-2028
      • Chart on Global - Market size and forecast 2023-2028 ($ million)
      • Data Table on Global - Market size and forecast 2023-2028 ($ million)
      • Chart on Global Market: Year-over-year growth 2023-2028 (%)
      • Data Table on Global Market: Year-over-year growth 2023-2028 (%)

    4 Historic Market Size

    • 4.1 Global Residential Solar Photovoltaic (PV) Systems Market 2018 - 2022
      • Historic Market Size - Data Table on Global Residential Solar Photovoltaic (PV) Systems Market 2018 - 2022 ($ million)
    • 4.2 Type segment analysis 2018 - 2022
      • Historic Market Size - Type Segment 2018 - 2022 ($ million)
    • 4.3 Technology segment analysis 2018 - 2022
      • Historic Market Size - Technology Segment 2018 - 2022 ($ million)
    • 4.4 Geography segment analysis 2018 - 2022
      • Historic Market Size - Geography Segment 2018 - 2022 ($ million)
    • 4.5 Country segment analysis 2018 - 2022
      • Historic Market Size - Country Segment 2018 - 2022 ($ million)

    5 Five Forces Analysis

    • 5.1 Five forces summary
      • Five forces analysis - Comparison between 2023 and 2028
    • 5.2 Bargaining power of buyers
      • Bargaining power of buyers - Impact of key factors 2023 and 2028
    • 5.3 Bargaining power of suppliers
      • Bargaining power of suppliers - Impact of key factors in 2023 and 2028
    • 5.4 Threat of new entrants
      • Threat of new entrants - Impact of key factors in 2023 and 2028
    • 5.5 Threat of substitutes
      • Threat of substitutes - Impact of key factors in 2023 and 2028
    • 5.6 Threat of rivalry
      • Threat of rivalry - Impact of key factors in 2023 and 2028
    • 5.7 Market condition
      • Chart on Market condition - Five forces 2023 and 2028

    6 Market Segmentation by Type

    • 6.1 Market segments
      • Chart on Type - Market share 2023-2028 (%)
      • Data Table on Type - Market share 2023-2028 (%)
    • 6.2 Comparison by Type
      • Chart on Comparison by Type
      • Data Table on Comparison by Type
    • 6.3 On grid - Market size and forecast 2023-2028
      • Chart on On grid - Market size and forecast 2023-2028 ($ million)
      • Data Table on On grid - Market size and forecast 2023-2028 ($ million)
      • Chart on On grid - Year-over-year growth 2023-2028 (%)
      • Data Table on On grid - Year-over-year growth 2023-2028 (%)
    • 6.4 Off grid - Market size and forecast 2023-2028
      • Chart on Off grid - Market size and forecast 2023-2028 ($ million)
      • Data Table on Off grid - Market size and forecast 2023-2028 ($ million)
      • Chart on Off grid - Year-over-year growth 2023-2028 (%)
      • Data Table on Off grid - Year-over-year growth 2023-2028 (%)
    • 6.5 Market opportunity by Type
      • Market opportunity by Type ($ million)
      • Data Table on Market opportunity by Type ($ million)

    7 Market Segmentation by Technology

    • 7.1 Market segments
      • Chart on Technology - Market share 2023-2028 (%)
      • Data Table on Technology - Market share 2023-2028 (%)
    • 7.2 Comparison by Technology
      • Chart on Comparison by Technology
      • Data Table on Comparison by Technology
    • 7.3 Crystalline silicon - Market size and forecast 2023-2028
      • Chart on Crystalline silicon - Market size and forecast 2023-2028 ($ million)
      • Data Table on Crystalline silicon - Market size and forecast 2023-2028 ($ million)
      • Chart on Crystalline silicon - Year-over-year growth 2023-2028 (%)
      • Data Table on Crystalline silicon - Year-over-year growth 2023-2028 (%)
    • 7.4 Thin film - Market size and forecast 2023-2028
      • Chart on Thin film - Market size and forecast 2023-2028 ($ million)
      • Data Table on Thin film - Market size and forecast 2023-2028 ($ million)
      • Chart on Thin film - Year-over-year growth 2023-2028 (%)
      • Data Table on Thin film - Year-over-year growth 2023-2028 (%)
    • 7.5 Market opportunity by Technology
      • Market opportunity by Technology ($ million)
      • Data Table on Market opportunity by Technology ($ million)

    8 Customer Landscape

    • 8.1 Customer landscape overview
      • Analysis of price sensitivity, lifecycle, customer purchase basket, adoption rates, and purchase criteria

    9 Geographic Landscape

    • 9.1 Geographic segmentation
      • Chart on Market share by geography 2023-2028 (%)
      • Data Table on Market share by geography 2023-2028 (%)
    • 9.2 Geographic comparison
      • Chart on Geographic comparison
      • Data Table on Geographic comparison
    • 9.3 APAC - Market size and forecast 2023-2028
      • Chart on APAC - Market size and forecast 2023-2028 ($ million)
      • Data Table on APAC - Market size and forecast 2023-2028 ($ million)
      • Chart on APAC - Year-over-year growth 2023-2028 (%)
      • Data Table on APAC - Year-over-year growth 2023-2028 (%)
    • 9.4 Europe - Market size and forecast 2023-2028
      • Chart on Europe - Market size and forecast 2023-2028 ($ million)
      • Data Table on Europe - Market size and forecast 2023-2028 ($ million)
      • Chart on Europe - Year-over-year growth 2023-2028 (%)
      • Data Table on Europe - Year-over-year growth 2023-2028 (%)
    • 9.5 North America - Market size and forecast 2023-2028
      • Chart on North America - Market size and forecast 2023-2028 ($ million)
      • Data Table on North America - Market size and forecast 2023-2028 ($ million)
      • Chart on North America - Year-over-year growth 2023-2028 (%)
      • Data Table on North America - Year-over-year growth 2023-2028 (%)
    • 9.6 Middle East and Africa - Market size and forecast 2023-2028
      • Chart on Middle East and Africa - Market size and forecast 2023-2028 ($ million)
      • Data Table on Middle East and Africa - Market size and forecast 2023-2028 ($ million)
      • Chart on Middle East and Africa - Year-over-year growth 2023-2028 (%)
      • Data Table on Middle East and Africa - Year-over-year growth 2023-2028 (%)
    • 9.7 South America - Market size and forecast 2023-2028
      • Chart on South America - Market size and forecast 2023-2028 ($ million)
      • Data Table on South America - Market size and forecast 2023-2028 ($ million)
      • Chart on South America - Year-over-year growth 2023-2028 (%)
      • Data Table on South America - Year-over-year growth 2023-2028 (%)
    • 9.8 China - Market size and forecast 2023-2028
      • Chart on China - Market size and forecast 2023-2028 ($ million)
      • Data Table on China - Market size and forecast 2023-2028 ($ million)
      • Chart on China - Year-over-year growth 2023-2028 (%)
      • Data Table on China - Year-over-year growth 2023-2028 (%)
    • 9.9 US - Market size and forecast 2023-2028
      • Chart on US - Market size and forecast 2023-2028 ($ million)
      • Data Table on US - Market size and forecast 2023-2028 ($ million)
      • Chart on US - Year-over-year growth 2023-2028 (%)
      • Data Table on US - Year-over-year growth 2023-2028 (%)
    • 9.10 Germany - Market size and forecast 2023-2028
      • Chart on Germany - Market size and forecast 2023-2028 ($ million)
      • Data Table on Germany - Market size and forecast 2023-2028 ($ million)
      • Chart on Germany - Year-over-year growth 2023-2028 (%)
      • Data Table on Germany - Year-over-year growth 2023-2028 (%)
    • 9.11 India - Market size and forecast 2023-2028
      • Chart on India - Market size and forecast 2023-2028 ($ million)
      • Data Table on India - Market size and forecast 2023-2028 ($ million)
      • Chart on India - Year-over-year growth 2023-2028 (%)
      • Data Table on India - Year-over-year growth 2023-2028 (%)
    • 9.12 UK - Market size and forecast 2023-2028
      • Chart on UK - Market size and forecast 2023-2028 ($ million)
      • Data Table on UK - Market size and forecast 2023-2028 ($ million)
      • Chart on UK - Year-over-year growth 2023-2028 (%)
      • Data Table on UK - Year-over-year growth 2023-2028 (%)
    • 9.13 Market opportunity by geography
      • Market opportunity by geography ($ million)
      • Data Tables on Market opportunity by geography ($ million)

    10 Drivers, Challenges, and Opportunity/Restraints

    • 10.1 Market drivers
      • 10.2 Market challenges
        • 10.3 Impact of drivers and challenges
          • Impact of drivers and challenges in 2023 and 2028
        • 10.4 Market opportunities/restraints

          11 Competitive Landscape

          • 11.1 Overview
            • 11.2 Competitive Landscape
              • Overview on criticality of inputs and factors of differentiation
            • 11.3 Landscape disruption
              • Overview on factors of disruption
            • 11.4 Industry risks
              • Impact of key risks on business

            12 Competitive Analysis

            • 12.1 Companies profiled
              • Companies covered
            • 12.2 Market positioning of companies
              • Matrix on companies position and classification
            • 12.3 ABB Ltd.
              • ABB Ltd. - Overview
              • ABB Ltd. - Business segments
              • ABB Ltd. - Key news
              • ABB Ltd. - Key offerings
              • ABB Ltd. - Segment focus
            • 12.4 Canadian Solar Inc.
              • Canadian Solar Inc. - Overview
              • Canadian Solar Inc. - Business segments
              • Canadian Solar Inc. - Key news
              • Canadian Solar Inc. - Key offerings
              • Canadian Solar Inc. - Segment focus
            • 12.5 Enphase Energy Inc.
              • Enphase Energy Inc. - Overview
              • Enphase Energy Inc. - Product / Service
              • Enphase Energy Inc. - Key news
              • Enphase Energy Inc. - Key offerings
            • 12.6 Hanwha Corp.
              • Hanwha Corp. - Overview
              • Hanwha Corp. - Product / Service
              • Hanwha Corp. - Key news
              • Hanwha Corp. - Key offerings
            • 12.7 JinkoSolar Holding Co. Ltd.
              • JinkoSolar Holding Co. Ltd. - Overview
              • JinkoSolar Holding Co. Ltd. - Product / Service
              • JinkoSolar Holding Co. Ltd. - Key news
              • JinkoSolar Holding Co. Ltd. - Key offerings
            • 12.8 Kyocera Corp.
              • Kyocera Corp. - Overview
              • Kyocera Corp. - Business segments
              • Kyocera Corp. - Key news
              • Kyocera Corp. - Key offerings
              • Kyocera Corp. - Segment focus
            • 12.9 LG Corp.
              • LG Corp. - Overview
              • LG Corp. - Business segments
              • LG Corp. - Key news
              • LG Corp. - Key offerings
              • LG Corp. - Segment focus
            • 12.10 Panasonic Holdings Corp.
              • Panasonic Holdings Corp. - Overview
              • Panasonic Holdings Corp. - Product / Service
              • Panasonic Holdings Corp. - Key news
              • Panasonic Holdings Corp. - Key offerings
            • 12.11 Schneider Electric SE
              • Schneider Electric SE - Overview
              • Schneider Electric SE - Business segments
              • Schneider Electric SE - Key news
              • Schneider Electric SE - Key offerings
              • Schneider Electric SE - Segment focus
            • 12.12 Sharp Corp.
              • Sharp Corp. - Overview
              • Sharp Corp. - Business segments
              • Sharp Corp. - Key news
              • Sharp Corp. - Key offerings
              • Sharp Corp. - Segment focus
            • 12.13 Sunrun Inc.
              • Sunrun Inc. - Overview
              • Sunrun Inc. - Product / Service
              • Sunrun Inc. - Key offerings
            • 12.14 Tesla Inc.
              • Tesla Inc. - Overview
              • Tesla Inc. - Business segments
              • Tesla Inc. - Key news
              • Tesla Inc. - Key offerings
              • Tesla Inc. - Segment focus
            • 12.15 TotalEnergies SE
              • TotalEnergies SE - Overview
              • TotalEnergies SE - Business segments
              • TotalEnergies SE - Key news
              • TotalEnergies SE - Key offerings
              • TotalEnergies SE - Segment focus
            • 12.16 Trina Solar Co. Ltd.
              • Trina Solar Co. Ltd. - Overview
              • Trina Solar Co. Ltd. - Product / Service
              • Trina Solar Co. Ltd. - Key news
              • Trina Solar Co. Ltd. - Key offerings
            • 12.17 Vivint Inc.
              • Vivint Inc. - Overview
              • Vivint Inc. - Product / Service
              • Vivint Inc. - Key offerings

            13 Appendix

            • 13.1 Scope of the report
              • 13.2 Inclusions and exclusions checklist
                • Inclusions checklist
                • Exclusions checklist
              • 13.3 Currency conversion rates for US$
                • Currency conversion rates for US$
              • 13.4 Research methodology
                • Research methodology
              • 13.5 Data procurement
                • Information sources
              • 13.6 Data validation
                • Data validation
              • 13.7 Validation techniques employed for market sizing
                • Validation techniques employed for market sizing
              • 13.8 Data synthesis
                • Data synthesis
              • 13.9 360 degree market analysis
                • 360 degree market analysis
              • 13.10 List of abbreviations
                • List of abbreviations

              Research Methodology

              Technavio presents a detailed picture of the market by way of study, synthesis, and summation of data from multiple sources. The analysts have presented the various facets of the market with a particular focus on identifying the key industry influencers. The data thus presented is comprehensive, reliable, and the result of extensive research, both primary and secondary.

              INFORMATION SOURCES

              Primary sources

              • Manufacturers and suppliers
              • Channel partners
              • Industry experts
              • Strategic decision makers

              Secondary sources

              • Industry journals and periodicals
              • Government data
              • Financial reports of key industry players
              • Historical data
              • Press releases

              DATA ANALYSIS

              Data Synthesis

              • Collation of data
              • Estimation of key figures
              • Analysis of derived insights

              Data Validation

              • Triangulation with data models
              • Reference against proprietary databases
              • Corroboration with industry experts

              REPORT WRITING

              Qualitative

              • Market drivers
              • Market challenges
              • Market trends
              • Five forces analysis

              Quantitative

              • Market size and forecast
              • Market segmentation
              • Geographical insights
              • Competitive landscape

              Interested in this report?

              Get your sample now to see our research methodology and insights!

              Download Now

              Frequently Asked Questions

              Residential Solar Photovoltaic (Pv) Systems market growth will increase by $ 13250 mn during 2024-2028 .

              The Residential Solar Photovoltaic (Pv) Systems market is expected to grow at a CAGR of 4.73% during 2024-2028 .

              Residential Solar Photovoltaic (Pv) Systems market is segmented by Type( On grid, Off grid) Technology( Crystalline silicon, Thin film, North America, MEA, South America)

              ABB Ltd., Canadian Solar Inc., Enphase Energy Inc., Hanwha Corp., Huawei Technologies Co. Ltd., Jiangsu SUMEC Group Co. Ltd., JinkoSolar Holding Co. Ltd., Kyocera Corp., LG Corp., Panasonic Holdings Corp., Reliance Industries Ltd., Schneider Electric SE, Sharp Corp., SMA Solar Technology AG, SolarEdge Technologies Inc., Sunrun Inc., Tesla Inc., TotalEnergies SE, Trina Solar Co. Ltd., Vivint Inc. are a few of the key vendors in the Residential Solar Photovoltaic (Pv) Systems market.

              APAC will register the highest growth rate of 69% among the other regions. Therefore, the Residential Solar Photovoltaic (Pv) Systems market in APAC is expected to garner significant business opportunities for the vendors during the forecast period.

              China, US, Germany, India, UK

              • Favourable government policies for solar powerFossil fuels are the most widely used sources of power generation due to their natural abundance. However is the driving factor this market.
              • GHG emissions from fossil fuels are significant challenges to environmental sustainability. The use of alternative energy sources is the driving factor this market.
              • such as solar PV is the driving factor this market.
              • wind power is the driving factor this market.
              • and hydropower is the driving factor this market.
              • is necessary to reduce emissions. Governments across the world support the adoption of residential solar PV systems through subsidies is the driving factor this market.
              • tax benefits is the driving factor this market.
              • and incentives to consumers and producers. In the US is the driving factor this market.
              • the solar investment tax credit (ITC) is an important federal policy mechanism that supports the deployment of solar energy in the country. The ITC allows residential and commercial users to deduct 30% of the cost of installing a solar energy system from their federal taxes. Annual solar installations in the US grew by over 16 times after the implementation of the ITC in 2006. The continuation of the policy will encourage manufacturing companies to invest in R and D to develop cheaper and more reliable technology to bring down the cost of residential solar PV systems. Section 48 of the ITC policy states that any business that installs is the driving factor this market.
              • develops is the driving factor this market.
              • or finances a solar project can claim the credit. Many other countries worldwide are formulating policies to promote the development of solar power technologies. One such notable example is the feed-in-tariff (FiT) policy is the driving factor this market.
              • formulated to encourage investments in technologies related to renewable energy. This policy covers various aspects of the solar energy industry is the driving factor this market.
              • including the reduction of solar radiation is the driving factor this market.
              • eligibility criteria is the driving factor this market.
              • bonuses is the driving factor this market.
              • and various other grants. Governments are also introducing separate policies for different types of solar PV installations is the driving factor this market.
              • such as installations on buildings is the driving factor this market.
              • roof-mounted installations is the driving factor this market.
              • and the installation of freestanding facilities.Globally is the driving factor this market.
              • several countries is the driving factor this market.
              • including the US is the driving factor this market.
              • China is the driving factor this market.
              • the UK is the driving factor this market.
              • and Germany is the driving factor this market.
              • are taking cognizance of the depletion of fossil fuel resources and the associated carbon emission regulations. Therefore is the driving factor this market.
              • they are gradually moving toward renewable energy to achieve their carbon emission targets and reduce their dependence on fossil fuels. Many end-users have started adopting alternative forms of energy and are slowly discarding fossil fuel-based power generation. Renewable energy forms such as wind power and solar power are gaining popularity among all categories of electricity end-users. Governments in various other countries is the driving factor this market.
              • such as China and Germany is the driving factor this market.
              • are also providing incentives for solar energy projects. This has encouraged many investors to invest in solar PV projects is the driving factor this market.
              • which is expected to drive the growth of the global residential solar PV systems market during the forecast period. is the driving factor this market.

              The Residential Solar Photovoltaic (Pv) Systems market vendors should focus on grabbing business opportunities from the On grid segment as it accounted for the largest market share in the base year.