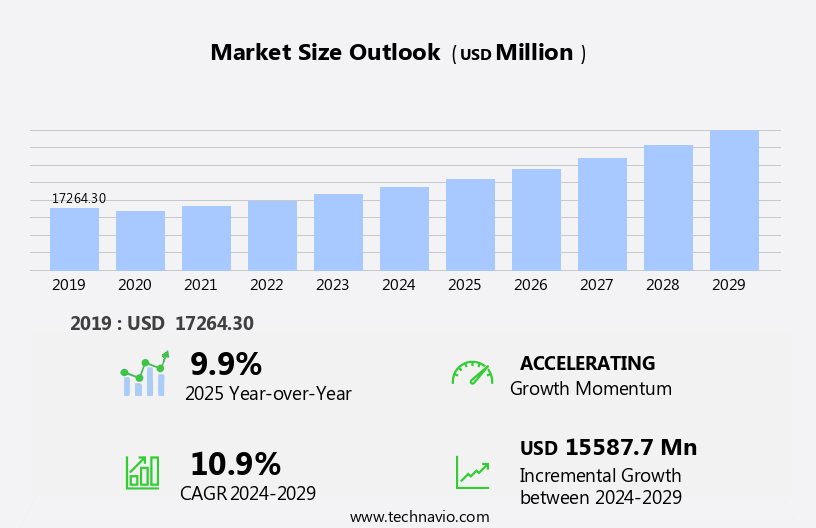
Residential Water Purifier Market Size and Forecast 2025-2029
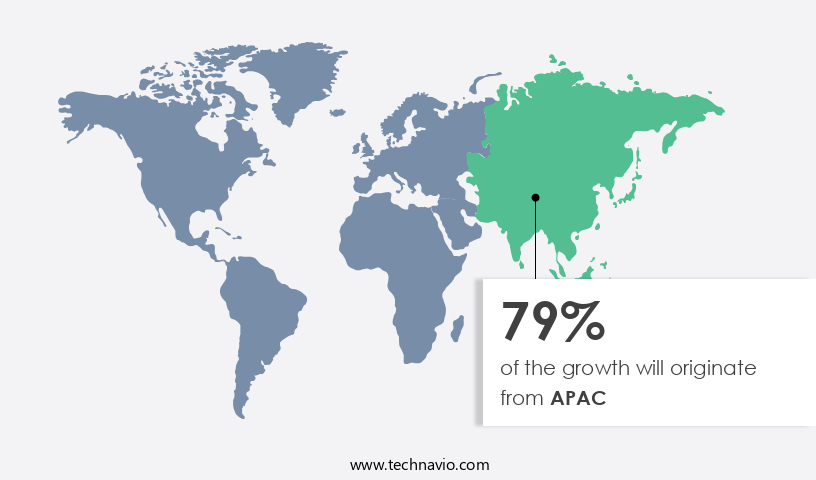
The residential water purifier market size estimates the market to reach by USD 15.59 billion, at a CAGR of 10.9% between 2024 and 2029. APAC is expected to account for 79% of the growth contribution to the global market during this period. In 2019 the online retail segment was valued at USD 14.5 billion and has demonstrated steady growth since then.
Report Coverage
|
Details
|
Base year
|
2024
|
Historic period
|
2019-2023 |
Forecast period
|
2025-2029
|
Market structure |
Fragmented |
Market growth 2025-2029
|
USD 15587.7 million
|
- The market is driven by the growing trend towards online and omnichannel retailing, which offers convenience and accessibility to consumers. This shift in purchasing behavior is expected to boost market growth, as more consumers opt for the ease and convenience of buying water purifiers from the comfort of their homes. Additionally, product innovations with a focus on technological advancements continue to shape the market, as companies introduce smart and connected water purifiers that offer advanced filtration technologies and real-time monitoring capabilities. Furthermore, the easy availability of packaged drinking water has led to an increasing awareness of water quality and health concerns, creating a strong demand for residential water purifiers.
- However, challenges persist in the form of high upfront costs and the need for regular maintenance and replacement of filters, which may deter some consumers. Companies seeking to capitalize on market opportunities should focus on offering affordable financing options and developing low-maintenance, long-lasting filters to address these challenges effectively. Overall, the market presents significant growth potential, with companies that prioritize innovation, affordability, and customer convenience poised to succeed in this dynamic market.
What will be the Size of the Residential Water Purifier Market during the forecast period?

Request Free Sample
The market continues to evolve, driven by the increasing awareness of water quality and health concerns. Post-filtration quality is a critical factor, with consumers seeking advanced technologies such as ultrafiltration and nanofiltration to ensure superior water purity. Water hardness reduction through ion exchange processes and water softener resins remains a popular application, particularly in areas with high mineral content. Technological advancements continue to unfold, with innovations like pressure gauge sensors and automatic flushing systems enhancing system performance and user experience. Membrane fouling control and flow rate adjustment are essential components of modern water filtration systems, ensuring consistent water quality and efficient operation.
The industry growth is robust, with expectations of over 10% annual expansion. For instance, a leading water filtration company reported a 15% increase in sales due to the growing demand for advanced water purification systems. The market encompasses various filtration stages, including pre-filtration, chlorine removal, alkaline water, and UV disinfection. Effective pre-filtration through sediment pre-filters and carbon block filters is crucial for maintaining the longevity of the system and reducing turbidity. Scale prevention systems and water pressure regulators ensure system longevity and optimal performance. UV lamp lifespan and filter cartridge replacement schedules are essential considerations for system maintenance. Activated carbon adsorption and reverse osmosis membranes are key technologies in water purification, addressing total dissolved solids and removing contaminants.
Nanofiltration technology offers an additional layer of purification, targeting smaller particles and ions. Water quality testing is a continuous process, ensuring the effectiveness of various filtration stages and maintaining consumer confidence in their water purification systems. Overall, the market is a dynamic and evolving sector, driven by consumer demand for superior water quality and advanced filtration technologies.
How is this Residential Water Purifier Industry segmented?
The residential water purifier industry research report provides comprehensive data (region-wise segment analysis), with forecasts and estimates in "USD million" for the period 2025-2029, as well as historical data from 2019-2023 for the following segments.
- Distribution Channel
- Online Retail
- Specialty Stores
- Direct Sales
- Product
- Multiple technology-based water purifier
- RO water purifier
- UV water purifier
- Gravity-based water purifier
- Application
- Technology Specificity
- Reverse Osmosis
- UV Purification
- Activated Carbon
- Geography
- North America
- Europe
- Middle East and Africa
- APAC
- China
- India
- Japan
- South Korea
- South America
- Rest of World (ROW)
By Distribution Channel Insights
The online retail segment is estimated to witness significant growth during the forecast period.
In the market, post-filtration quality plays a pivotal role in consumer satisfaction. To address water hardness, advanced technologies such as ion exchange and water softener resin are employed. Pressure gauge sensors ensure optimal system performance, while ultrafiltration processes effectively reduce turbidity and sediment. Ultraviolet disinfection ensures water safety, and membrane fouling control maintains consistent flow rates. Carbon block filters effectively remove chlorine, while alkaline water filters add minerals. Reverse osmosis membranes reduce total dissolved solids, and nanofiltration technology refines water further. Pre-filtration effectiveness is crucial, with sediment pre-filters extending the life of more expensive filters. System maintenance schedules, including filter cartridge replacement and automatic flushing systems, ensure long-term functionality.
Activated carbon adsorption is a key aspect of water purification stages. Scale prevention systems mitigate mineral buildup, and ph level adjustment caters to individual water needs. Despite the offline distribution channel's decline due to online shopping trends, companies are adapting by partnering with local retailers. Haier Smart Home, for instance, has seen success by establishing enterprise clubs to maintain relationships with regional distributors. These strategies enable proper product showcasing and market analysis, ultimately catering to region-specific demands. According to industry reports, the market is expected to grow by 10% annually, driven by increasing consumer awareness and demand for clean water.

Request Free Sample
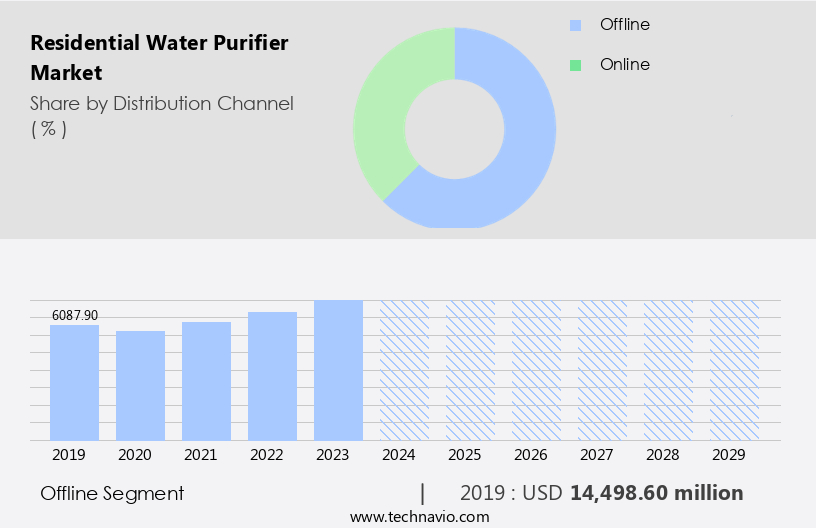
As of 2019 the Online Retail segment estimated at USD 14.5 billion, and it is forecast to see a moderate upward trend through the forecast period.
Regional Analysis
During the forecast period, APAC is projected to contribute 79% to the overall growth of the global market. Technavio's analysts have elaborately explained the regional trends and drivers that shape the market during the forecast period.

Request Free Sample
The market in Asia Pacific (APAC) is experiencing substantial growth due to increasing health consciousness and rising incidents of waterborne diseases. In India, the economic cost of water-borne diseases is estimated to be USD600 million annually. This has led to a significant demand for residential water purifiers among the middle-class population in countries like China, India, South Korea, Australia, New Zealand, Vietnam, and the Philippines. Post-filtration quality is a crucial factor driving market growth. Technologically advanced water filtration systems employ various processes such as ultrafiltration, ion exchange, and reverse osmosis to ensure high-quality water. For instance, ultrafiltration processes can reduce turbidity and sediment, while ion exchange systems can effectively reduce water hardness.
Moreover, water filtration systems incorporate features like pressure gauge sensors, flow rate control, and automatic flushing systems for optimal performance. Carbon block filters and sediment pre-filters ensure pre-filtration effectiveness, while chlorine removal filters and alkaline water filters cater to specific water quality requirements. System maintenance schedules, including filter cartridge replacement and membrane fouling control, ensure the longevity of these systems. Activated carbon adsorption and UV disinfection further enhance water purification stages, preventing bacterial growth and ensuring safe drinking water. The market in APAC is expected to grow by over 10% in the coming years, as consumers prioritize health and sanitation.
This growth is fueled by advancements in water filtration technology, including nanofiltration and membrane fouling control, which address the challenge of total dissolved solids and mineralization filters that cater to consumers seeking mineral-rich water.
Market Dynamics
Our researchers analyzed the data with 2024 as the base year, along with the key drivers, trends, and challenges. A holistic analysis of drivers will help companies refine their marketing strategies to gain a competitive advantage.
The residential water purifier market is advancing with a focus on mineralization filter impact on taste and alkaline water filter health benefits. Key features include total dissolved solids reduction impact and water hardness reduction methods comparison to enhance water quality. Performance is measured through chlorine removal filter effectiveness testing, turbidity reduction methods effectiveness, and ph level adjustment impact on taste. System upkeep involves pressure gauge sensor calibration procedure, reverse osmosis membrane replacement frequency, and ultraviolet disinfection lamp replacement cost. Regular water filter system maintenance procedures and sediment pre-filter cleaning methods ensure longevity. Efficiency is driven by activated carbon filter adsorption rate, nanofiltration technology efficiency comparison, ultrafiltration process optimization techniques, and water softener resin regeneration process. Advanced techniques like ion exchange process efficiency analysis, flow rate control valve specifications, water purification stage optimization, and membrane fouling control strategies are shaping the next generation of home water purification systems.
What are the key market drivers leading to the rise in the adoption of Residential Water Purifier Industry?
- The expansion of online and omnichannel retailing is the primary catalyst fueling market growth. In today's digital age, consumers are increasingly turning to online research before making residential water purifier purchases. This trend, fueled by the growth of e-commerce, allows buyers to compare features and prices of various brands and models. In response, leading companies, such as those in the water purification industry, are investing in enhanced customer experiences. They are improving account and supply chain management strategies, launching informative websites, and utilizing e-commerce platforms to facilitate customer feedback and product reviews. As a result, consumers can make informed decisions based on real-world experiences and preferences.
- For instance, sales of water purifiers with advanced filtration technologies have seen a 25% increase in the last year. The market is projected to grow by over 10% annually, as more households prioritize clean and safe water sources.
What are the market trends shaping the Residential Water Purifier Industry?
- The focus on product innovations with technological advancements is a mandatory trend in the upcoming market. This includes the integration of new technologies to enhance product functionality and user experience.
- In the market, technological innovations are driving competition among prominent companies. For instance, Amway Corp. Has introduced UV-C LED technology in their eSpring Water Purifier, which is a multi-stage purifier utilizing UV technology. This technology, combined with RO and UF filters, ensures water is thoroughly purified and free of contaminants such as germs. The multi-technology-based water purifiers' market growth is attributed to this advanced technology. KENT RO is another company offering a water purifier with RO+UV+UF purification technology. According to a market analysis firm, the market is expected to grow by 15% based on increasing health consciousness and growing awareness about waterborne diseases. Companies are continually investing in research and development to provide consumers with cleaner and healthier water solutions.
What challenges does the Residential Water Purifier Industry face during its growth?
- The scarcity of convenient access to packaged drinking water poses a significant challenge to the expansion of the industry. The market faces significant competition from the widespread availability of packaged drinking water, particularly in suburban areas. This trend decreases the demand for water purifiers as packaged water acts as a convenient and cost-effective substitute for treated water. However, factors such as increasing health consciousness, poor water quality, and changing consumer lifestyles have driven up demand for packaged water in both developed and developing countries.
- For instance, in some regions, packaged water consumption has increased by over 10% in the past five years. The market is projected to grow robustly, with industry analysts estimating that it will expand by more than 15% over the next decade.
Exclusive Customer Landscape
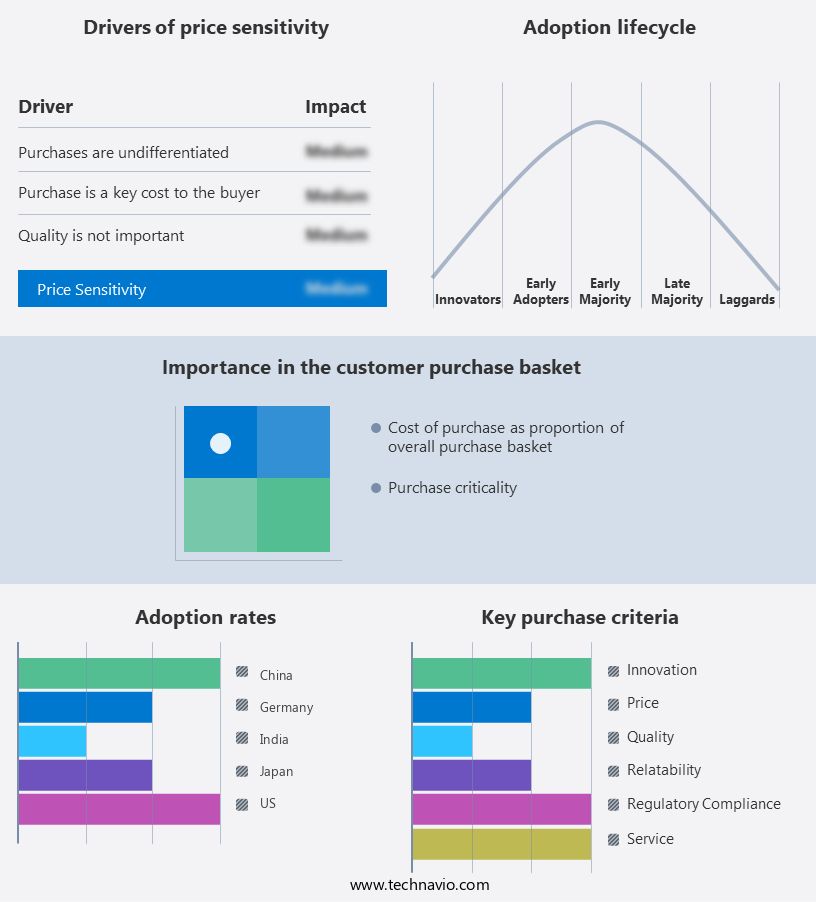
The residential water purifier market forecasting report includes the adoption lifecycle of the market, covering from the innovator's stage to the laggard's stage. It focuses on adoption rates in different regions based on penetration. Furthermore, the residential water purifier market report also includes key purchase criteria and drivers of price sensitivity to help companies evaluate and develop their market growth analysis strategies.

Customer Landscape
Key Companies & Market Insights
Companies are implementing various strategies, such as strategic alliances, residential water purifier market forecast, partnerships, mergers and acquisitions, geographical expansion, and product/service launches, to enhance their presence in the industry.
A. O. Smith Corporation (United States) - The company specializes in providing advanced residential water purification solutions, including the eSpring UV under-counter and above-counter models, and the eSpring faucet diverter kit. These systems utilize UV technology to effectively eliminate bacteria and viruses, ensuring clean, safe water for household use.
The industry research and growth report includes detailed analyses of the competitive landscape of the market and information about key companies, including:
- A. O. Smith Corporation (United States)
- Pentair plc (United Kingdom)
- Brita GmbH (Germany)
- Eureka Forbes Ltd. (India)
- Kent RO Systems Ltd. (India)
- Culligan International (United States)
- Coway Co., Ltd. (South Korea)
- Panasonic Corporation (Japan)
- LG Electronics (South Korea)
- Unilever PLC (United Kingdom)
- 3M Company (United States)
- Aquasana Inc. (United States)
- Blue Star Limited (India)
- Whirlpool Corporation (United States)
- Philips (Netherlands)
- Tata Chemicals Ltd. (India)
- Livpure Pvt. Ltd. (India)
- EcoWater Systems LLC (United States)
- Katadyn Group (Switzerland)
- HUL Pureit (India)
Qualitative and quantitative analysis of companies has been conducted to help clients understand the wider business environment as well as the strengths and weaknesses of key industry players. Data is qualitatively analyzed to categorize companies as pure play, category-focused, industry-focused, and diversified; it is quantitatively analyzed to categorize companies as dominant, leading, strong, tentative, and weak.
Recent Development and News in Residential Water Purifier Market
- In January 2024, Waterdrop, a leading water filtration company, announced the launch of its new residential reverse osmosis water purifier, the RO-C01, designed to address the growing demand for advanced water filtration systems in the US market (Waterdrop Press Release, 2024).
- In March 2024, Ecowater Technologies, a global leader in water treatment solutions, entered into a strategic partnership with Home Depot, the largest home improvement retailer in the US, to expand its residential water purifier offerings and strengthen its market presence (Ecowater Technologies Press Release, 2024).
- In April 2025, iSpring Water Systems, a leading provider of water filtration and purification solutions, raised USD15 million in a Series C funding round, led by Sino-Ocean Capital, to accelerate its product development, expand its manufacturing capacity, and enhance its sales and marketing efforts (Crunchbase News, 2025).
- In May 2025, the Indian government announced the 'Harit Pathar Jal Abhiyan' initiative, a nationwide campaign to promote the installation of residential water purifiers in rural areas, aiming to provide clean drinking water to over 300 million people by 2028 (PIB India, 2025).
Research Analyst Overview
- The market continues to evolve, with innovations in technology driving advancements in various sectors. Filter replacement indicators and ph adjustment ranges ensure optimal filter performance and water quality parameters. Ultrafiltration effectiveness and water filter efficiency are critical factors, with membrane cleaning frequency and pressure sensor accuracy essential for maintaining system efficiency. Post-filter contamination and pre-filter clogging rates impact overall purification stage sequence, while ion exchange capacity and chlorine reduction efficiency address specific contaminants. For instance, a leading water purifier manufacturer reported a 20% increase in sales due to the introduction of a filter with enhanced mineral content enhancement and a longer membrane life.
- The market is projected to grow at a significant rate, with industry analysts estimating a 15% increase in demand for water purifiers over the next five years. This growth is attributed to the ongoing focus on improving water quality, with consumers seeking advanced filtration technologies, such as nanofiltration and UV sterilization, to address a wide range of contaminants. Incorporating features like sediment removal capacity, sediment filter density, and flow rate adjustment, these systems cater to diverse water sources and usage patterns. Regular maintenance, including membrane cleaning frequency and UV lamp intensity adjustments, ensures continued system performance and longevity. Pressure regulation range and TDS reduction rate further enhance the system's versatility and effectiveness.
Dive into Technavio's robust research methodology, blending expert interviews, extensive data synthesis, and validated models for unparalleled Residential Water Purifier Market insights. See full methodology.
Residential Water Purifier Market Market Scope
|
Report Coverage
|
Details
|
Page number
|
217
|
Base year
|
2024
|
Historic period
|
2019-2023 |
Forecast period
|
2025-2029
|
Growth momentum & CAGR
|
Accelerate at a CAGR of 10.9%
|
Market growth 2025-2029
|
USD 15587.7 million
|
Market structure
|
Fragmented
|
YoY growth 2024-2025(%)
|
9.9
|
Key countries
|
US, China, Germany, Canada, India, South Korea, France, Japan, Italy, Brazil, UAE, UK, and SpainMexico
|
Competitive landscape
|
Leading Companies, Market Positioning of Companies, Competitive Strategies, and Industry Risks
|
Request Free Sample
What are the Key Data Covered in this Residential Water Purifier Market Research and Growth Report?
- CAGR of the Residential Water Purifier industry during the forecast period
- Detailed information on factors that will drive the growth and forecasting between 2025 and 2029
- Precise estimation of the size of the market and its contribution of the industry in focus to the parent market
- Accurate predictions about upcoming growth and trends and changes in consumer behaviour
- Growth of the market across APAC, Europe, North America, South America, and Middle East and Africa
- Thorough analysis of the market's competitive landscape and detailed information about companies
- Comprehensive analysis of factors that will challenge the residential water purifier market growth of industry companies
We can help! Our analysts can customize this residential water purifier market research report to meet your requirements.
Get in touch
1 Executive Summary
- 1.1 Market overview
- Executive Summary - Chart on Market Overview
- Executive Summary - Data Table on Market Overview
- Executive Summary - Chart on Global Market Characteristics
- Executive Summary - Chart on Market by Geography
- Executive Summary - Chart on Market Segmentation by Distribution Channel
- Executive Summary - Chart on Market Segmentation by Product
- Executive Summary - Chart on Market Segmentation by Application
- Executive Summary - Chart on Incremental Growth
- Executive Summary - Data Table on Incremental Growth
- Executive Summary - Chart on Company Market Positioning
2 Technavio Analysis
- 2.1 Analysis of price sensitivity, lifecycle, customer purchase basket, adoption rates, and purchase criteria
- Analysis of price sensitivity, lifecycle, customer purchase basket, adoption rates, and purchase criteria
- 2.2 Criticality of inputs and Factors of differentiation
- Overview on criticality of inputs and factors of differentiation
- 2.3 Factors of disruption
- Overview on factors of disruption
- 2.4 Impact of drivers and challenges
- Impact of drivers and challenges in 2024 and 2029
3 Market Landscape
- 3.1 Market ecosystem
- Parent Market
- Data Table on - Parent Market
- 3.2 Market characteristics
- Market characteristics analysis
4 Market Sizing
- 4.1 Market definition
- Offerings of companies included in the market definition
- 4.2 Market segment analysis
- 4.4 Market outlook: Forecast for 2024-2029
- Chart on Global - Market size and forecast 2024-2029 ($ million)
- Data Table on Global - Market size and forecast 2024-2029 ($ million)
- Chart on Global Market: Year-over-year growth 2024-2029 (%)
- Data Table on Global Market: Year-over-year growth 2024-2029 (%)
5 Historic Market Size
- 5.1 Global Residential Water Purifier Market 2019 - 2023
- Historic Market Size - Data Table on Global Residential Water Purifier Market 2019 - 2023 ($ million)
- 5.2 Distribution Channel segment analysis 2019 - 2023
- Historic Market Size - Distribution Channel Segment 2019 - 2023 ($ million)
- 5.3 Product segment analysis 2019 - 2023
- Historic Market Size - Product Segment 2019 - 2023 ($ million)
- 5.4 Application segment analysis 2019 - 2023
- Historic Market Size - Application Segment 2019 - 2023 ($ million)
- 5.5 Geography segment analysis 2019 - 2023
- Historic Market Size - Geography Segment 2019 - 2023 ($ million)
- 5.6 Country segment analysis 2019 - 2023
- Historic Market Size - Country Segment 2019 - 2023 ($ million)
6 Qualitative Analysis
- 6.1 Impact of AI on Global Residential Water Purifier Market
7 Five Forces Analysis
- 7.1 Five forces summary
- Five forces analysis - Comparison between 2024 and 2029
- 7.2 Bargaining power of buyers
- Bargaining power of buyers - Impact of key factors 2024 and 2029
- 7.3 Bargaining power of suppliers
- Bargaining power of suppliers - Impact of key factors in 2024 and 2029
- 7.4 Threat of new entrants
- Threat of new entrants - Impact of key factors in 2024 and 2029
- 7.5 Threat of substitutes
- Threat of substitutes - Impact of key factors in 2024 and 2029
- 7.6 Threat of rivalry
- Threat of rivalry - Impact of key factors in 2024 and 2029
- 7.7 Market condition
- Chart on Market condition - Five forces 2024 and 2029
8 Market Segmentation by Distribution Channel
- 8.1 Market segments
- Chart on Distribution Channel - Market share (2024-2029) (%)
- Data Table on Distribution Channel - Market share (2024-2029) (%)
- 8.2 Comparison by Distribution Channel
- Chart on Comparison by Distribution Channel
- Data Table on Comparison by Distribution Channel
- 8.3 Offline - Market size and forecast (2024-2029)
- Chart on Offline - Market size and forecast (2024-2029) ($ million)
- Data Table on Offline - Market size and forecast (2024-2029) ($ million)
- Chart on Offline - Year-over-year growth (2024-2029) (%)
- Data Table on Offline - Year-over-year growth (2024-2029) (%)
- 8.4 Online - Market size and forecast (2024-2029)
- Chart on Online - Market size and forecast (2024-2029) ($ million)
- Data Table on Online - Market size and forecast (2024-2029) ($ million)
- Chart on Online - Year-over-year growth (2024-2029) (%)
- Data Table on Online - Year-over-year growth (2024-2029) (%)
- 8.5 Market opportunity by Distribution Channel
- Market opportunity by Distribution Channel ($ million)
- Data Table on Market opportunity by Distribution Channel ($ million)
9 Market Segmentation by Product
- 9.1 Market segments
- Chart on Product - Market share (2024-2029) (%)
- Data Table on Product - Market share (2024-2029) (%)
- 9.2 Comparison by Product
- Chart on Comparison by Product
- Data Table on Comparison by Product
- 9.3 Multiple technology-based water purifier - Market size and forecast (2024-2029)
- Chart on Multiple technology-based water purifier - Market size and forecast (2024-2029) ($ million)
- Data Table on Multiple technology-based water purifier - Market size and forecast (2024-2029) ($ million)
- Chart on Multiple technology-based water purifier - Year-over-year growth (2024-2029) (%)
- Data Table on Multiple technology-based water purifier - Year-over-year growth (2024-2029) (%)
- 9.4 RO water purifier - Market size and forecast (2024-2029)
- Chart on RO water purifier - Market size and forecast (2024-2029) ($ million)
- Data Table on RO water purifier - Market size and forecast (2024-2029) ($ million)
- Chart on RO water purifier - Year-over-year growth (2024-2029) (%)
- Data Table on RO water purifier - Year-over-year growth (2024-2029) (%)
- 9.5 UV water purifier - Market size and forecast (2024-2029)
- Chart on UV water purifier - Market size and forecast (2024-2029) ($ million)
- Data Table on UV water purifier - Market size and forecast (2024-2029) ($ million)
- Chart on UV water purifier - Year-over-year growth (2024-2029) (%)
- Data Table on UV water purifier - Year-over-year growth (2024-2029) (%)
- 9.6 Gravity-based water purifier - Market size and forecast (2024-2029)
- Chart on Gravity-based water purifier - Market size and forecast (2024-2029) ($ million)
- Data Table on Gravity-based water purifier - Market size and forecast (2024-2029) ($ million)
- Chart on Gravity-based water purifier - Year-over-year growth (2024-2029) (%)
- Data Table on Gravity-based water purifier - Year-over-year growth (2024-2029) (%)
- 9.7 Market opportunity by Product
- Market opportunity by Product ($ million)
- Data Table on Market opportunity by Product ($ million)
10 Market Segmentation by Application
- 10.1 Market segments
- Chart on Application - Market share (2024-2029) (%)
- Data Table on Application - Market share (2024-2029) (%)
- 10.2 Comparison by Application
- Chart on Comparison by Application
- Data Table on Comparison by Application
- 10.3 Houses - Market size and forecast (2024-2029)
- Chart on Houses - Market size and forecast (2024-2029) ($ million)
- Data Table on Houses - Market size and forecast (2024-2029) ($ million)
- Chart on Houses - Year-over-year growth (2024-2029) (%)
- Data Table on Houses - Year-over-year growth (2024-2029) (%)
- 10.4 Apartments - Market size and forecast (2024-2029)
- Chart on Apartments - Market size and forecast (2024-2029) ($ million)
- Data Table on Apartments - Market size and forecast (2024-2029) ($ million)
- Chart on Apartments - Year-over-year growth (2024-2029) (%)
- Data Table on Apartments - Year-over-year growth (2024-2029) (%)
- 10.5 Market opportunity by Application
- Market opportunity by Application ($ million)
- Data Table on Market opportunity by Application ($ million)
11 Market Segmentation by Technology Specificity
- 11.1 Market segments
- Chart on Technology Specificity - Market share (2024-2029) (%)
- Data Table on Technology Specificity - Market share (2024-2029) (%)
- 11.2 Comparison by Technology Specificity
- Chart on Comparison by Technology Specificity
- Data Table on Comparison by Technology Specificity
- 11.3 Reverse Osmosis - Market size and forecast (2024-2029)
- Chart on Reverse Osmosis - Market size and forecast (2024-2029) ($ million)
- Data Table on Reverse Osmosis - Market size and forecast (2024-2029) ($ million)
- Chart on Reverse Osmosis - Year-over-year growth (2024-2029) (%)
- Data Table on Reverse Osmosis - Year-over-year growth (2024-2029) (%)
- 11.4 UV Purification - Market size and forecast (2024-2029)
- Chart on UV Purification - Market size and forecast (2024-2029) ($ million)
- Data Table on UV Purification - Market size and forecast (2024-2029) ($ million)
- Chart on UV Purification - Year-over-year growth (2024-2029) (%)
- Data Table on UV Purification - Year-over-year growth (2024-2029) (%)
- 11.5 Activated Carbon - Market size and forecast (2024-2029)
- Chart on Activated Carbon - Market size and forecast (2024-2029) ($ million)
- Data Table on Activated Carbon - Market size and forecast (2024-2029) ($ million)
- Chart on Activated Carbon - Year-over-year growth (2024-2029) (%)
- Data Table on Activated Carbon - Year-over-year growth (2024-2029) (%)
- 11.6 Market opportunity by Technology Specificity
- Market opportunity by Technology Specificity ($ million)
- Data Table on Market opportunity by Technology Specificity ($ million)
12 Market Segmentation by Distribution Channel
- 12.1 Market segments
- Chart on Distribution Channel - Market share (2024-2029) (%)
- Data Table on Distribution Channel - Market share (2024-2029) (%)
- 12.2 Comparison by Distribution Channel
- Chart on Comparison by Distribution Channel
- Data Table on Comparison by Distribution Channel
- 12.3 Online Retail - Market size and forecast (2024-2029)
- Chart on Online Retail - Market size and forecast (2024-2029) ($ million)
- Data Table on Online Retail - Market size and forecast (2024-2029) ($ million)
- Chart on Online Retail - Year-over-year growth (2024-2029) (%)
- Data Table on Online Retail - Year-over-year growth (2024-2029) (%)
- 12.4 Specialty Stores - Market size and forecast (2024-2029)
- Chart on Specialty Stores - Market size and forecast (2024-2029) ($ million)
- Data Table on Specialty Stores - Market size and forecast (2024-2029) ($ million)
- Chart on Specialty Stores - Year-over-year growth (2024-2029) (%)
- Data Table on Specialty Stores - Year-over-year growth (2024-2029) (%)
- 12.5 Direct Sales - Market size and forecast (2024-2029)
- Chart on Direct Sales - Market size and forecast (2024-2029) ($ million)
- Data Table on Direct Sales - Market size and forecast (2024-2029) ($ million)
- Chart on Direct Sales - Year-over-year growth (2024-2029) (%)
- Data Table on Direct Sales - Year-over-year growth (2024-2029) (%)
- 12.6 Market opportunity by Distribution Channel
- Market opportunity by Distribution Channel ($ million)
- Data Table on Market opportunity by Distribution Channel ($ million)
13 Customer Landscape
- 13.1 Customer landscape overview
- Analysis of price sensitivity, lifecycle, customer purchase basket, adoption rates, and purchase criteria
14 Geographic Landscape
- 14.1 Geographic segmentation
- Chart on Market share by geography 2024-2029 (%)
- Data Table on Market share by geography 2024-2029 (%)
- 14.2 Geographic comparison
- Chart on Geographic comparison
- Data Table on Geographic comparison
- 14.3 APAC - Market size and forecast 2024-2029
- Chart on APAC - Market size and forecast 2024-2029 ($ million)
- Data Table on APAC - Market size and forecast 2024-2029 ($ million)
- Chart on APAC - Year-over-year growth 2024-2029 (%)
- Data Table on APAC - Year-over-year growth 2024-2029 (%)
- 14.4 Europe - Market size and forecast 2024-2029
- Chart on Europe - Market size and forecast 2024-2029 ($ million)
- Data Table on Europe - Market size and forecast 2024-2029 ($ million)
- Chart on Europe - Year-over-year growth 2024-2029 (%)
- Data Table on Europe - Year-over-year growth 2024-2029 (%)
- 14.5 North America - Market size and forecast 2024-2029
- Chart on North America - Market size and forecast 2024-2029 ($ million)
- Data Table on North America - Market size and forecast 2024-2029 ($ million)
- Chart on North America - Year-over-year growth 2024-2029 (%)
- Data Table on North America - Year-over-year growth 2024-2029 (%)
- 14.6 South America - Market size and forecast 2024-2029
- Chart on South America - Market size and forecast 2024-2029 ($ million)
- Data Table on South America - Market size and forecast 2024-2029 ($ million)
- Chart on South America - Year-over-year growth 2024-2029 (%)
- Data Table on South America - Year-over-year growth 2024-2029 (%)
- 14.7 Middle East and Africa - Market size and forecast 2024-2029
- Chart on Middle East and Africa - Market size and forecast 2024-2029 ($ million)
- Data Table on Middle East and Africa - Market size and forecast 2024-2029 ($ million)
- Chart on Middle East and Africa - Year-over-year growth 2024-2029 (%)
- Data Table on Middle East and Africa - Year-over-year growth 2024-2029 (%)
- 14.8 China - Market size and forecast 2024-2029
- Chart on China - Market size and forecast 2024-2029 ($ million)
- Data Table on China - Market size and forecast 2024-2029 ($ million)
- Chart on China - Year-over-year growth 2024-2029 (%)
- Data Table on China - Year-over-year growth 2024-2029 (%)
- 14.9 India - Market size and forecast 2024-2029
- Chart on India - Market size and forecast 2024-2029 ($ million)
- Data Table on India - Market size and forecast 2024-2029 ($ million)
- Chart on India - Year-over-year growth 2024-2029 (%)
- Data Table on India - Year-over-year growth 2024-2029 (%)
- 14.10 Japan - Market size and forecast 2024-2029
- Chart on Japan - Market size and forecast 2024-2029 ($ million)
- Data Table on Japan - Market size and forecast 2024-2029 ($ million)
- Chart on Japan - Year-over-year growth 2024-2029 (%)
- Data Table on Japan - Year-over-year growth 2024-2029 (%)
- 14.11 South Korea - Market size and forecast 2024-2029
- Chart on South Korea - Market size and forecast 2024-2029 ($ million)
- Data Table on South Korea - Market size and forecast 2024-2029 ($ million)
- Chart on South Korea - Year-over-year growth 2024-2029 (%)
- Data Table on South Korea - Year-over-year growth 2024-2029 (%)
- 14.12 US - Market size and forecast 2024-2029
- Chart on US - Market size and forecast 2024-2029 ($ million)
- Data Table on US - Market size and forecast 2024-2029 ($ million)
- Chart on US - Year-over-year growth 2024-2029 (%)
- Data Table on US - Year-over-year growth 2024-2029 (%)
- 14.13 Australia - Market size and forecast 2024-2029
- Chart on Australia - Market size and forecast 2024-2029 ($ million)
- Data Table on Australia - Market size and forecast 2024-2029 ($ million)
- Chart on Australia - Year-over-year growth 2024-2029 (%)
- Data Table on Australia - Year-over-year growth 2024-2029 (%)
- 14.14 Canada - Market size and forecast 2024-2029
- Chart on Canada - Market size and forecast 2024-2029 ($ million)
- Data Table on Canada - Market size and forecast 2024-2029 ($ million)
- Chart on Canada - Year-over-year growth 2024-2029 (%)
- Data Table on Canada - Year-over-year growth 2024-2029 (%)
- 14.15 Germany - Market size and forecast 2024-2029
- Chart on Germany - Market size and forecast 2024-2029 ($ million)
- Data Table on Germany - Market size and forecast 2024-2029 ($ million)
- Chart on Germany - Year-over-year growth 2024-2029 (%)
- Data Table on Germany - Year-over-year growth 2024-2029 (%)
- 14.16 UK - Market size and forecast 2024-2029
- Chart on UK - Market size and forecast 2024-2029 ($ million)
- Data Table on UK - Market size and forecast 2024-2029 ($ million)
- Chart on UK - Year-over-year growth 2024-2029 (%)
- Data Table on UK - Year-over-year growth 2024-2029 (%)
- 14.17 Mexico - Market size and forecast 2024-2029
- Chart on Mexico - Market size and forecast 2024-2029 ($ million)
- Data Table on Mexico - Market size and forecast 2024-2029 ($ million)
- Chart on Mexico - Year-over-year growth 2024-2029 (%)
- Data Table on Mexico - Year-over-year growth 2024-2029 (%)
- 14.18 Market opportunity by geography
- Market opportunity by geography ($ million)
- Data Tables on Market opportunity by geography ($ million)
- 14.19 France - Market size and forecast (2024-2029)
- Chart on France - Market size and forecast (2024-2029) ($ million)
- Data Table on France - Market size and forecast (2024-2029) ($ million)
- Chart on France - Year-over-year growth (2024-2029) (%)
- Data Table on France - Year-over-year growth (2024-2029) (%)
- 14.20 Italy - Market size and forecast (2024-2029)
- Chart on Italy - Market size and forecast (2024-2029) ($ million)
- Data Table on Italy - Market size and forecast (2024-2029) ($ million)
- Chart on Italy - Year-over-year growth (2024-2029) (%)
- Data Table on Italy - Year-over-year growth (2024-2029) (%)
- 14.21 Brazil - Market size and forecast (2024-2029)
- Chart on Brazil - Market size and forecast (2024-2029) ($ million)
- Data Table on Brazil - Market size and forecast (2024-2029) ($ million)
- Chart on Brazil - Year-over-year growth (2024-2029) (%)
- Data Table on Brazil - Year-over-year growth (2024-2029) (%)
- 14.22 UAE - Market size and forecast (2024-2029)
- Chart on UAE - Market size and forecast (2024-2029) ($ million)
- Data Table on UAE - Market size and forecast (2024-2029) ($ million)
- Chart on UAE - Year-over-year growth (2024-2029) (%)
- Data Table on UAE - Year-over-year growth (2024-2029) (%)
- 14.23 SpainMexico - Market size and forecast (2024-2029)
- Chart on SpainMexico - Market size and forecast (2024-2029) ($ million)
- Data Table on SpainMexico - Market size and forecast (2024-2029) ($ million)
- Chart on SpainMexico - Year-over-year growth (2024-2029) (%)
- Data Table on SpainMexico - Year-over-year growth (2024-2029) (%)
- 14.24 Rest of World (ROW) - Market size and forecast (2024-2029)
- Chart on Rest of World (ROW) - Market size and forecast (2024-2029) ($ million)
- Data Table on Rest of World (ROW) - Market size and forecast (2024-2029) ($ million)
- Chart on Rest of World (ROW) - Year-over-year growth (2024-2029) (%)
- Data Table on Rest of World (ROW) - Year-over-year growth (2024-2029) (%)
15 Drivers, Challenges, and Opportunity/Restraints
- 15.3 Impact of drivers and challenges
- Impact of drivers and challenges in 2024 and 2029
- 15.4 Market opportunities/restraints
16 Competitive Landscape
- 16.2 Competitive Landscape
- Overview on criticality of inputs and factors of differentiation
- 16.3 Landscape disruption
- Overview on factors of disruption
- 16.4 Industry risks
- Impact of key risks on business
17 Competitive Analysis
- 17.2 Market positioning of companies
- Matrix on companies position and classification
- 17.3 A. O. Smith Corporation (United States)
- A. O. Smith Corporation (United States) - Overview
- A. O. Smith Corporation (United States) - Product / Service
- A. O. Smith Corporation (United States) - Key offerings
- 17.4 Pentair plc (United Kingdom)
- Pentair plc (United Kingdom) - Overview
- Pentair plc (United Kingdom) - Product / Service
- Pentair plc (United Kingdom) - Key offerings
- 17.5 Brita GmbH (Germany)
- Brita GmbH (Germany) - Overview
- Brita GmbH (Germany) - Product / Service
- Brita GmbH (Germany) - Key offerings
- 17.6 Eureka Forbes Ltd. (India)
- Eureka Forbes Ltd. (India) - Overview
- Eureka Forbes Ltd. (India) - Product / Service
- Eureka Forbes Ltd. (India) - Key offerings
- 17.7 Kent RO Systems Ltd. (India)
- Kent RO Systems Ltd. (India) - Overview
- Kent RO Systems Ltd. (India) - Product / Service
- Kent RO Systems Ltd. (India) - Key offerings
- 17.8 Culligan International (United States)
- Culligan International (United States) - Overview
- Culligan International (United States) - Product / Service
- Culligan International (United States) - Key offerings
- 17.9 Coway Co., Ltd. (South Korea)
- Coway Co., Ltd. (South Korea) - Overview
- Coway Co., Ltd. (South Korea) - Product / Service
- Coway Co., Ltd. (South Korea) - Key offerings
- 17.10 Panasonic Corporation (Japan)
- Panasonic Corporation (Japan) - Overview
- Panasonic Corporation (Japan) - Product / Service
- Panasonic Corporation (Japan) - Key offerings
- 17.11 LG Electronics (South Korea)
- LG Electronics (South Korea) - Overview
- LG Electronics (South Korea) - Product / Service
- LG Electronics (South Korea) - Key offerings
- 17.12 Unilever PLC (United Kingdom)
- Unilever PLC (United Kingdom) - Overview
- Unilever PLC (United Kingdom) - Product / Service
- Unilever PLC (United Kingdom) - Key offerings
- 3M Company (United States)
- 3M Company (United States) - Overview
- 3M Company (United States) - Product / Service
- 3M Company (United States) - Key offerings
- 17.14 Aquasana Inc. (United States)
- Aquasana Inc. (United States) - Overview
- Aquasana Inc. (United States) - Product / Service
- Aquasana Inc. (United States) - Key offerings
- 17.15 Blue Star Limited (India)
- Blue Star Limited (India) - Overview
- Blue Star Limited (India) - Product / Service
- Blue Star Limited (India) - Key offerings
- 17.16 Whirlpool Corporation (United States)
- Whirlpool Corporation (United States) - Overview
- Whirlpool Corporation (United States) - Product / Service
- Whirlpool Corporation (United States) - Key offerings
- 17.17 Philips (Netherlands)
- Philips (Netherlands) - Overview
- Philips (Netherlands) - Product / Service
- Philips (Netherlands) - Key offerings
- 17.18 Tata Chemicals Ltd. (India)
- Tata Chemicals Ltd. (India) - Overview
- Tata Chemicals Ltd. (India) - Product / Service
- Tata Chemicals Ltd. (India) - Key offerings
- 17.19 Livpure Pvt. Ltd. (India)
- Livpure Pvt. Ltd. (India) - Overview
- Livpure Pvt. Ltd. (India) - Product / Service
- Livpure Pvt. Ltd. (India) - Key offerings
- 17.20 EcoWater Systems LLC (United States)
- EcoWater Systems LLC (United States) - Overview
- EcoWater Systems LLC (United States) - Product / Service
- EcoWater Systems LLC (United States) - Key offerings
- 17.21 Katadyn Group (Switzerland)
- Katadyn Group (Switzerland) - Overview
- Katadyn Group (Switzerland) - Product / Service
- Katadyn Group (Switzerland) - Key offerings
- 17.22 HUL Pureit (India)
- HUL Pureit (India) - Overview
- HUL Pureit (India) - Product / Service
- HUL Pureit (India) - Key offerings
- 3M Co.
- 3M Co. - Overview
- 3M Co. - Product / Service
- 3M Co. - Key offerings
- 17.24 Amway Corp.
- Amway Corp. - Overview
- Amway Corp. - Product / Service
- Amway Corp. - Key offerings
- 17.25 Aquafresh RO System
- Aquafresh RO System - Overview
- Aquafresh RO System - Product / Service
- Aquafresh RO System - Key offerings
- 17.26 AQUAPHOR International OU
- AQUAPHOR International OU - Overview
- AQUAPHOR International OU - Product / Service
- AQUAPHOR International OU - Key offerings
- 17.27 BRITA SE
- BRITA SE - Overview
- BRITA SE - Product / Service
- BRITA SE - Key offerings
- 17.28 BWT Holding GmbH
- BWT Holding GmbH - Overview
- BWT Holding GmbH - Product / Service
- BWT Holding GmbH - Key offerings
- 17.29 Coway Co. Ltd.
- Coway Co. Ltd. - Overview
- Coway Co. Ltd. - Product / Service
- Coway Co. Ltd. - Key offerings
- 17.30 Culligan International Co.
- Culligan International Co. - Overview
- Culligan International Co. - Product / Service
- Culligan International Co. - Key offerings
- 17.31 EcoWater Systems LLC
- EcoWater Systems LLC - Overview
- EcoWater Systems LLC - Product / Service
- EcoWater Systems LLC - Key offerings
- 17.32 General Electric Co.
- General Electric Co. - Overview
- General Electric Co. - Product / Service
- General Electric Co. - Key offerings
- 17.33 Haier Smart Home Co. Ltd.
- Haier Smart Home Co. Ltd. - Overview
- Haier Smart Home Co. Ltd. - Product / Service
- Haier Smart Home Co. Ltd. - Key offerings
- 17.34 Helen of Troy Ltd.
- Helen of Troy Ltd. - Overview
- Helen of Troy Ltd. - Product / Service
- Helen of Troy Ltd. - Key offerings
- 17.35 Honeywell International Inc.
- Honeywell International Inc. - Overview
- Honeywell International Inc. - Product / Service
- Honeywell International Inc. - Key offerings
- 17.36 ispring water system LLC
- ispring water system LLC - Overview
- ispring water system LLC - Product / Service
- ispring water system LLC - Key offerings
- 17.37 KENT RO Systems Ltd.
- KENT RO Systems Ltd. - Overview
- KENT RO Systems Ltd. - Product / Service
- KENT RO Systems Ltd. - Key offerings
- 17.38 Koninklijke Philips NV
- Koninklijke Philips NV - Overview
- Koninklijke Philips NV - Product / Service
- Koninklijke Philips NV - Key offerings
- 17.39 LG Corp.
- LG Corp. - Overview
- LG Corp. - Product / Service
- LG Corp. - Key offerings
- 17.40 Panasonic Holdings Corp.
- Panasonic Holdings Corp. - Overview
- Panasonic Holdings Corp. - Product / Service
- Panasonic Holdings Corp. - Key offerings
- 17.41 Pentair Plc
- Pentair Plc - Overview
- Pentair Plc - Product / Service
- Pentair Plc - Key offerings
- 17.42 Unilever PLC
- Unilever PLC - Overview
- Unilever PLC - Product / Service
- Unilever PLC - Key offerings
18 Appendix
- 18.2 Inclusions and exclusions checklist
- Inclusions checklist
- Exclusions checklist
- 18.3 Currency conversion rates for US$
- Currency conversion rates for US$
- 18.4 Research methodology
- 18.7 Validation techniques employed for market sizing
- Validation techniques employed for market sizing
- 18.9 360 degree market analysis
- 360 degree market analysis
- 18.10 List of abbreviations