Reverse Osmosis Membrane Market Size 2024-2028
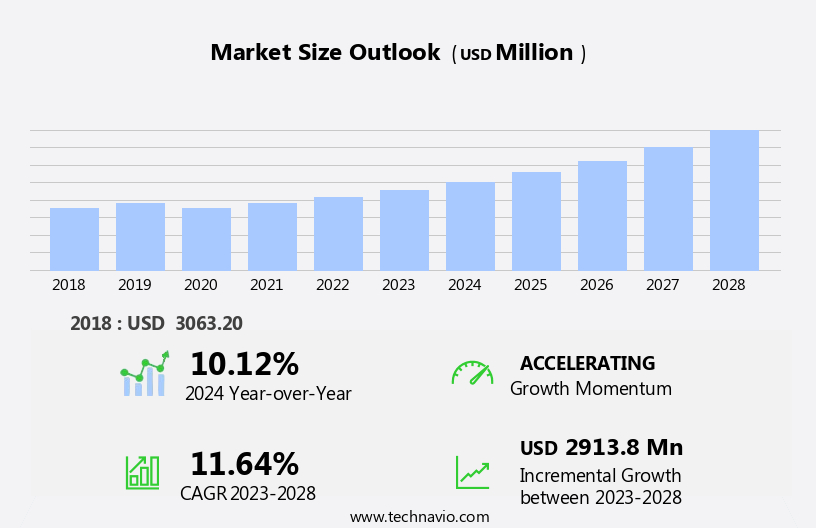
The reverse osmosis membrane market size is forecast to increase by USD 2.91 billion at a CAGR of 11.64% between 2023 and 2028.
- The RO membrane market is experiencing significant growth due to the advantages of RO membranes in produced water treatment, particularly in industries with high water consumption. The rapid industrial expansion in various sectors, such as food and beverage, pharmaceuticals, and semiconductors, is driving the demand for RO membranes.
- However, the market faces challenges, including membrane fouling, which can lead to increased operational costs and decreased efficiency. To mitigate these challenges, research and development efforts are focused on improving membrane filters and manufacturing processes to enhance membrane durability and reduce fouling. Additionally, the integration of advanced technologies, such as nanofiltration and ultraviolet disinfection, is expected to further boost market growth.
- Overall, the RO membrane market is poised for steady expansion, driven by the need for efficient and sustainable water treatment solutions.
What will be the Size of the Reverse Osmosis Membrane Market During the Forecast Period?
- The reverse osmosis (RO) membrane market is driven by the growing concern over contamination levels in water sources and the increasing prevalence of waterborne diseases. Membrane technology, including RO membranes, plays a crucial role in water purification, particularly in desalination. Desalination, a process used to produce fresh water from seawater, accounts for a significant portion of the market's growth. Notable applications include desalination plants, food processing industries, and agrochemicals. However, the energy-intensive nature of RO membrane processes and challenges such as fouling and scaling pose obstacles to market expansion. Environmental regulations also influence the market, as stricter standards for water quality drive demand for advanced membrane technologies.
- Other emerging trends include the integration of UV treatment in RO systems and the development of floating desalination vessels for use in water-scarce regions. The International Bounded Electrolyte Membrane Federation (IBF) anticipates continued growth In the RO membrane market due to these factors.
How is this Reverse Osmosis Membrane Industry segmented and which is the largest segment?
The reverse osmosis membrane industry research report provides comprehensive data (region-wise segment analysis), with forecasts and estimates in "USD billion" for the period 2024-2028, as well as historical data from 2018-2022 for the following segments.
- Type
- Thin film composite membrane
- Cellulose-based membrane
- Filter Module
- Plate & Frame
- Tubular
- Spiral Wound
- Hollow Fiber
- Application
- Desalination system
- RO purification system
- Medical Devices & Diagnostics
- Geography
- North America
- Canada
- US
- Europe
- Germany
- APAC
- China
- India
- Japan
- South America
- Middle East and Africa
- North America
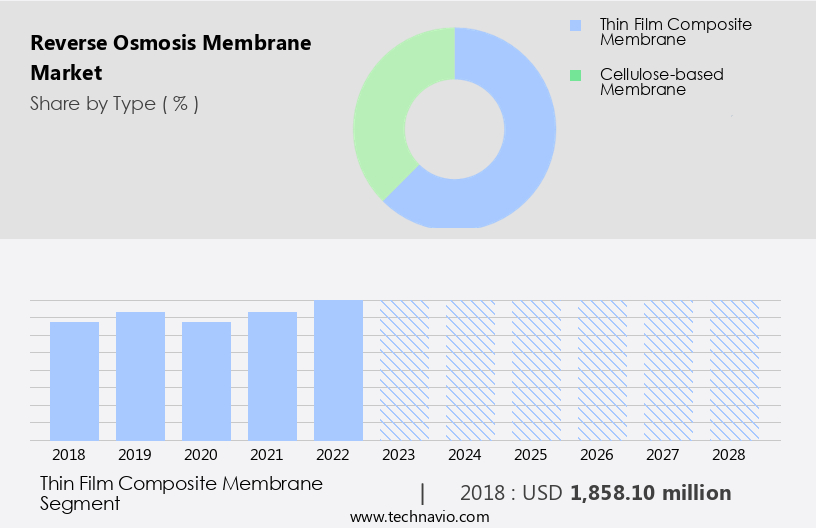
By Type Insights
The thin film composite membrane segment is estimated to witness significant growth during the forecast period. The Reverse Osmosis (RO) membrane market encompasses the application of this water purification technology in residential, commercial, municipal, and industrial sectors. RO is a process of demineralization whereby saline water is forced through a semipermeable membrane to remove ions, molecules, bacteria, and contaminants, rendering it suitable for potable use. This membrane filtration method operates against the natural direction of osmosis, with applied pressure surpassing the osmotic pressure to facilitate water flow. The membrane selectively permits water molecules to pass, while inhibiting the passage of salts and microorganisms. A high-pressure pump is essential for applying the necessary pressure, which is contingent upon the feed water's salt concentration.
This technology plays a crucial role in addressing waterborne diseases, contamination levels, and water scarcity issues, particularly in desalination plants and water treatment applications, including process water, utility water treatment, wastewater treatment, and reuse. Despite its effectiveness, RO membranes face challenges such as fouling and scaling, necessitating regular maintenance and the adoption of advanced membrane technologies like cellulose-based membranes, hollow-fiber membranes, spiral-wound membranes, and tubular-shaped membranes. The energy-intensive process, environmental regulations, and water recovery concerns continue to shape the market dynamics.
Get a glance at the share of various segments. Request Free Sample
The thin film composite membrane segment was valued at USD 1.86 billion in 2018 and showed a gradual increase during the forecast period.
Regional Analysis
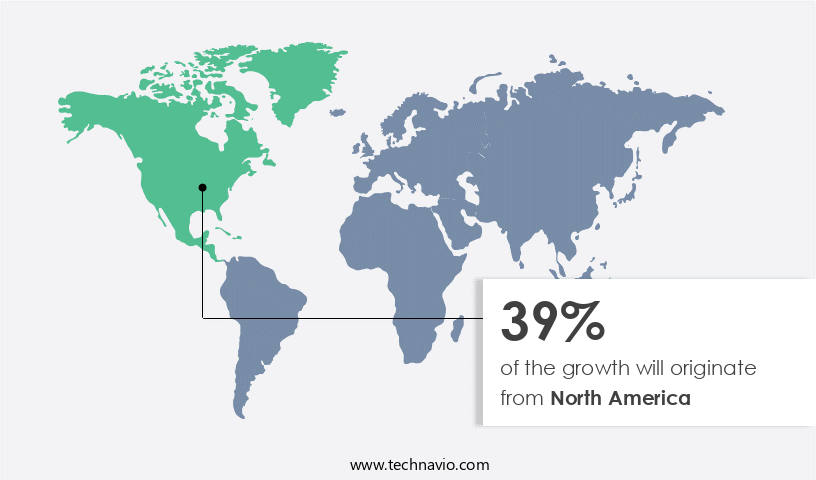
North America is estimated to contribute 39% to the growth of the global market during the forecast period. Technavio's analysts have elaborately explained the regional trends and drivers that shape the market during the forecast period.
For more insights on the market share of various regions, Request Free Sample
The North American reverse osmosis (RO) membrane market experiences growth due to the expanding water and wastewater treatment industry. Desalination, a water purification process, is increasingly adopted for treating and purifying water to mitigate water scarcity. This trend boosts the demand for RO membranes In the region. Several water treatment plants are expanding their capacity, such as Indiana American Water's USD 45 million project for constructing a new water treatment facility. Contamination levels and waterborne diseases necessitate advanced water treatment technologies, further fueling the market growth. RO membranes are integral to process water, utility water treatment, and wastewater treatment & reuse applications.
Various membrane types, including cellulose-based membranes, filter modules, hollow-fiber membranes, spiral-wound membranes, and tubular-shaped membranes, cater to diverse industry requirements. Despite being energy-intensive, RO membranes are crucial for water recovery in addressing water shortage caused by industrial activities and agricultural practices. Environmental regulations ensure the sustainable use of these membranes, while UV and other technologies complement their functionality in food processing and agrochemicals.
Market Dynamics
Our researchers analyzed the data with 2023 as the base year, along with the key drivers, trends, and challenges. A holistic analysis of drivers will help companies refine their marketing strategies to gain a competitive advantage.
What are the key market drivers leading to the rise In the adoption of Reverse Osmosis Membrane Industry?
Advantages of RO membranes in water treatment is the key driver of the market.
- Membrane technology, specifically Reverse Osmosis (RO) membranes, plays a crucial role in addressing water contamination levels and preventing waterborne diseases. RO membranes are integral to water purification processes, including desalination, utility water treatment, and wastewater treatment & reuse. LG Chem and other leading companies are investing in advanced membrane technology to improve efficiency and reduce energy consumption. Desalination, a critical application of RO membranes, is gaining traction due to water scarcity and stringent environmental regulations. Floating Desalination Vessels are an innovative solution for areas with limited land resources. RO membranes are available in various configurations, such as cellulose-based membranes, hollow-fiber membranes, spiral-wound membranes, and tubular-shaped membranes, catering to diverse process water requirements.
- Industrial activities, food processing, and agrochemicals are other significant industries utilizing RO membranes for water recovery. However, challenges such as fouling and scaling in RO membranes can hinder market growth. Desalination plants and water desalination are significant consumers of RO membranes, accounting for a substantial market share. Brine disposal and metal ion removal are ongoing concerns In the RO membrane market. The energy-intensive process of RO membrane production and the high cost of membranes are key challenges. UV treatment is often used in conjunction with RO membranes to ensure water sterility. The market for RO membranes is expected to grow significantly due to increasing water shortage and the need for sustainable water recovery solutions.
What are the market trends shaping the Reverse Osmosis Membrane Industry?
Rapid industrial expansion is the upcoming market trend.
- The global Reverse Osmosis (RO) Membrane Market is experiencing significant growth due to escalating contamination levels in water sources and the rising incidence of waterborne diseases. As water becomes an increasingly scarce resource, there is a growing need for advanced water purification technologies, such as RO membranes, in various industries, including desalination, utility water treatment, and wastewater treatment and reuse. RO membranes are essential for the desalination process, which is becoming increasingly important in addressing water shortages caused by industrial activities and climate change. LG Chem, a leading player In the membrane technology industry, offers a range of RO membranes, including cellulose-based membranes, hollow-fiber membranes, spiral-wound membranes, and tubular-shaped membranes.
- These membranes are used in various applications, such as process water, potable water, and brine treatment, to remove contaminants, metal ions, and other impurities. Environmental regulations and energy-intensive nature of RO membrane production are some of the challenges facing the RO Membrane Market. However, advancements in membrane technology, such as UV disinfection and fouling and scaling prevention, are addressing these challenges. Furthermore, RO membranes are increasingly being used in food processing and agrochemicals industries, adding to their market potential. Despite these challenges, the RO Membrane Market is expected to grow significantly during the forecast period due to the increasing demand for water desalination and the need to recover water for reuse in various industries.
What challenges does the Reverse Osmosis Membrane Industry face during its growth?
Fouling of membranes is a key challenge affecting the industry growth.
- The Reverse Osmosis (RO) Membrane Market faces challenges due to membrane fouling, a process causing solute buildup and pore blockage, resulting in flux decline and reduced membrane performance. This issue negatively impacts the quality of permeates and increases functional and conservation costs. Membrane replacement is necessary, further increasing expenses. Contamination levels leading to waterborne diseases and waterborne diseases themselves are significant drivers for water purification, including RO membrane technology. Desalination, a critical application, also relies on RO membranes to treat brine and produce potable water.
- However, the energy-intensive process and environmental regulations pose challenges. Membrane technology, including cellulose-based membranes, filter modules like hollow-fiber membranes, spiral-wound membranes, and tubular-shaped membranes, are integral to water desalination and utility water treatment, wastewater treatment & reuse, process water, and industrial activities. Membrane technology applications span from food processing to agrochemicals. Fouling and scaling, common issues, impact membrane functionality and efficiency, affecting water recovery and water shortage mitigation efforts. Despite these challenges, the RO Membrane Market continues to grow, addressing water scarcity and ensuring water quality.
Exclusive Customer Landscape
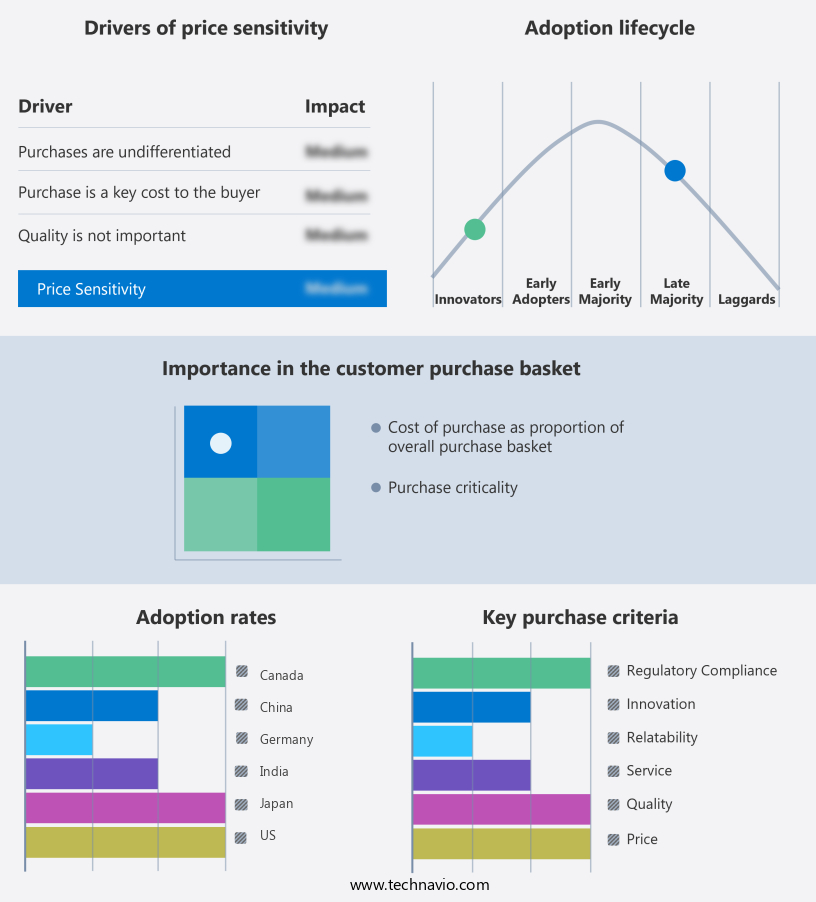
The reverse osmosis membrane market forecasting report includes the adoption lifecycle of the market, covering from the innovator's stage to the laggard's stage. It focuses on adoption rates in different regions based on penetration. Furthermore, the reverse osmosis membrane market report also includes key purchase criteria and drivers of price sensitivity to help companies evaluate and develop their market growth analysis strategies.
Customer Landscape
Key Companies & Market Insights
Companies are implementing various strategies, such as strategic alliances, reverse osmosis membrane market forecast, partnerships, mergers and acquisitions, geographical expansion, and product/service launches, to enhance their presence In the industry.
The industry research and growth report includes detailed analyses of the competitive landscape of the market and information about key companies, including:
- Applied Membranes Inc.
- AXEON Water Technologies
- Chart Industries Inc.
- DuPont de Nemours Inc.
- Filtration Group Corp.
- General Electric Co.
- Genesis Water Technologies Inc.
- Hi Tech Sweet Water Technologies Pvt. Ltd.
- Hunan Keensen Technology Co. Ltd.
- Koch Industries Inc.
- Lenntech BV
- LG Electronics Inc.
- M Pure International Co. Ltd.
- MANN HUMMEL International GmbH and Co. KG
- Nitto Denko Corp.
- SnowPure LLC
- SUEZ SA
- Toray Industries Inc.
- Toyobo Co. Ltd.
Qualitative and quantitative analysis of companies has been conducted to help clients understand the wider business environment as well as the strengths and weaknesses of key industry players. Data is qualitatively analyzed to categorize companies as pure play, category-focused, industry-focused, and diversified; it is quantitatively analyzed to categorize companies as dominant, leading, strong, tentative, and weak.
Research Analyst Overview
The reverse osmosis (RO) membrane market encompasses a diverse range of applications withIn the water purification industry. This market is driven by the growing demand for clean water due to various factors, including waterborne diseases, contamination levels, and water scarcity. RO membranes are essential components in water treatment processes, enabling the separation of ions, molecules, and larger particles from water. These membranes are utilized in various sectors, including utility water treatment, wastewater treatment and reuse, and desalination. The desalination sector, in particular, is witnessing significant growth due to increasing water scarcity in various regions. Desalination plants employ RO membranes to remove salt and other minerals from seawater, making it potable.
However, the energy-intensive nature of the desalination process presents a challenge, as it requires substantial amounts of electricity. RO membranes are available in different configurations, including hollow-fiber membranes, spiral-wound membranes, and tubular-shaped membranes. The choice of membrane type depends on the specific application requirements. For instance, hollow-fiber membranes are suitable for small-scale applications due to their compact design, while spiral-wound membranes are commonly used in large-scale industrial applications. The RO membrane market is subject to various challenges, including fouling and scaling. Fouling refers to the accumulation of organic and inorganic materials on the membrane surface, while scaling refers to the deposition of minerals on the membrane surface.
These issues can reduce membrane efficiency and increase operational costs. Membrane technology is also finding applications in other industries, such as food processing machinery and industrial activities. For instance, RO membranes are used to recover water from agrochemicals and other industrial waste streams, reducing water usage and minimizing waste. Moreover, environmental regulations are driving the adoption of RO membranes in various applications. For example, UV disinfection, a common method for water treatment, is being supplemented with RO membranes to ensure the removal of microcontaminants and other substances that UV cannot eliminate. In conclusion, the RO membrane market is a dynamic and growing industry, driven by the demand for clean water and the need to address water scarcity and contamination issues. The market is subject to various challenges, including energy consumption, membrane fouling, and scaling. Despite these challenges, RO membranes continue to be a viable solution for various water treatment applications, offering significant benefits in terms of water recovery and resource conservation.
|
Market Scope |
|
|
Report Coverage |
Details |
|
Page number |
149 |
|
Base year |
2023 |
|
Historic period |
2018-2022 |
|
Forecast period |
2024-2028 |
|
Growth momentum & CAGR |
Accelerate at a CAGR of 11.64% |
|
Market growth 2024-2028 |
USD 2.91 billion |
|
Market structure |
Fragmented |
|
YoY growth 2023-2024(%) |
10.12 |
|
Key countries |
US, China, Germany, Japan, Canada, and India |
|
Competitive landscape |
Leading Companies, Market Positioning of Companies, Competitive Strategies, and Industry Risks |
What are the Key Data Covered in this Reverse Osmosis Membrane Market Research and Growth Report?
- CAGR of the Reverse Osmosis Membrane industry during the forecast period
- Detailed information on factors that will drive the growth and forecasting between 2024 and 2028
- Precise estimation of the size of the market and its contribution of the industry in focus to the parent market
- Accurate predictions about upcoming growth and trends and changes in consumer behaviour
- Growth of the market across North America, Europe, APAC, South America, and Middle East and Africa
- Thorough analysis of the market's competitive landscape and detailed information about companies
- Comprehensive analysis of factors that will challenge the reverse osmosis membrane market growth of industry companies
We can help! Our analysts can customize this reverse osmosis membrane market research report to meet your requirements.
 RIA -
RIA - 
