
Retail Banking IT Spending Market Size 2025-2029
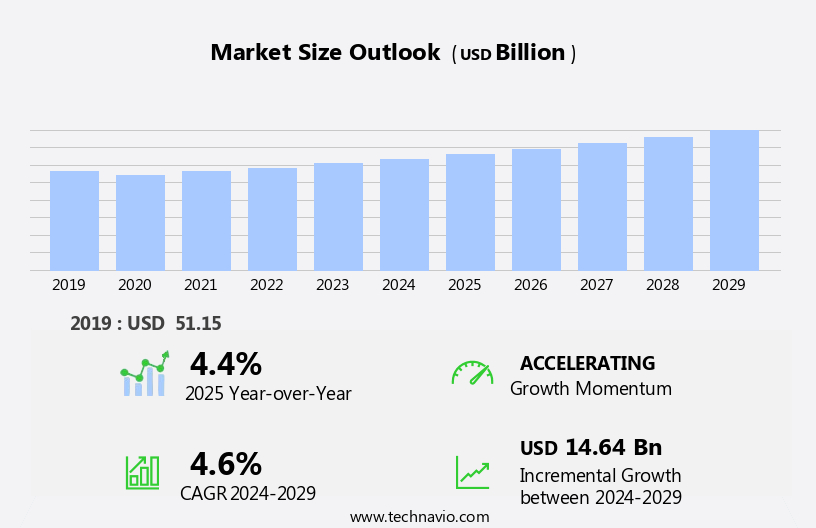
The retail banking it spending market size is forecast to increase by USD 14.64 billion at a CAGR of 4.6% between 2024 and 2029.
- The market is experiencing significant growth, driven by the increasing need for greater customer satisfaction through personalized services and digital offerings. This trend is further fueled by the incorporation of advanced analytics into third-party banking software, enabling institutions to gain valuable insights into customer behavior and preferences. However, this digital transformation comes with challenges, particularly in the areas of data privacy and security. As financial institutions continue to invest in IT solutions to meet evolving customer demands, they must also prioritize security measures to protect sensitive customer information.
- Companies seeking to capitalize on this market opportunity must stay abreast of the latest technologies and regulatory requirements, while also addressing the growing concerns around data privacy and security. Effective strategic planning and operational execution will be crucial for retail banks to navigate these challenges and succeed in this dynamic market.
What will be the Size of the Retail Banking IT Spending Market during the forecast period?
- The market is experiencing significant growth as financial institutions prioritize technology investments to enhance customer experience, operational efficiency, and competitive position. With increasing interest rates and inflationary pressure, net interest margins remain a crucial revenue stream for retail banks. However, customer satisfaction and service propositions are key differentiators in a market where external stimuli, such as digital transformation and changing consumer preferences, continue to shape the landscape. IT spending in retail banking is focused on IT hardware and software, with a shift towards cloud solutions and mobile banking to improve accessibility and convenience. Data analytics and cybersecurity measures are also critical investments to mitigate risks and provide personalized offerings.
- Retail banks are embracing IT services to stay competitive, with a focus on digital transformation and the implementation of innovative technologies such as artificial intelligence, autonomous banking, blockchain technology, and biometric authentication. The integration of these advanced IT solutions aims to streamline banking operations, enhance security, and create value propositions that cater to evolving customer needs.
How is this Retail Banking IT Spending Industry segmented?
The retail banking it spending industry research report provides comprehensive data (region-wise segment analysis), with forecasts and estimates in "USD billion" for the period 2025-2029, as well as historical data from 2019-2023 for the following segments.
- Type
- IT services
- IT hardware
- IT software
- Application
- Application development and maintenance
- Software deployment and support
- Internal operations
- Channel management
- Others
- Geography
- North America
- US
- Canada
- Europe
- France
- Germany
- Italy
- The Netherlands
- UK
- APAC
- China
- India
- Japan
- Middle East and Africa
- South America
- North America
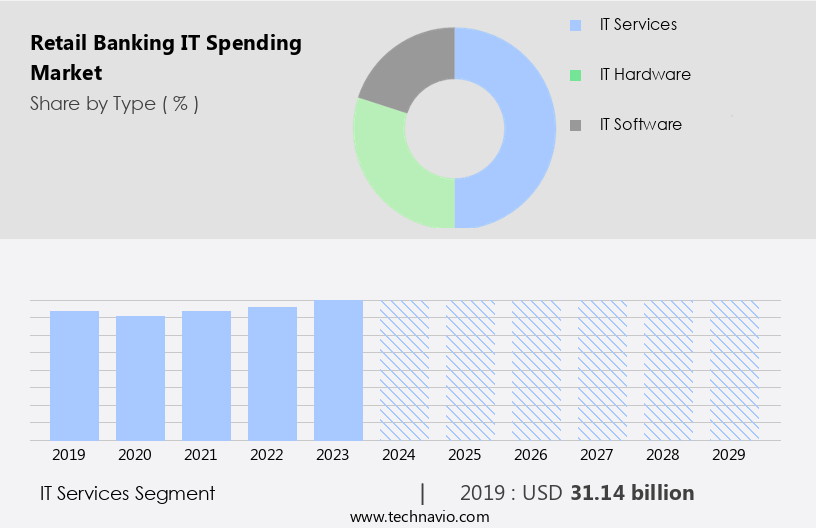
By Type Insights
The it services segment is estimated to witness significant growth during the forecast period.
In the retail banking sector, IT spending continues to be a significant investment area, driven by factors such as interest rates, net interest, inflationary pressure, and customer experience. IT services, including application development and maintenance, system integration, IT consulting, software deployment and support, and hardware deployment and support, dominate IT spending. IT consulting services experienced a 10% year-over-year growth in 2023, surpassing the overall IT services spend growth of 8.8%. Key players, such as Accenture, Capgemini, Cognizant, EPAM, Grid Dynamics, and HCL Tech, expanded their artificial intelligence (AI) capabilities in Q2 2023, with many collaborating with Google Cloud to enhance their offerings.
Technological advancements, consumer preferences, economic developments, and revenue streams influence retail banking IT spending. IT workforce, cloud spending, production volume, and operational efficiency are essential components of retail banking IT spending. Digital transformation through technologies like artificial intelligence, data analytics, cloud native ecosystem, infrastructure as code, cloud migration, containerization technologies, threat detection, prevention technologies, data encryption, blockchain technology, and fraud protection are shaping the retail banking landscape. Customer relationship management, online transaction systems, mobile banking, and digital banking are crucial customer experience propositions. Consumer expectations for seamless digital experiences and enhanced security are driving the adoption of these technologies.
Get a glance at the market report of share of various segments Request Free Sample
The IT services segment was valued at USD 31.14 billion in 2019 and showed a gradual increase during the forecast period.
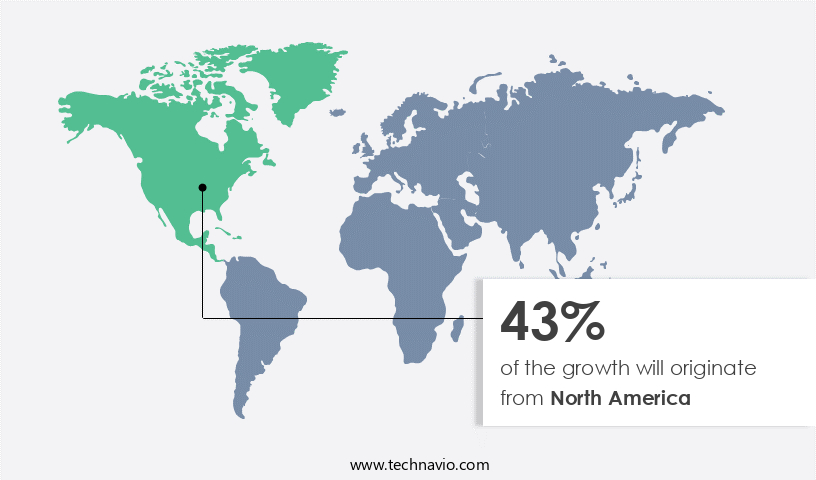
Regional Analysis
North America is estimated to contribute 43% to the growth of the global market during the forecast period.Technavio’s analysts have elaborately explained the regional trends and drivers that shape the market during the forecast period.
For more insights on the market size of various regions, Request Free Sample
The retail banking sector in the US is experiencing significant growth, driving the market. The BFSI sector's dominance in the region contributes substantially to this market, with the US being the largest contributor. The shift towards digital banking, including online transaction systems, mobile banking, and digital banking, is increasing the demand for IT investments. Furthermore, the resumption of student loan payments in October 2023 has added to the focus on IT spending for student loan processing. Retail banks prioritize IT technology to enhance customer experience, service propositions, and operational efficiency. IT spending encompasses areas such as cloud spending, production volume, technological advancements, and IT workforce.
Key areas of focus include customer relationship management, fraud protection, identity management, threat detection, prevention technologies, data encryption, blockchain technology, and artificial intelligence for data analytics. These investments aim to meet consumer expectations, improve revenue streams, and maintain a competitive position in the market. External stimuli, such as economic developments and regulatory requirements, also influence retail banking IT spending.
Market Dynamics
Our researchers analyzed the data with 2024 as the base year, along with the key drivers, trends, and challenges. A holistic analysis of drivers will help companies refine their marketing strategies to gain a competitive advantage.
What are the key market drivers leading to the rise in the adoption of Retail Banking IT Spending Industry?
- Growing need for greater customer satisfaction is the key driver of the market.
- The retail banking industry globally is experiencing growth due to the rising number of customers relying on it for financial decisions and investments. To manage this expanding customer base efficiently, banking enterprises are expanding their geographic reach. In response, there is a growing demand for banking software. This technology enables customers to access their accounts from any interconnected branch worldwide and offers the convenience of account management from anywhere and at any time.
- By implementing banking software, retail banks can enhance customer service, streamline operations, and improve overall performance.
What are the market trends shaping the Retail Banking IT Spending Industry?
- Incorporation of analytics into third-party banking software is the upcoming market trend.
- The banking industry is witnessing a shift in customer behavior, driven by the adoption of digital technologies and mobile devices. This trend is leading to an increase in customer data for enterprises, presenting an opportunity for them to gain valuable insights. By investing in banking software with analytics capabilities, enterprises can make informed decisions, enhance operational efficiencies, mitigate risks, and better understand their customers. This data-driven approach is essential for banks to remain competitive and profitable in today's digital landscape.
- As a result, the demand for advanced analytics solutions in retail banking is on the rise. These tools enable banks to process large volumes of data quickly and accurately, providing actionable insights that can inform strategic business decisions. Ultimately, the use of analytics in retail banking will help enterprises optimize performance, improve customer satisfaction, and drive growth.
What challenges does the Retail Banking IT Spending Industry face during its growth?
- Issues related to data privacy and security is a key challenge affecting the industry growth.
- In the retail banking sector, IT spending is influenced by significant challenges in data privacy and security. With the increasing adoption of Big Data and Artificial Intelligence, banks are leveraging these technologies to track, retrieve, and analyze data from connected servers. However, this data must be safeguarded from unauthorized access, particularly in IT infrastructures built on numerous open-source codes. Cloud infrastructure, in particular, is vulnerable due to potential glitches in source codes and the open architecture and shared resources it employs.
- Hackers can exploit these vulnerabilities, making it essential for banks to invest in security measures. Despite the benefits of cloud services, their ease of procurement and accessibility also pose risks, as cybercriminals can scan and identify system loopholes and vulnerabilities. Therefore, retail banks must prioritize IT spending on data security to mitigate these risks and maintain customer trust.
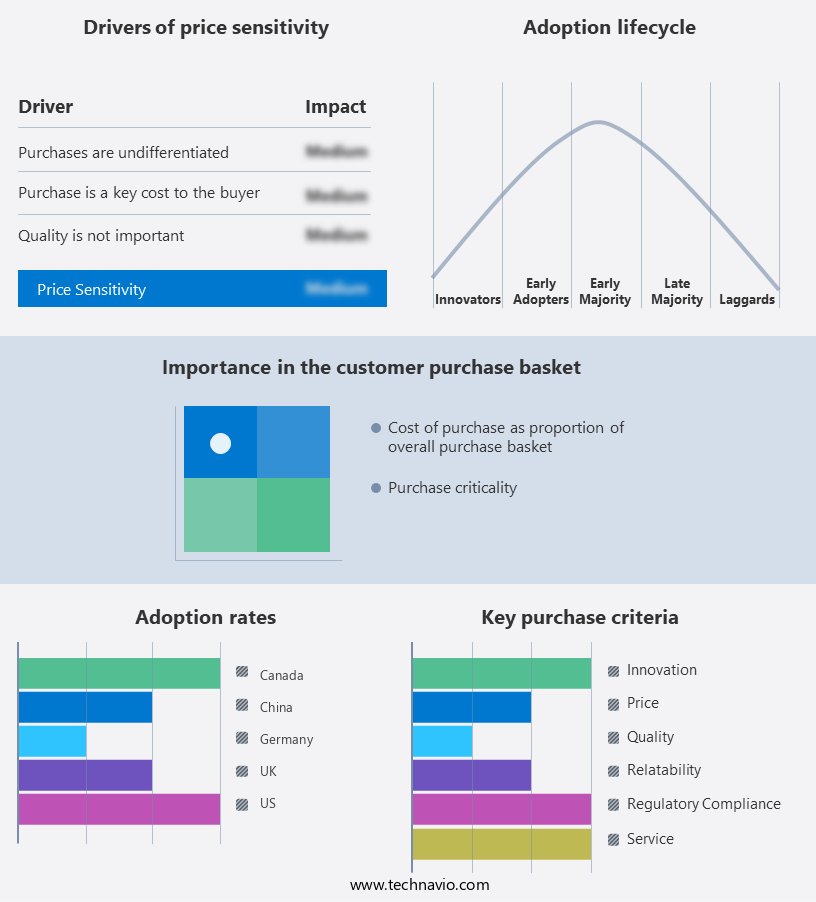
Exclusive Customer Landscape
The retail banking it spending market forecasting report includes the adoption lifecycle of the market, covering from the innovator’s stage to the laggard’s stage. It focuses on adoption rates in different regions based on penetration. Furthermore, the retail banking it spending market report also includes key purchase criteria and drivers of price sensitivity to help companies evaluate and develop their market growth analysis strategies.
Customer Landscape
Key Companies & Market Insights
Companies are implementing various strategies, such as strategic alliances, retail banking it spending market forecast, partnerships, mergers and acquisitions, geographical expansion, and product/service launches, to enhance their presence in the industry.
Accenture PLC - The company provides comprehensive banking solutions encompassing payments, core banking, credit, banking cloud, open banking, and sustainable banking services. This approach ensures enhanced search engine visibility and caters to a global clientele, aligning with our commitment to delivering innovative and forward-thinking financial solutions.
The industry research and growth report includes detailed analyses of the competitive landscape of the market and information about key companies, including:
- Accenture PLC
- Atos SE
- Capgemini Services SAS
- CGI Inc.
- Cisco Systems Inc.
- Cognizant Technology Solutions Corp.
- Dell Technologies Inc.
- Fidelity National Information Services Inc.
- Fujitsu Ltd.
- Genpact Ltd.
- HCL Technologies Ltd.
- Hitachi Ltd.
- HP Inc.
- Infosys Ltd.
- Intel Corp.
- International Business Machines Corp.
- Microsoft Corp.
- NetApp Inc.
- Oracle Corp.
- SAP SE
- Wipro Ltd.
- WNS Holdings Ltd.
Qualitative and quantitative analysis of companies has been conducted to help clients understand the wider business environment as well as the strengths and weaknesses of key industry players. Data is qualitatively analyzed to categorize companies as pure play, category-focused, industry-focused, and diversified; it is quantitatively analyzed to categorize companies as dominant, leading, strong, tentative, and weak.
Research Analyst Overview
Retail banking IT spending continues to be a significant area of investment for financial institutions as they navigate the dynamic market landscape. The banking industry is characterized by various market dynamics, including inflationary pressure and economic developments, which influence IT spending patterns. IT technology plays a crucial role in retail banking, as institutions strive to enhance customer experience and remain competitive. Service propositions are increasingly focused on providing seamless digital experiences, with online transaction systems, mobile banking, and digital banking becoming the norm. The retail banking IT workforce is evolving to meet the demands of these technological advancements.
Cloud spending is a growing trend, with institutions moving towards cloud-native ecosystems and infrastructure as code to improve operational efficiency and reduce costs. Consumer preferences are driving the adoption of advanced technologies such as artificial intelligence (AI), data analytics, and blockchain technology. These technologies enable institutions to offer personalized services, improve fraud protection, and enhance identity management. Production volume and revenue streams are also impacted by technological advancements. Banks must invest in IT services to ensure customer support is available around the clock and to maintain online and mobile banking platforms. Competitive position is a key consideration for retail banks, as external stimuli continue to shape the market.
Operational efficiency is essential to remain competitive, and institutions are turning to IT spending to streamline processes and improve value proposition. Technological advancements are not without challenges, however. Threat detection and prevention technologies are necessary to protect against cyber threats and maintain customer trust. Data encryption and data privacy are also critical areas of focus. In , retail banking IT spending is a critical area of investment for financial institutions. Institutions must adapt to changing market dynamics, consumer preferences, and technological advancements to remain competitive and provide a superior customer experience. IT spending on cloud migration, containerization technologies, AI, data analytics, and cybersecurity measures will continue to be key areas of focus.
|
Market Scope |
|
|
Report Coverage |
Details |
|
Page number |
225 |
|
Base year |
2024 |
|
Historic period |
2019-2023 |
|
Forecast period |
2025-2029 |
|
Growth momentum & CAGR |
Accelerate at a CAGR of 4.6% |
|
Market growth 2025-2029 |
USD 14.64 billion |
|
Market structure |
Fragmented |
|
YoY growth 2024-2025(%) |
4.4 |
|
Key countries |
US, Canada, China, Germany, UK, Japan, France, India, Italy, and The Netherlands |
|
Competitive landscape |
Leading Companies, Market Positioning of Companies, Competitive Strategies, and Industry Risks |
What are the Key Data Covered in this Retail Banking IT Spending Market Research and Growth Report?
- CAGR of the Retail Banking IT Spending industry during the forecast period
- Detailed information on factors that will drive the growth and forecasting between 2025 and 2029
- Precise estimation of the size of the market and its contribution of the industry in focus to the parent market
- Accurate predictions about upcoming growth and trends and changes in consumer behaviour
- Growth of the market across North America, Europe, APAC, Middle East and Africa, and South America
- Thorough analysis of the market’s competitive landscape and detailed information about companies
- Comprehensive analysis of factors that will challenge the retail banking it spending market growth of industry companies
We can help! Our analysts can customize this retail banking it spending market research report to meet your requirements.
 RIA -
RIA - 
