Reverse Osmosis System Market Size and Growth Forecast 2026-2030
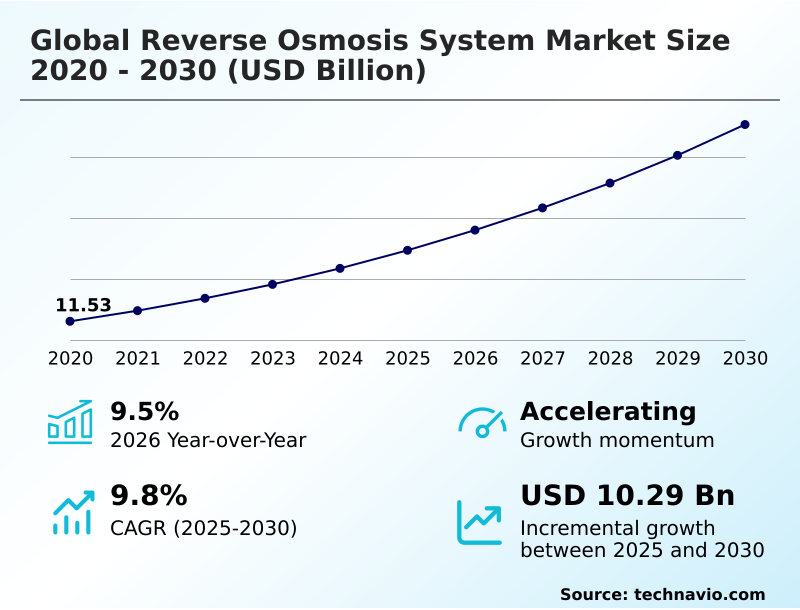
The Reverse Osmosis System Market size was valued at USD 17.34 billion in 2025 growing at a CAGR of 9.8% during the forecast period 2026-2030.
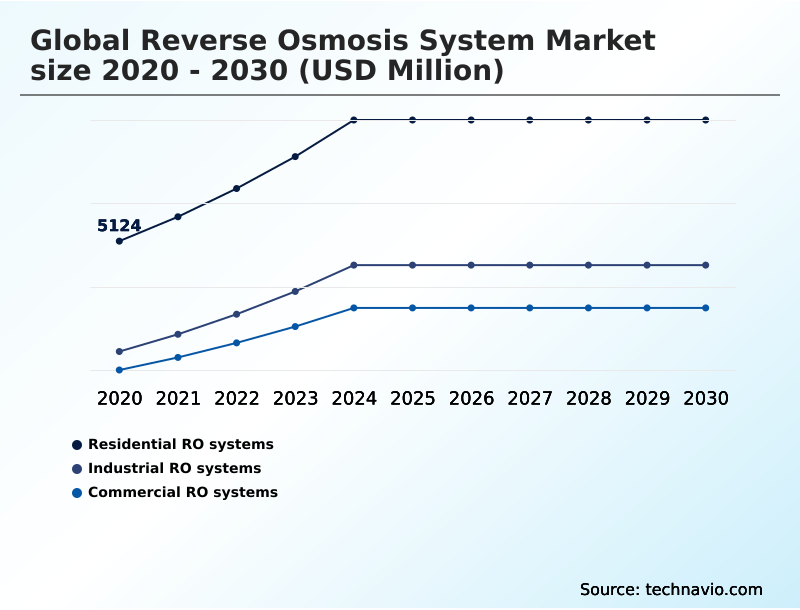
APAC accounts for 45.9% of incremental growth during the forecast period. The Residential RO systems segment by Product Type was valued at USD 7.07 billion in 2024, while the Point of use (POU) systems segment holds the largest revenue share by Type.
The market is projected to grow by USD 16.10 billion from 2020 to 2030, with USD 10.29 billion of the growth expected during the forecast period of 2025 to 2030.
Get Key Insights on Market Forecast (PDF) Request Free Sample
Reverse Osmosis System Market Overview
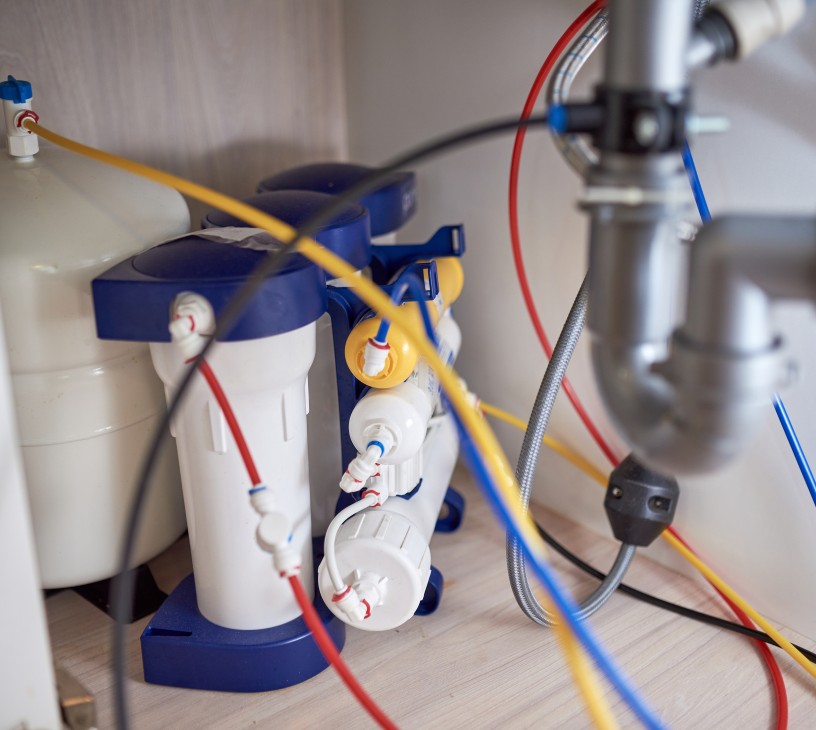
The reverse osmosis system market is advancing due to stringent industrial water quality mandates and the critical need for potable water. Contributing 45.9% of incremental growth, APAC leads this expansion, driven by rapid industrialization. North America follows, with a focus on upgrading aging infrastructure and addressing emerging contaminants. In practice, a pharmaceutical manufacturing facility deploying a multi-stage system with pre-treatment protocols and thin film composite membranes achieves the ultra-pure water generation required by FDA regulations, ensuring product sterility and eliminating batch contamination risks. This reliance on high-performance filtration, capable of superior dissolved solids removal, underpins capital investment decisions. The market's year-over-year growth of 9.5% reflects the escalating global dependence on technologies like brackish water desalination and industrial effluent treatment to secure water supplies, pushing innovation in areas like high pressure pumps and membrane material science.
Drivers, Trends, and Challenges in the Reverse Osmosis System Market
Strategic procurement in the reverse osmosis system market requires a detailed evaluation beyond initial capital costs, focusing on total cost of ownership. Decision-makers assessing the cost of residential ro systems must weigh membrane lifespan and replacement frequency against the benefits of consistent water quality.
For commercial ro systems water quality is paramount, particularly in hospitality and healthcare, where it directly impacts operational compliance and equipment longevity. Industrial ro systems for pharma applications demand the highest level of purification, governed by stringent FDA and EMA standards for ultra-pure water generation.
The benefits of point of entry poe systems, which provide whole-house filtration, include protecting plumbing and appliances from scale buildup, a crucial factor in hard water areas. In contrast, the best point of use pou systems offer targeted, high-purity water for drinking and cooking.
As energy consumption can account for over 40% of a desalination plant's operating budget, the selection of energy-efficient high pressure pumps and energy recovery devices is critical for operational viability. Choosing the best industrial ro system involves balancing performance, compliance with standards like ISO 14001, and long-term maintenance costs.
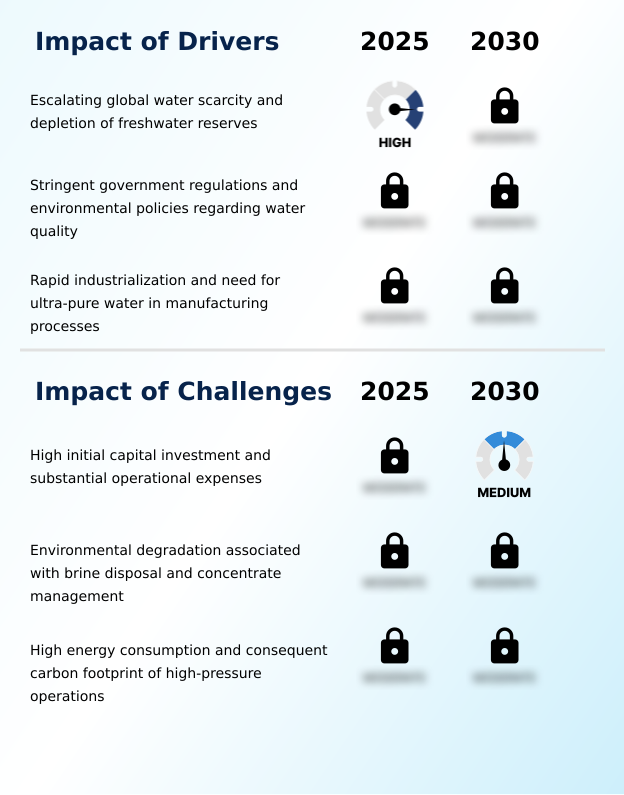
Primary Growth Driver: Escalating global water scarcity and the depletion of freshwater reserves are primary drivers for the adoption of reverse osmosis systems worldwide.
Market growth is fundamentally driven by a convergence of environmental and industrial pressures. Escalating global water scarcity compels investment in alternative water sources, making seawater reverse osmosis and brackish water desalination essential for municipal water treatment in arid regions.
APAC, accounting for 45.9% of incremental growth, exemplifies this trend as rapid industrialization creates immense demand for industrial effluent treatment. Stringent government regulations, including zero liquid discharge mandates, force industries to adopt advanced water reclamation technologies.
Sectors like semiconductor and pharmaceutical manufacturing require ultra-pure water generation, a standard that only sophisticated systems with effective pre-treatment protocols can meet.
This non-negotiable need for high-purity water solidifies the demand for reverse osmosis technology as a cornerstone of modern industry and public health infrastructure.
Emerging Market Trend: The integration of AI and IoT for predictive maintenance is transforming reverse osmosis system operations. This shift from reactive to proactive strategies optimizes performance and minimizes downtime.
Key trends are reshaping the operational efficiency and sustainability of reverse osmosis systems. The integration of AI and IoT enables predictive maintenance on components like high pressure pumps, shifting from reactive repairs to proactive asset management and extending the lifespan of thin film composite membranes. This digitalization optimizes water flux and reduces energy consumption.
Concurrently, the adoption of renewable energy sources, particularly solar, is decoupling desalination from fossil fuel-dependent grids, addressing a major historical criticism. In material science, the development of advanced materials such as graphene oxide membranes and biomimetic membranes promises higher permeability and enhanced fouling resistance.
These innovations in nanofiltration technology are lowering operating pressures and improving overall system efficiency, making advanced water purification more economically and environmentally sustainable across industrial and municipal applications.
Key Industry Challenge: The high initial capital investment required and substantial ongoing operational expenses present a key challenge to the widespread adoption of reverse osmosis technology.
Significant challenges constrain wider market adoption, primarily centered on economic and environmental factors. The high initial capital investment for systems and the substantial operational expenses, particularly the energy consumption of high pressure pumps, create a formidable barrier for many municipalities and businesses.
This is compounded by the environmental dilemma of brine concentrate management, as discharging hypersaline brine can damage local marine ecosystems, leading to stricter regulations and costly disposal solutions. Furthermore, the operational challenge of membrane fouling requires frequent chemical cleaning and eventual replacement, adding to the total cost of ownership.
These factors necessitate a careful evaluation of system viability, especially in economically sensitive regions, and drive industry focus toward developing more energy-efficient and low-fouling technologies like advanced semipermeable membrane designs.
Explore Full Market Dynamics Analysis Request Free Sample
Reverse Osmosis System Market Segmentation
The reverse osmosis system industry research report provides comprehensive data including region-wise segment analysis, with forecasts and analysis for the period 2026-2030, as well as historical data from 2020-2024 for the following segments.
Product Type Segment Analysis
The residential ro systems segment is estimated to witness significant growth during the forecast period.
The residential RO systems segment is expanding as homeowners increasingly seek point of use filtration to mitigate concerns over municipal water quality and aging infrastructure.
This demand is not limited to taste and odor improvement; it reflects a proactive stance on health, targeting contaminants like heavy metals and dissolved solids.
Manufacturers are innovating to address historical drawbacks, focusing on improving water recovery rates and reducing wastewater, which is a key factor in procurement decisions.
Accounting for a substantial part of the market, this segment's growth is fueled by rising disposable incomes and a shift toward domestic wellness investments, making features like real-time quality monitoring and simplified filter replacement standard expectations.
Effective contaminant rejection rates remain a primary benchmark for both thin film composite membranes and alternative materials used in these compact units.
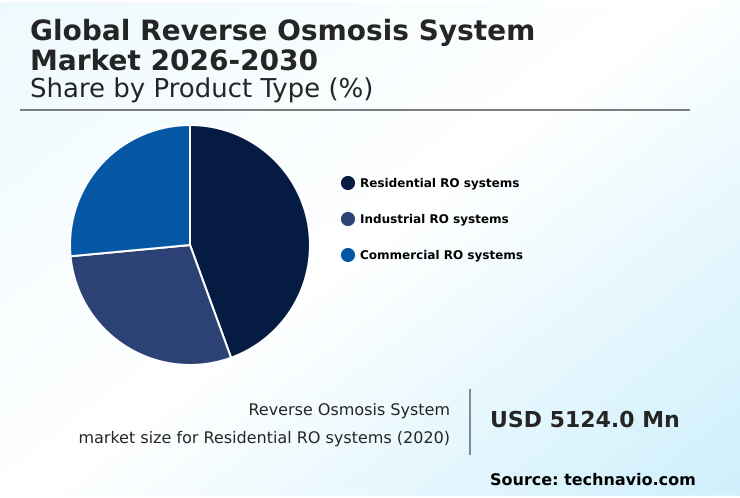
The Residential RO systems segment was valued at USD 7.07 billion in 2024 and showed a gradual increase during the forecast period.
Reverse Osmosis System Market by Region: APAC Leads with 45.9% Growth Share
APAC is estimated to contribute 45.9% to the growth of the global market during the forecast period.
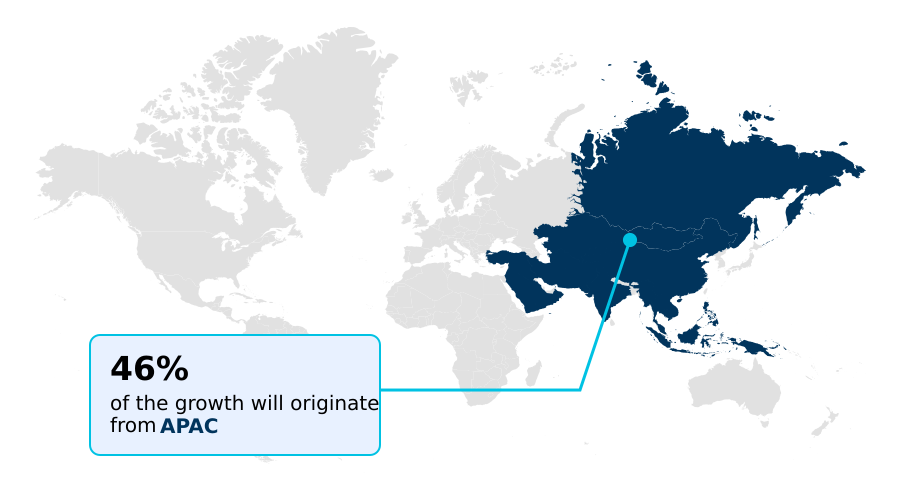
The geographic landscape is dominated by APAC, which accounts for 45.9% of the market's incremental growth, fueled by industrial expansion and municipal water projects in China and India.
In these regions, the demand for industrial ro systems is driven by manufacturing and power generation needs.
In contrast, the market in North America, contributing 21.31% of growth, is characterized by infrastructure upgrades to tackle issues like PFAS contamination and investments in brackish water desalination in water-stressed states.
Europe focuses on sustainability, applying reverse osmosis to achieve circular economy goals and comply with stringent EU directives on water reuse. The Middle East remains a key region for large-scale seawater reverse osmosis projects, essential for providing potable water.
This regional divergence shapes demand for different system types, from massive desalination plants to decentralized point of use filtration units.
Customer Landscape Analysis for the Reverse Osmosis System Market
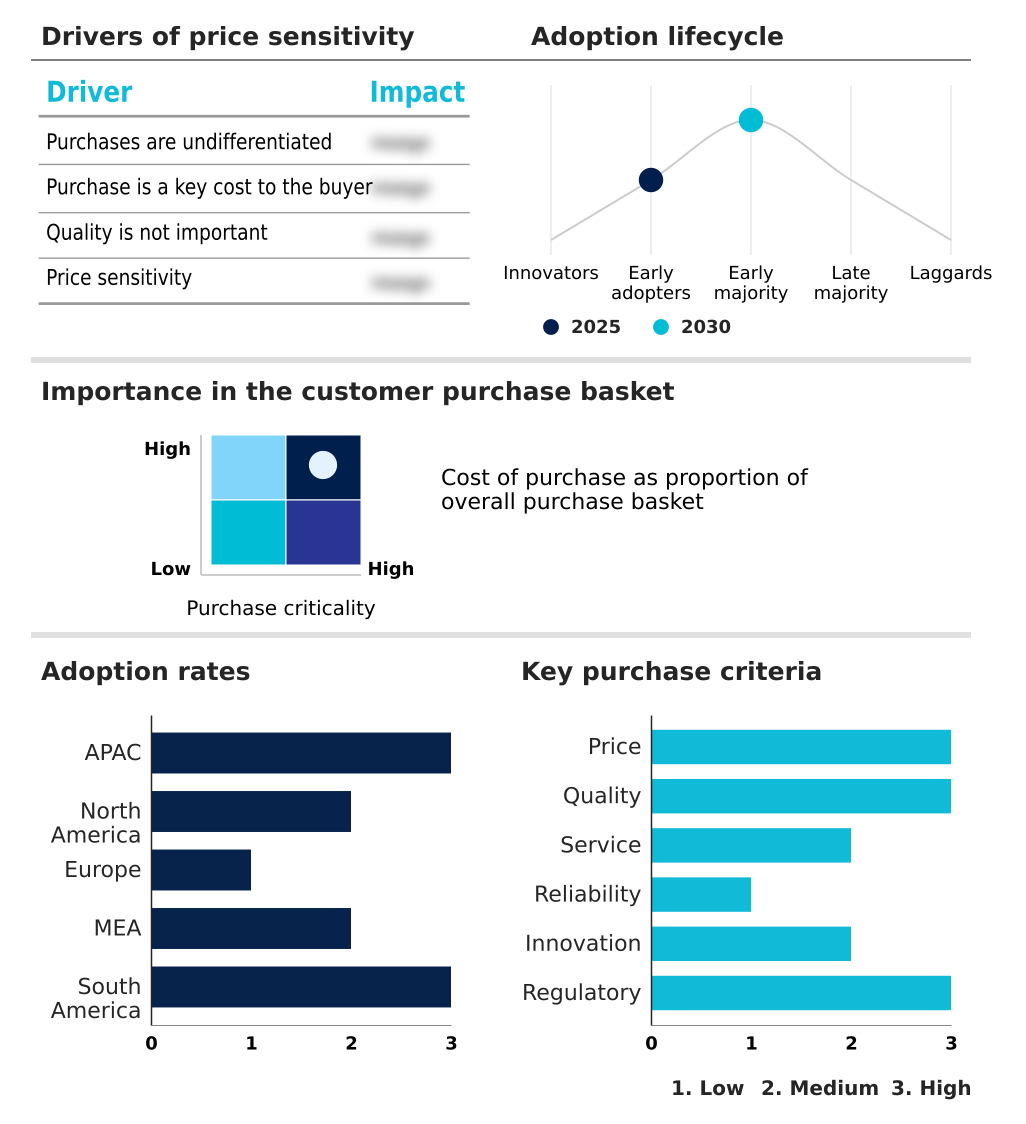
The reverse osmosis system market forecasting report includes the adoption lifecycle of the market, covering from the innovator’s stage to the laggard’s stage. It focuses on adoption rates in different regions based on penetration. Furthermore, the reverse osmosis system market report also includes key purchase criteria and drivers of price sensitivity to help companies evaluate and develop their market growth analysis strategies.
Competitive Landscape of the Reverse Osmosis System Market
Companies are implementing various strategies, such as strategic alliances, partnerships, mergers and acquisitions, geographical expansion, and product/service launches, to enhance their presence in the reverse osmosis system market industry.
A. O. Smith Corp. - Vendors offer tailored reverse osmosis solutions, from compact residential units to large-scale industrial systems, focusing on application-specific performance and total cost of ownership.
The industry research and growth report includes detailed analyses of the competitive landscape of the market and information about key companies, including:
- A. O. Smith Corp.
- Applied Membranes Inc.
- AXEON Water Technologies
- BWT Holding GmbH
- Coway Co. Ltd.
- Culligan International Co.
- DuPont de Nemours Inc.
- Hydranautics
- Kinetico Inc.
- Kovalus Separation Solutions
- Kurita America
- Lenntech BV
- LG Chem Ltd.
- Pall Corp.
- Pentair Plc
- Toray Industries Inc.
- Toyobo Co. Ltd.
- Veolia Water Technologies
- Watts Water Technologies Inc.
- Xylem Inc.
Qualitative and quantitative analysis of companies has been conducted to help clients understand the wider business environment as well as the strengths and weaknesses of key industry players. Data is qualitatively analyzed to categorize companies as pure play, category-focused, industry-focused, and diversified; it is quantitatively analyzed to categorize companies as dominant, leading, strong, tentative, and weak.
Recent Developments in the Reverse Osmosis System Market
- In October 2024, Xylem Inc. announced the acquisition of Aqua-Pure Technologies, a startup specializing in AI-driven predictive maintenance software for membrane systems, for USD 75 million to enhance its digital water solutions portfolio.
- In January 2025, the California Department of Water Resources began construction on the new Pacific Desalination Plant in Monterey County, a USD 1.2 billion project utilizing advanced reverse osmosis technology from DuPont to produce 50 million gallons of drinking water per day.
- In February 2025, Veolia Water Technologies introduced the RO-Boost Ultra system, a next-generation reverse osmosis solution designed to significantly reduce energy usage and improve efficiency in industrial desalination applications.
- In March 2025, Toray Industries Inc. rolled out a new seawater reverse osmosis membrane series, the TML20-440, featuring higher flux and improved fouling resistance, aiming to cut energy use by up to 10% in large-scale desalination plants.
Research Analyst Overview: Reverse Osmosis System Market
Operational viability in the reverse osmosis system market is increasingly tied to advancements in material science and energy efficiency, moving beyond traditional filtration metrics. The adoption of next-generation materials like aquaporin proteins and graphene oxide membranes is reshaping capital expenditure strategies, as these technologies promise lower operating pressures and reduced membrane fouling.
Boardroom decisions on asset upgrades now weigh the higher initial cost of biomimetic membranes against long-term gains from reduced chemical cleaning and lower energy consumption from high pressure pumps. With the residential segment comprising a significant portion of the market, consumer-facing innovations in point of use filtration are also critical.
For industrial operators, compliance with zero liquid discharge mandates under frameworks like the EU's Industrial Emissions Directive necessitates sophisticated brine concentrate management and water reclamation strategies. This makes the selection of robust pre-treatment protocols and durable thin film composite membranes a crucial factor in maintaining operational licenses and minimizing environmental liabilities.
Dive into Technavio’s robust research methodology, blending expert interviews, extensive data synthesis, and validated models for unparalleled Reverse Osmosis System Market insights. See full methodology.
| Market Scope | |
|---|---|
| Page number | 297 |
| Base year | 2025 |
| Historic period | 2020-2024 |
| Forecast period | 2026-2030 |
| Growth momentum & CAGR | Accelerate at a CAGR of 9.8% |
| Market growth 2026-2030 | USD 10285.5 million |
| Market structure | Fragmented |
| YoY growth 2025-2026(%) | 9.5% |
| Key countries | China, India, Japan, South Korea, Australia, Indonesia, US, Canada, Mexico, Germany, UK, France, Italy, The Netherlands, Spain, Saudi Arabia, UAE, South Africa, Israel, Turkey, Brazil, Argentina and Colombia |
| Competitive landscape | Leading Companies, Market Positioning of Companies, Competitive Strategies, and Industry Risks |
Reverse Osmosis System Market: Key Questions Answered in This Report
-
What is the expected growth of the Reverse Osmosis System Market between 2026 and 2030?
-
The Reverse Osmosis System Market is expected to grow by USD 10.29 billion during 2026-2030, registering a CAGR of 9.8%. Year-over-year growth in 2026 is estimated at 9.5%%. This acceleration is shaped by escalating global water scarcity and depletion of freshwater reserves, which is intensifying demand across multiple end-use verticals covered in the report.
-
-
What segmentation does the market report cover?
-
The report is segmented by Product Type (Residential RO systems, Industrial RO systems, and Commercial RO systems), Type (Point of use (POU) systems, and Point of entry (POE) systems), Material (TFC membranes, Cellulose acetate membranes, and Others) and Geography (APAC, North America, Europe, Middle East and Africa, South America). Among these, the Residential RO systems segment is estimated to witness significant growth during the forecast period, driven by rising adoption across key application areas. Each segment includes detailed qualitative and quantitative analysis, along with historical data from 2020-2024 and forecasts through 2030 with year-over-year growth rates.
-
-
Which regions are analyzed in the report?
-
The report covers APAC, North America, Europe, Middle East and Africa and South America. APAC is estimated to contribute 45.9% to market growth during the forecast period. Country-level analysis includes China, India, Japan, South Korea, Australia, Indonesia, US, Canada, Mexico, Germany, UK, France, Italy, The Netherlands, Spain, Saudi Arabia, UAE, South Africa, Israel, Turkey, Brazil, Argentina and Colombia, with dedicated market size tables and year-over-year growth for each.
-
-
What are the key growth drivers and market challenges?
-
The primary driver is escalating global water scarcity and depletion of freshwater reserves, which is accelerating investment and industry demand. The main challenge is high initial capital investment and substantial operational expenses, creating operational barriers for key market participants. The report quantifies the impact of each driver and challenge across 2026 and 2030 with comparative analysis.
-
-
Who are the major players in the Reverse Osmosis System Market?
-
Key vendors include A. O. Smith Corp., Applied Membranes Inc., AXEON Water Technologies, BWT Holding GmbH, Coway Co. Ltd., Culligan International Co., DuPont de Nemours Inc., Hydranautics, Kinetico Inc., Kovalus Separation Solutions, Kurita America, Lenntech BV, LG Chem Ltd., Pall Corp., Pentair Plc, Toray Industries Inc., Toyobo Co. Ltd., Veolia Water Technologies, Watts Water Technologies Inc. and Xylem Inc.. The report provides qualitative and quantitative analysis categorizing companies as dominant, leading, strong, tentative, and weak based on their market positioning. Company profiles include business segment analysis, SWOT assessment, key offerings, and recent strategic developments.
-
Reverse Osmosis System Market Research Insights
Market dynamics are shaped by a divergence in regional priorities, with APAC contributing 45.9% of incremental growth compared to North America's 21.31%, largely due to new industrial build-outs versus infrastructure modernization. Industries are under pressure to comply with zero liquid discharge frameworks, compelling investment in advanced industrial effluent treatment and water reclamation systems.
For instance, semiconductor manufacturing facilities depend on sophisticated reverse osmosis configurations to produce ultrapure water, where even trace impurities can compromise microchip fabrication. This need for precision drives continuous innovation in semipermeable membrane technology and contaminant rejection rates.
As a result, procurement decisions are increasingly influenced by total cost of ownership, factoring in energy consumption from high pressure pumps and the longevity of filtration components.
We can help! Our analysts can customize this reverse osmosis system market research report to meet your requirements.
 RIA -
RIA - 
