Factoring Market Analysis, Size, and Forecast 2026-2030: Europe (Germany, Italy, and France), APAC (China, Japan, and India), North America (US, Canada, and Mexico), South America (Brazil, Argentina, and Colombia), Middle East and Africa (Saudi Arabia, UAE, and South Africa), and Rest of World (ROW)

Factoring Market Analysis, Size, and Forecast 2026-2030:
Europe (Germany, Italy, and France), APAC (China, Japan, and India), North America (US, Canada, and Mexico), South America (Brazil, Argentina, and Colombia), Middle East and Africa (Saudi Arabia, UAE, and South Africa), and Rest of World (ROW)

Published: Mar 2026 289 Pages SKU: IRTNTR41066

Market Overview at a Glance

$2506.4 B
Market Opportunity
8.7%
CAGR 2025 - 2030
53.4%
Europe Growth
$2900.5 B
Domestic segment 2024

Factoring Market Size 2026-2030

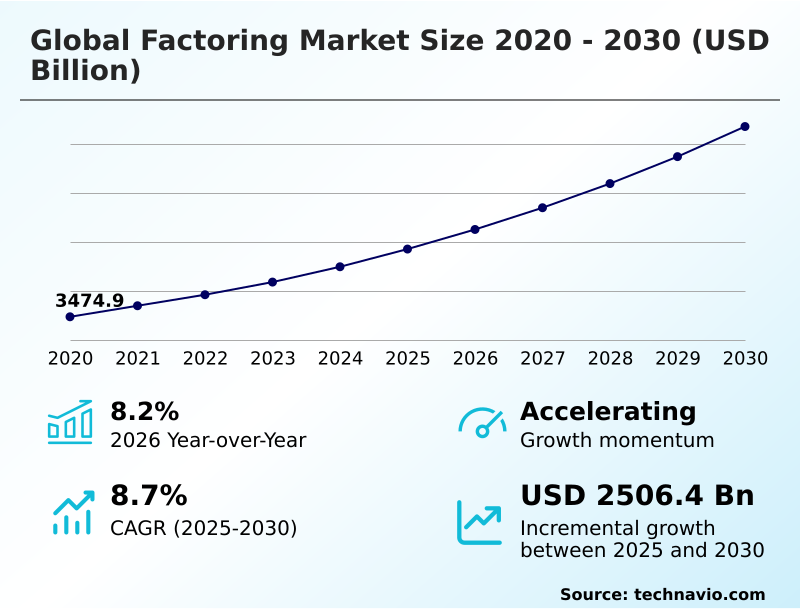
The factoring market size is valued to increase by USD 2506.4 billion, at a CAGR of 8.7% from 2025 to 2030. Growing SME financing and liquidity needs will drive the factoring market.

Major Market Trends & Insights

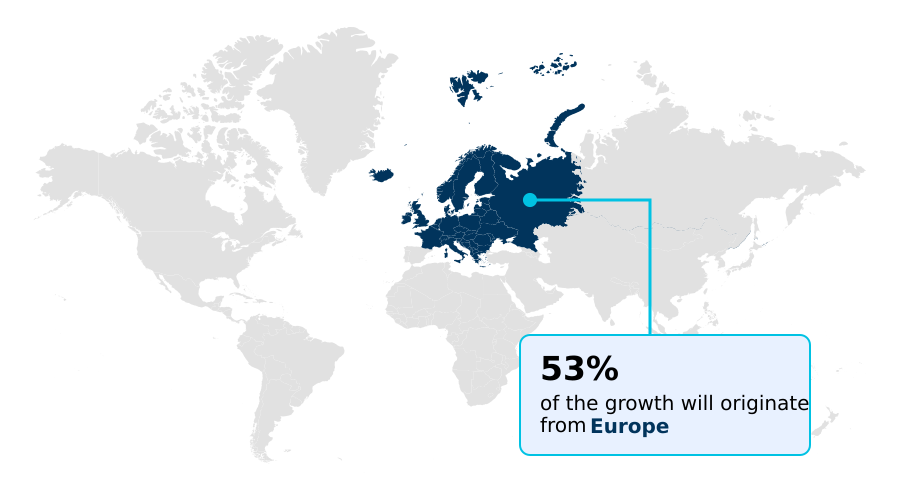
  • Europe dominated the market and accounted for a 53.4% growth during the forecast period.
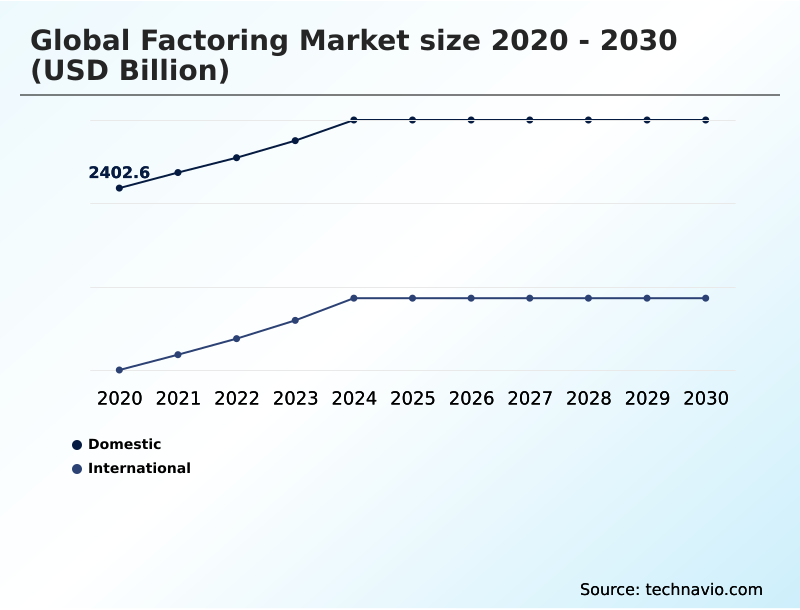
  • By Type - Domestic segment was valued at USD 2900.5 billion in 2024
  • By Application - SMEs segment accounted for the largest market revenue share in 2024

Market Size & Forecast

  • Market Opportunities: USD 3891.7 billion
  • Market Future Opportunities: USD 2506.4 billion
  • CAGR from 2025 to 2030 : 8.7%

Market Summary

  • The factoring market provides essential liquidity management and working capital optimization for businesses globally, moving beyond simple debtor finance to become a strategic tool. The integration of digital factoring platforms and fintech factoring solutions is a primary driver, enabling faster automated underwriting and real-time risk assessment.
  • This digital shift is crucial for sme financing solutions, which often struggle to secure traditional working capital loans. For instance, a mid-sized manufacturer can leverage supply chain finance platforms to offer early payment to its suppliers, strengthening its supply chain while improving its own cash conversion cycle.
  • The market is also seeing a rise in specialized products like freight bill factoring and construction factoring. However, challenges remain, including navigating complex cross-border factoring regulations and competition from other forms of alternative business finance like merchant cash advance.
  • The adoption of e-invoicing integration and b2b payment networks is improving efficiency and transparency, while non-recourse factoring offers vital credit risk mitigation, particularly for exporters. As a result, factoring is increasingly viewed not just as financing, but as a comprehensive service including sales ledger management.

What will be the Size of the Factoring Market during the forecast period?

Get Key Insights on Market Forecast (PDF) Request Free Sample

How is the Factoring Market Segmented?

The factoring industry research report provides comprehensive data (region-wise segment analysis), with forecasts and estimates in "USD billion" for the period 2026-2030, as well as historical data from 2020-2024 for the following segments.

  • Type
    • Domestic
    • International
  • Application
    • SMEs
    • Large enterprise
  • Product type
    • Recourse factoring
    • Non-recourse factoring
  • Geography
    • Europe
      • Germany
      • Italy
      • France
    • APAC
      • China
      • Japan
      • India
    • North America
      • US
      • Canada
      • Mexico
    • South America
      • Brazil
      • Argentina
      • Colombia
    • Middle East and Africa
      • Saudi Arabia
      • UAE
      • South Africa
    • Rest of World (ROW)

By Type Insights

The domestic segment is estimated to witness significant growth during the forecast period.

Domestic factoring is fundamental for business liquidity, focusing on intracountry trade where legal and currency risks are minimal.

The growth in this area is driven by the adoption of digital factoring platforms and fintech factoring solutions that automate invoice verification and debtor credit assessment.

These technologies are making accounts receivable financing more accessible, especially for SMEs seeking working capital optimization. Integration with e-invoicing platforms streamlines sales ledger management, reducing invoice processing times by over 30%.

This evolution enables faster payment cycle acceleration and enhances liquidity management, making it a practical alternative to a traditional business line of credit or working capital loans for businesses with strong domestic customer bases.

Request Free Sample

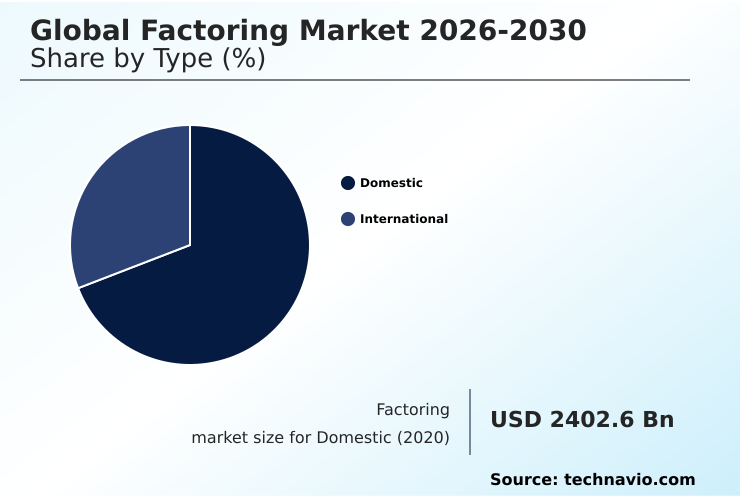
The Domestic segment was valued at USD 2900.5 billion in 2024 and showed a gradual increase during the forecast period.

Request Free Sample

Regional Analysis

Europe is estimated to contribute 53.4% to the growth of the global market during the forecast period.Technavio’s analysts have elaborately explained the regional trends and drivers that shape the market during the forecast period.

See How Factoring Market Demand is Rising in Europe Request Free Sample

The geographic landscape of the factoring market is characterized by Europe’s established dominance, accounting for over 53% of the global opportunity, and the rapid emergence of the APAC region, which is projected to be the fastest-growing.

In Europe, mature markets like Germany and the UK leverage sophisticated digital factoring platforms for working capital optimization.

Meanwhile, APAC's growth, with a CAGR of 9.9%, is fueled by government initiatives promoting sme financing solutions and the digitalization of trade in countries like India and China.

North America remains a key region, with a strong focus on specialized services like freight bill factoring.

The expansion into emerging markets in South America and MEA is driven by the need for cross-border factoring and alternative business finance, facilitated by the growing adoption of e-invoicing integration and fintech factoring solutions.

Market Dynamics

Our researchers analyzed the data with 2025 as the base year, along with the key drivers, trends, and challenges. A holistic analysis of drivers will help companies refine their marketing strategies to gain a competitive advantage.

  • Navigating the factoring landscape requires a strategic approach, starting with how to choose a factoring company that aligns with specific business needs. For businesses engaged in global trade, understanding the benefits of non-recourse factoring for exporters is crucial for risk management.
  • In specialized industries, tailored solutions are becoming paramount; for example, supply chain finance for automotive suppliers helps stabilize complex production chains, while dedicated factoring for transportation and logistics and factoring solutions for manufacturing sector address unique cash flow cycles.
  • The impact of interest rates on factoring costs is a key consideration, often leading businesses to explore digital transformation in receivables finance. Comparing factoring and invoice discounting reveals different levels of control and cost. Technologically, blockchain applications in trade finance and ai for credit risk in factoring are enhancing security and precision.
  • Key processes are being refined, such as automating invoice verification process and improving cash conversion cycle with factoring. As firms expand, understanding cross-border factoring regulations and risk management in international factoring becomes essential. The growth of sme financing options in emerging markets and specialized verticals like factoring for healthcare providers shows the market's adaptability.
  • The e-invoicing impact on factoring efficiency is significant, reducing manual errors by a notable margin compared to paper-based systems. Finally, knowing how to calculate factoring discount rate and the potential of open banking and factoring integration or structuring a reverse factoring program empowers businesses to make informed financial decisions.

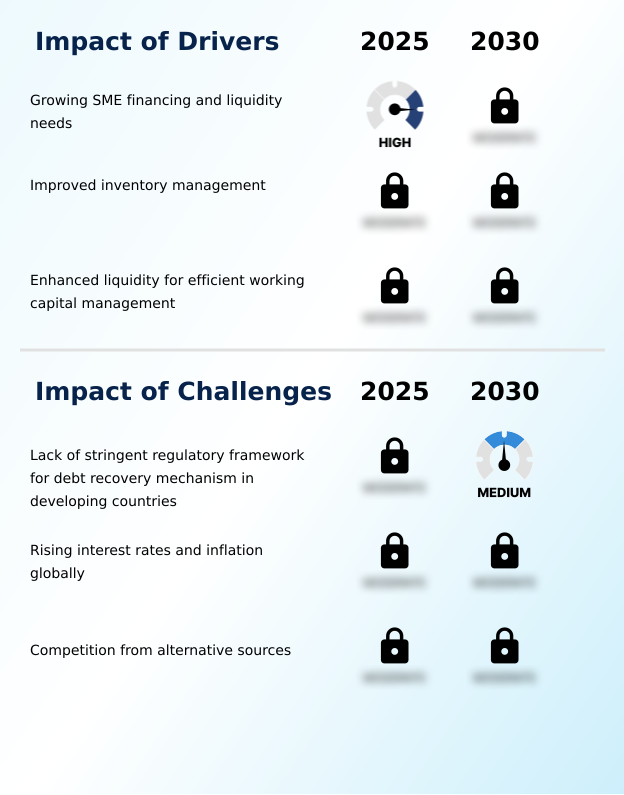
What are the key market drivers leading to the rise in the adoption of Factoring Industry?

  • The growing financing and liquidity needs of small and medium enterprises (SMEs) are a key driver for the market.

  • The primary driver for the market is the persistent need among SMEs for flexible sme cash flow solutions and working capital optimization.
  • These businesses often face challenges securing a business line of credit or small business loans, making accounts receivable financing a vital alternative.
  • The adoption of digital inventory systems has improved visibility into financing gaps, with companies using invoice financing to maintain optimal stock levels reducing stock-outs by over 20%. Enhanced liquidity from factoring enables firms to manage operational costs and pursue growth.
  • The complexity of global trade also fuels demand for export factoring services and import factoring solutions, which mitigate risks associated with cross-border payments.
  • The ease of access provided by online invoice financing platforms, which can approve funding 70% faster than traditional methods, is further accelerating market adoption.

What are the market trends shaping the Factoring Industry?

  • The advent of blockchain in factoring services is a notable trend, introducing transparent data records and secure transaction processing to the traditional ecosystem.

  • Key market trends are centered on digitalization and advanced analytics, reshaping how businesses approach accounts receivable financing. The integration of blockchain in trade finance is a significant development, enhancing transparency and security in cross-border factoring, which has been shown to reduce dispute incidents by up to 25%.
  • Digital factoring platforms are increasingly leveraging AI-powered automated underwriting and fraud detection algorithms, enabling invoice financing companies to approve funding in hours rather than days. This trade finance automation improves the cash conversion cycle for clients.
  • Furthermore, the adoption of open banking framework principles allows for more accurate real-time risk assessment, as factors can analyze live transactional data, improving portfolio performance by 15% in some cases. This shift toward technology-driven sme financing solutions and invoice financing is making the market more efficient and accessible.

What challenges does the Factoring Industry face during its growth?

  • The lack of a stringent regulatory framework for debt recovery mechanisms in developing countries presents a key challenge to industry growth.

  • The market faces significant challenges from a complex regulatory environment and intensifying competition from alternative business finance. Navigating disparate cross-border factoring regulations increases operational costs by up to 15% for firms operating globally. Rising interest rates also compress margins for invoice financing companies.
  • Moreover, the proliferation of substitutes like merchant cash advance, peer-to-peer lending, and trade credit insurance puts pressure on factoring rates and fees. Investment-grade suppliers are often drawn to buyer-led dynamic discounting programs, which can offer better rates than standard invoice discounting.
  • To remain competitive, factoring providers must differentiate through value-added services and seamless e-invoicing integration, as clients now expect more than just a receivables purchase agreement.

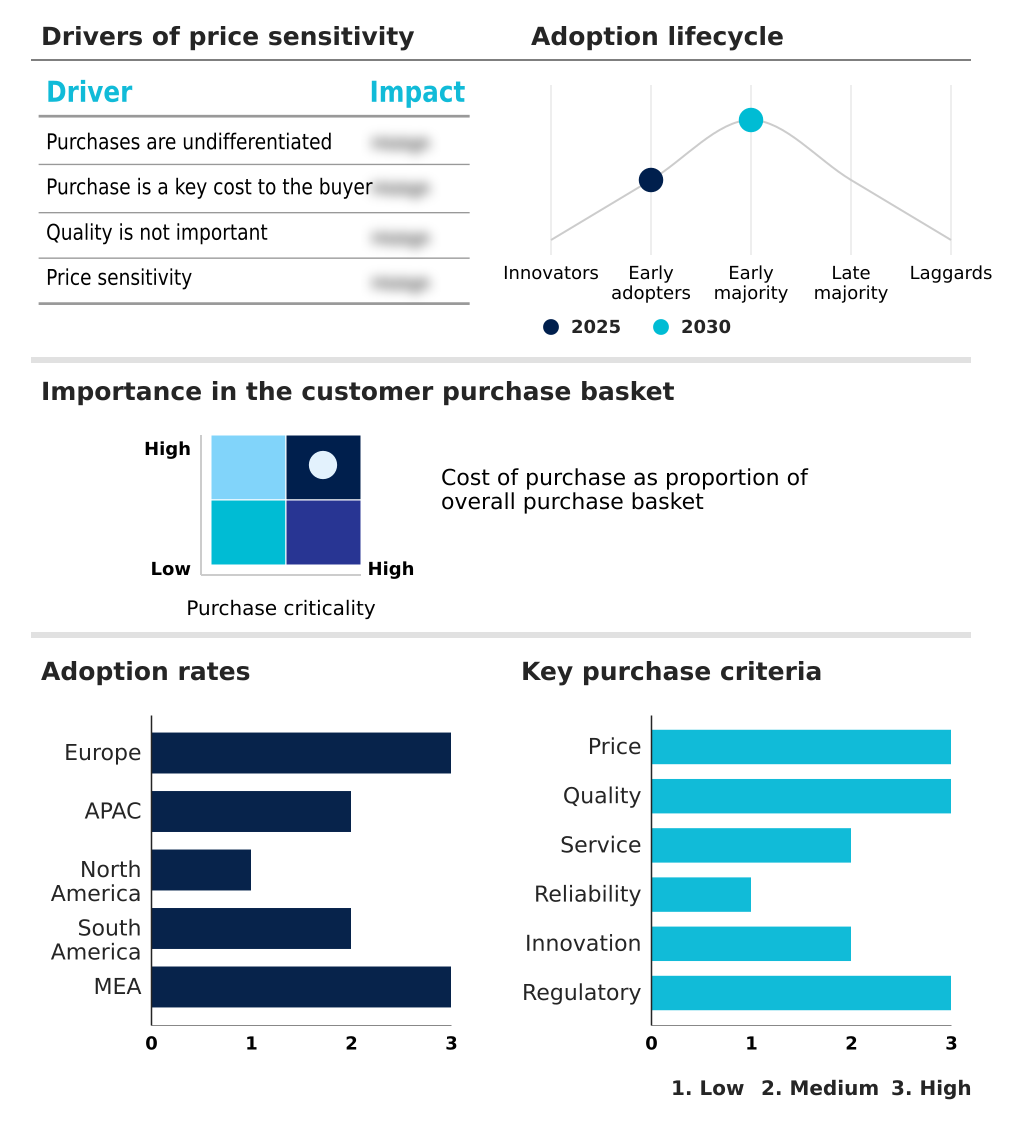
Exclusive Technavio Analysis on Customer Landscape

The factoring market forecasting report includes the adoption lifecycle of the market, covering from the innovator’s stage to the laggard’s stage. It focuses on adoption rates in different regions based on penetration. Furthermore, the factoring market report also includes key purchase criteria and drivers of price sensitivity to help companies evaluate and develop their market growth analysis strategies.

Customer Landscape of Factoring Industry

Competitive Landscape

Companies are implementing various strategies, such as strategic alliances, factoring market forecast, partnerships, mergers and acquisitions, geographical expansion, and product/service launches, to enhance their presence in the industry.

Banco Santander SA - Offers tailored recourse and non-recourse factoring, enhancing liquidity and mitigating credit risk for businesses through comprehensive accounts receivable financing.

The industry research and growth report includes detailed analyses of the competitive landscape of the market and information about key companies, including:

  • Banco Santander SA
  • Barclays PLC
  • Bibby Financial Services Ltd.
  • China Construction Bank
  • Citigroup Inc.
  • Deutsche Factoring Bank GmbH
  • eCapital Corp.
  • Eurobank Ergasias Services
  • First Citizens Bancshares Inc.
  • HSBC Holdings Plc
  • ICICI Bank Ltd.
  • Mitsubishi UFJ Financial Group
  • Mizuho Financial Group Inc.
  • Riviera Finance of Texas Inc.
  • RTS Financial Service Inc.
  • Triumph Financial Inc.
  • UniCredit Factoring S.p.A.
  • Wells Fargo and Co.

Qualitative and quantitative analysis of companies has been conducted to help clients understand the wider business environment as well as the strengths and weaknesses of key industry players. Data is qualitatively analyzed to categorize companies as pure play, category-focused, industry-focused, and diversified; it is quantitatively analyzed to categorize companies as dominant, leading, strong, tentative, and weak.

Recent Development and News in Factoring market

  • In February 2025, MineHub Technologies and Surecomp launched an integrated solution combining real-time supply chain data with invoice financing through the RIVO trade finance hub.
  • In March 2025, the EU Council formally adopted the VAT in the Digital Age (ViDA) package, allowing member states to mandate B2B e-invoicing, which streamlines receivable verification for factoring.
  • In May 2025, the Pan-American Association of Trade and Commerce (PAATC) introduced a Unified Regulatory Framework for Digital Trade Documentation to standardize electronic invoices and bills of lading.
  • In July 2025, the African Export-Import Bank (Afreximbank) launched a mobile-first factoring solution targeting small-scale exporters in East Africa to help close the continent's SME financing gap.

Dive into Technavio’s robust research methodology, blending expert interviews, extensive data synthesis, and validated models for unparalleled Factoring Market insights. See full methodology.

Market Scope
Page number 289
Base year 2025
Historic period 2020-2024
Forecast period 2026-2030
Growth momentum & CAGR Accelerate at a CAGR of 8.7%
Market growth 2026-2030 USD 2506.4 billion
Market structure Fragmented
YoY growth 2025-2026(%) 8.2%
Key countries Germany, Italy, France, UK, Spain, The Netherlands, China, Japan, India, South Korea, Australia, Indonesia, US, Canada, Mexico, Brazil, Argentina, Colombia, Saudi Arabia, UAE, South Africa, Israel and Turkey
Competitive landscape Leading Companies, Market Positioning of Companies, Competitive Strategies, and Industry Risks

Request Free Sample

Research Analyst Overview

  • The factoring market is a dynamic ecosystem for accounts receivable financing, driven by the critical need for working capital optimization and liquidity management. It has evolved beyond traditional debtor finance with the rise of digital factoring platforms offering sophisticated sme financing solutions.
  • Technologies enabling e-invoicing integration, automated underwriting, and real-time risk assessment are now standard, with some providers reducing funding decision times by over 50%. The market offers a diverse product suite, including recourse factoring, non-recourse factoring, and specialized invoice discounting facility options.
  • Supply chain finance and reverse factoring are becoming integral to corporate strategy, optimizing the cash conversion cycle across entire value chains. For boardroom decisions, the choice between recourse factoring and non-recourse factoring is pivotal, directly impacting risk exposure and financial reporting. Offerings like asset-based lending and trade receivables discounting provide further flexibility.
  • Innovations such as b2b payment networks, advanced fraud detection algorithms, and confirming reverse factoring are addressing key industry pain points, while receivables securitization opens new funding avenues. This is complemented by specialized services like freight bill factoring and the management of commercial acceptance drafts, ensuring tailored solutions for various sectors.
  • The focus remains on effective credit risk mitigation and payment cycle acceleration.

What are the Key Data Covered in this Factoring Market Research and Growth Report?

  • What is the expected growth of the Factoring Market between 2026 and 2030?

    • USD 2506.4 billion, at a CAGR of 8.7%

  • What segmentation does the market report cover?

    • The report is segmented by Type (Domestic, and International), Application (SMEs, and Large enterprise), Product Type (Recourse factoring, and Non-recourse factoring) and Geography (Europe, APAC, North America, South America, Middle East and Africa)

  • Which regions are analyzed in the report?

    • Europe, APAC, North America, South America and Middle East and Africa

  • What are the key growth drivers and market challenges?

    • Growing SME financing and liquidity needs , Lack of stringent regulatory framework for debt recovery mechanism in developing countries

  • Who are the major players in the Factoring Market?

    • Banco Santander SA, Barclays PLC, Bibby Financial Services Ltd., China Construction Bank, Citigroup Inc., Deutsche Factoring Bank GmbH, eCapital Corp., Eurobank Ergasias Services, First Citizens Bancshares Inc., HSBC Holdings Plc, ICICI Bank Ltd., Mitsubishi UFJ Financial Group, Mizuho Financial Group Inc., Riviera Finance of Texas Inc., RTS Financial Service Inc., Triumph Financial Inc., UniCredit Factoring S.p.A. and Wells Fargo and Co.

Market Research Insights

  • The market dynamics are shaped by a shift toward more agile alternative business finance models, where technology plays a pivotal role. The adoption of online invoice financing and embedded finance solutions has increased access to capital, with fintech platforms reporting a 35% faster onboarding time compared to traditional methods.
  • SME cash flow solutions are evolving beyond basic invoice selling, incorporating data analytics to offer more competitive factoring rates and fees. For instance, integrated platforms leveraging real-time sales data can reduce credit risk assessment errors by up to 20%. This has intensified the factoring vs bank loan debate, especially for businesses in sectors like construction factoring and transportation.
  • The rise of specialized services for factoring for government contractors and healthcare receivables financing highlights a trend toward niche, value-added offerings.

We can help! Our analysts can customize this factoring market research report to meet your requirements.

Get in touch

1. Executive Summary

1.1 Market overview

Executive Summary - Chart on Market Overview
Executive Summary - Data Table on Market Overview
Executive Summary - Chart on Global Market Characteristics
Executive Summary - Chart on Market by Geography
Executive Summary - Chart on Market Segmentation by Type
Executive Summary - Chart on Market Segmentation by Application
Executive Summary - Chart on Market Segmentation by Product Type
Executive Summary - Chart on Incremental Growth
Executive Summary - Data Table on Incremental Growth
Executive Summary - Chart on Company Market Positioning

2. Technavio Analysis

2.1 Analysis of price sensitivity, lifecycle, customer purchase basket, adoption rates, and purchase criteria

2.2 Criticality of inputs and Factors of differentiation

Chart on Overview on criticality of inputs and factors of differentiation

2.3 Factors of disruption

Chart on Overview on factors of disruption

2.4 Impact of drivers and challenges

Chart on Impact of drivers and challenges in 2025 and 2030

3. Market Landscape

3.1 Market ecosystem

Chart on Parent Market
Data Table on - Parent Market

3.2 Market characteristics

Chart on Market characteristics analysis

3.3 Value chain analysis

Chart on Value chain analysis

4. Market Sizing

4.1 Market definition

Data Table on Offerings of companies included in the market definition

4.2 Market segment analysis

Market segments

4.3 Market size 2025

4.4 Market outlook: Forecast for 2025-2030

Chart on Global - Market size and forecast 2025-2030 ($ billion)
Data Table on Global - Market size and forecast 2025-2030 ($ billion)
Chart on Global Market: Year-over-year growth 2025-2030 (%)
Data Table on Global Market: Year-over-year growth 2025-2030 (%)

5. Historic Market Size

5.1 Global Factoring Market 2020 - 2024

Historic Market Size - Data Table on Global Factoring Market 2020 - 2024 ($ billion)

5.2 Type segment analysis 2020 - 2024

Historic Market Size - Type Segment 2020 - 2024 ($ billion)

5.3 Application segment analysis 2020 - 2024

Historic Market Size - Application Segment 2020 - 2024 ($ billion)

5.4 Product Type segment analysis 2020 - 2024

Historic Market Size - Product Type Segment 2020 - 2024 ($ billion)

5.5 Geography segment analysis 2020 - 2024

Historic Market Size - Geography Segment 2020 - 2024 ($ billion)

5.6 Country segment analysis 2020 - 2024

Historic Market Size - Country Segment 2020 - 2024 ($ billion)

6. Qualitative Analysis

6.1 Impact of AI on Global Factoring Market

7. Five Forces Analysis

7.1 Five forces summary

Five forces analysis - Comparison between 2025 and 2030

7.2 Bargaining power of buyers

Bargaining power of buyers - Impact of key factors 2025 and 2030

7.3 Bargaining power of suppliers

Bargaining power of suppliers - Impact of key factors in 2025 and 2030

7.4 Threat of new entrants

Threat of new entrants - Impact of key factors in 2025 and 2030

7.5 Threat of substitutes

Threat of substitutes - Impact of key factors in 2025 and 2030

7.6 Threat of rivalry

Threat of rivalry - Impact of key factors in 2025 and 2030

7.7 Market condition

Chart on Market condition - Five forces 2025 and 2030

8. Market Segmentation by Type

8.1 Market segments

Chart on Type - Market share 2025-2030 (%)
Data Table on Type - Market share 2025-2030 (%)

8.2 Comparison by Type

Chart on Comparison by Type
Data Table on Comparison by Type

8.3 Domestic - Market size and forecast 2025-2030

Chart on Domestic - Market size and forecast 2025-2030 ($ billion)
Data Table on Domestic - Market size and forecast 2025-2030 ($ billion)
Chart on Domestic - Year-over-year growth 2025-2030 (%)
Data Table on Domestic - Year-over-year growth 2025-2030 (%)

8.4 International - Market size and forecast 2025-2030

Chart on International - Market size and forecast 2025-2030 ($ billion)
Data Table on International - Market size and forecast 2025-2030 ($ billion)
Chart on International - Year-over-year growth 2025-2030 (%)
Data Table on International - Year-over-year growth 2025-2030 (%)

8.5 Market opportunity by Type

Market opportunity by Type ($ billion)
Data Table on Market opportunity by Type ($ billion)

9. Market Segmentation by Application

9.1 Market segments

Chart on Application - Market share 2025-2030 (%)
Data Table on Application - Market share 2025-2030 (%)

9.2 Comparison by Application

Chart on Comparison by Application
Data Table on Comparison by Application

9.3 SMEs - Market size and forecast 2025-2030

Chart on SMEs - Market size and forecast 2025-2030 ($ billion)
Data Table on SMEs - Market size and forecast 2025-2030 ($ billion)
Chart on SMEs - Year-over-year growth 2025-2030 (%)
Data Table on SMEs - Year-over-year growth 2025-2030 (%)

9.4 Large enterprise - Market size and forecast 2025-2030

Chart on Large enterprise - Market size and forecast 2025-2030 ($ billion)
Data Table on Large enterprise - Market size and forecast 2025-2030 ($ billion)
Chart on Large enterprise - Year-over-year growth 2025-2030 (%)
Data Table on Large enterprise - Year-over-year growth 2025-2030 (%)

9.5 Market opportunity by Application

Market opportunity by Application ($ billion)
Data Table on Market opportunity by Application ($ billion)

10. Market Segmentation by Product Type

10.1 Market segments

Chart on Product Type - Market share 2025-2030 (%)
Data Table on Product Type - Market share 2025-2030 (%)

10.2 Comparison by Product Type

Chart on Comparison by Product Type
Data Table on Comparison by Product Type

10.3 Recourse factoring - Market size and forecast 2025-2030

Chart on Recourse factoring - Market size and forecast 2025-2030 ($ billion)
Data Table on Recourse factoring - Market size and forecast 2025-2030 ($ billion)
Chart on Recourse factoring - Year-over-year growth 2025-2030 (%)
Data Table on Recourse factoring - Year-over-year growth 2025-2030 (%)

10.4 Non-recourse factoring - Market size and forecast 2025-2030

Chart on Non-recourse factoring - Market size and forecast 2025-2030 ($ billion)
Data Table on Non-recourse factoring - Market size and forecast 2025-2030 ($ billion)
Chart on Non-recourse factoring - Year-over-year growth 2025-2030 (%)
Data Table on Non-recourse factoring - Year-over-year growth 2025-2030 (%)

10.5 Market opportunity by Product Type

Market opportunity by Product Type ($ billion)
Data Table on Market opportunity by Product Type ($ billion)

11. Customer Landscape

11.1 Customer landscape overview

Analysis of price sensitivity, lifecycle, customer purchase basket, adoption rates, and purchase criteria

12. Geographic Landscape

12.1 Geographic segmentation

Chart on Market share by geography 2025-2030 (%)
Data Table on Market share by geography 2025-2030 (%)

12.2 Geographic comparison

Chart on Geographic comparison
Data Table on Geographic comparison

12.3 Europe - Market size and forecast 2025-2030

Chart on Europe - Market size and forecast 2025-2030 ($ billion)
Data Table on Europe - Market size and forecast 2025-2030 ($ billion)
Chart on Europe - Year-over-year growth 2025-2030 (%)
Data Table on Europe - Year-over-year growth 2025-2030 (%)
Chart on Regional Comparison - Europe
Data Table on Regional Comparison - Europe

12.3.1 Germany - Market size and forecast 2025-2030

Chart on Germany - Market size and forecast 2025-2030 ($ billion)
Data Table on Germany - Market size and forecast 2025-2030 ($ billion)
Chart on Germany - Year-over-year growth 2025-2030 (%)
Data Table on Germany - Year-over-year growth 2025-2030 (%)

12.3.2 Italy - Market size and forecast 2025-2030

Chart on Italy - Market size and forecast 2025-2030 ($ billion)
Data Table on Italy - Market size and forecast 2025-2030 ($ billion)
Chart on Italy - Year-over-year growth 2025-2030 (%)
Data Table on Italy - Year-over-year growth 2025-2030 (%)

12.3.3 France - Market size and forecast 2025-2030

Chart on France - Market size and forecast 2025-2030 ($ billion)
Data Table on France - Market size and forecast 2025-2030 ($ billion)
Chart on France - Year-over-year growth 2025-2030 (%)
Data Table on France - Year-over-year growth 2025-2030 (%)

12.3.4 UK - Market size and forecast 2025-2030

Chart on UK - Market size and forecast 2025-2030 ($ billion)
Data Table on UK - Market size and forecast 2025-2030 ($ billion)
Chart on UK - Year-over-year growth 2025-2030 (%)
Data Table on UK - Year-over-year growth 2025-2030 (%)

12.3.5 Spain - Market size and forecast 2025-2030

Chart on Spain - Market size and forecast 2025-2030 ($ billion)
Data Table on Spain - Market size and forecast 2025-2030 ($ billion)
Chart on Spain - Year-over-year growth 2025-2030 (%)
Data Table on Spain - Year-over-year growth 2025-2030 (%)

12.3.6 The Netherlands - Market size and forecast 2025-2030

Chart on The Netherlands - Market size and forecast 2025-2030 ($ billion)
Data Table on The Netherlands - Market size and forecast 2025-2030 ($ billion)
Chart on The Netherlands - Year-over-year growth 2025-2030 (%)
Data Table on The Netherlands - Year-over-year growth 2025-2030 (%)

12.4 APAC - Market size and forecast 2025-2030

Chart on APAC - Market size and forecast 2025-2030 ($ billion)
Data Table on APAC - Market size and forecast 2025-2030 ($ billion)
Chart on APAC - Year-over-year growth 2025-2030 (%)
Data Table on APAC - Year-over-year growth 2025-2030 (%)
Chart on Regional Comparison - APAC
Data Table on Regional Comparison - APAC

12.4.1 China - Market size and forecast 2025-2030

Chart on China - Market size and forecast 2025-2030 ($ billion)
Data Table on China - Market size and forecast 2025-2030 ($ billion)
Chart on China - Year-over-year growth 2025-2030 (%)
Data Table on China - Year-over-year growth 2025-2030 (%)

12.4.2 Japan - Market size and forecast 2025-2030

Chart on Japan - Market size and forecast 2025-2030 ($ billion)
Data Table on Japan - Market size and forecast 2025-2030 ($ billion)
Chart on Japan - Year-over-year growth 2025-2030 (%)
Data Table on Japan - Year-over-year growth 2025-2030 (%)

12.4.3 India - Market size and forecast 2025-2030

Chart on India - Market size and forecast 2025-2030 ($ billion)
Data Table on India - Market size and forecast 2025-2030 ($ billion)
Chart on India - Year-over-year growth 2025-2030 (%)
Data Table on India - Year-over-year growth 2025-2030 (%)

12.4.4 South Korea - Market size and forecast 2025-2030

Chart on South Korea - Market size and forecast 2025-2030 ($ billion)
Data Table on South Korea - Market size and forecast 2025-2030 ($ billion)
Chart on South Korea - Year-over-year growth 2025-2030 (%)
Data Table on South Korea - Year-over-year growth 2025-2030 (%)

12.4.5 Australia - Market size and forecast 2025-2030

Chart on Australia - Market size and forecast 2025-2030 ($ billion)
Data Table on Australia - Market size and forecast 2025-2030 ($ billion)
Chart on Australia - Year-over-year growth 2025-2030 (%)
Data Table on Australia - Year-over-year growth 2025-2030 (%)

12.4.6 Indonesia - Market size and forecast 2025-2030

Chart on Indonesia - Market size and forecast 2025-2030 ($ billion)
Data Table on Indonesia - Market size and forecast 2025-2030 ($ billion)
Chart on Indonesia - Year-over-year growth 2025-2030 (%)
Data Table on Indonesia - Year-over-year growth 2025-2030 (%)

12.5 North America - Market size and forecast 2025-2030

Chart on North America - Market size and forecast 2025-2030 ($ billion)
Data Table on North America - Market size and forecast 2025-2030 ($ billion)
Chart on North America - Year-over-year growth 2025-2030 (%)
Data Table on North America - Year-over-year growth 2025-2030 (%)
Chart on Regional Comparison - North America
Data Table on Regional Comparison - North America

12.5.1 US - Market size and forecast 2025-2030

Chart on US - Market size and forecast 2025-2030 ($ billion)
Data Table on US - Market size and forecast 2025-2030 ($ billion)
Chart on US - Year-over-year growth 2025-2030 (%)
Data Table on US - Year-over-year growth 2025-2030 (%)

12.5.2 Canada - Market size and forecast 2025-2030

Chart on Canada - Market size and forecast 2025-2030 ($ billion)
Data Table on Canada - Market size and forecast 2025-2030 ($ billion)
Chart on Canada - Year-over-year growth 2025-2030 (%)
Data Table on Canada - Year-over-year growth 2025-2030 (%)

12.5.3 Mexico - Market size and forecast 2025-2030

Chart on Mexico - Market size and forecast 2025-2030 ($ billion)
Data Table on Mexico - Market size and forecast 2025-2030 ($ billion)
Chart on Mexico - Year-over-year growth 2025-2030 (%)
Data Table on Mexico - Year-over-year growth 2025-2030 (%)

12.6 South America - Market size and forecast 2025-2030

Chart on South America - Market size and forecast 2025-2030 ($ billion)
Data Table on South America - Market size and forecast 2025-2030 ($ billion)
Chart on South America - Year-over-year growth 2025-2030 (%)
Data Table on South America - Year-over-year growth 2025-2030 (%)
Chart on Regional Comparison - South America
Data Table on Regional Comparison - South America

12.6.1 Brazil - Market size and forecast 2025-2030

Chart on Brazil - Market size and forecast 2025-2030 ($ billion)
Data Table on Brazil - Market size and forecast 2025-2030 ($ billion)
Chart on Brazil - Year-over-year growth 2025-2030 (%)
Data Table on Brazil - Year-over-year growth 2025-2030 (%)

12.6.2 Argentina - Market size and forecast 2025-2030

Chart on Argentina - Market size and forecast 2025-2030 ($ billion)
Data Table on Argentina - Market size and forecast 2025-2030 ($ billion)
Chart on Argentina - Year-over-year growth 2025-2030 (%)
Data Table on Argentina - Year-over-year growth 2025-2030 (%)

12.6.3 Colombia - Market size and forecast 2025-2030

Chart on Colombia - Market size and forecast 2025-2030 ($ billion)
Data Table on Colombia - Market size and forecast 2025-2030 ($ billion)
Chart on Colombia - Year-over-year growth 2025-2030 (%)
Data Table on Colombia - Year-over-year growth 2025-2030 (%)

12.7 Middle East and Africa - Market size and forecast 2025-2030

Chart on Middle East and Africa - Market size and forecast 2025-2030 ($ billion)
Data Table on Middle East and Africa - Market size and forecast 2025-2030 ($ billion)
Chart on Middle East and Africa - Year-over-year growth 2025-2030 (%)
Data Table on Middle East and Africa - Year-over-year growth 2025-2030 (%)
Chart on Regional Comparison - Middle East and Africa
Data Table on Regional Comparison - Middle East and Africa

12.7.1 Saudi Arabia - Market size and forecast 2025-2030

Chart on Saudi Arabia - Market size and forecast 2025-2030 ($ billion)
Data Table on Saudi Arabia - Market size and forecast 2025-2030 ($ billion)
Chart on Saudi Arabia - Year-over-year growth 2025-2030 (%)
Data Table on Saudi Arabia - Year-over-year growth 2025-2030 (%)

12.7.2 UAE - Market size and forecast 2025-2030

Chart on UAE - Market size and forecast 2025-2030 ($ billion)
Data Table on UAE - Market size and forecast 2025-2030 ($ billion)
Chart on UAE - Year-over-year growth 2025-2030 (%)
Data Table on UAE - Year-over-year growth 2025-2030 (%)

12.7.3 South Africa - Market size and forecast 2025-2030

Chart on South Africa - Market size and forecast 2025-2030 ($ billion)
Data Table on South Africa - Market size and forecast 2025-2030 ($ billion)
Chart on South Africa - Year-over-year growth 2025-2030 (%)
Data Table on South Africa - Year-over-year growth 2025-2030 (%)

12.7.4 Israel - Market size and forecast 2025-2030

Chart on Israel - Market size and forecast 2025-2030 ($ billion)
Data Table on Israel - Market size and forecast 2025-2030 ($ billion)
Chart on Israel - Year-over-year growth 2025-2030 (%)
Data Table on Israel - Year-over-year growth 2025-2030 (%)

12.7.5 Turkey - Market size and forecast 2025-2030

Chart on Turkey - Market size and forecast 2025-2030 ($ billion)
Data Table on Turkey - Market size and forecast 2025-2030 ($ billion)
Chart on Turkey - Year-over-year growth 2025-2030 (%)
Data Table on Turkey - Year-over-year growth 2025-2030 (%)

12.8 Market opportunity by geography

Market opportunity by geography ($ billion)
Data Tables on Market opportunity by geography ($ billion)

13. Drivers, Challenges, and Opportunity

13.1 Market drivers

Growing SME financing and liquidity needs
Improved inventory management
Enhanced liquidity for efficient working capital management

13.2 Market challenges

Lack of stringent regulatory framework for debt recovery mechanism in developing countries
Rising interest rates and inflation globally
Competition from alternative sources

13.3 Impact of drivers and challenges

Impact of drivers and challenges in 2025 and 2030

13.4 Market opportunities

Advent of blockchain in factoring services
Growing adoption of digital platforms for factoring
Adoption of structuring and pricing tools

14. Competitive Landscape

14.1 Overview

14.2

Overview on criticality of inputs and factors of differentiation

14.3 Landscape disruption

Overview on factors of disruption

14.4 Industry risks

Impact of key risks on business

15. Competitive Analysis

15.1 Companies profiled

Companies covered

15.2 Company ranking index

15.3 Market positioning of companies

Matrix on companies position and classification

15.4 Banco Santander SA

Banco Santander SA - Overview
Banco Santander SA - Business segments
Banco Santander SA - Key offerings
Banco Santander SA - Segment focus
SWOT

15.5 Barclays PLC

Barclays PLC - Overview
Barclays PLC - Product / Service
Barclays PLC - Key offerings
SWOT

15.6 Bibby Financial Services Ltd.

Bibby Financial Services Ltd. - Overview
Bibby Financial Services Ltd. - Product / Service
Bibby Financial Services Ltd. - Key offerings
SWOT

15.7 China Construction Bank

China Construction Bank - Overview
China Construction Bank - Business segments
China Construction Bank - Key offerings
China Construction Bank - Segment focus
SWOT

15.8 Citigroup Inc.

Citigroup Inc. - Overview
Citigroup Inc. - Business segments
Citigroup Inc. - Key news
Citigroup Inc. - Key offerings
Citigroup Inc. - Segment focus
SWOT

15.9 Deutsche Factoring Bank GmbH

Deutsche Factoring Bank GmbH - Overview
Deutsche Factoring Bank GmbH - Product / Service
Deutsche Factoring Bank GmbH - Key offerings
SWOT

15.10 eCapital Corp.

eCapital Corp. - Overview
eCapital Corp. - Product / Service
eCapital Corp. - Key offerings
SWOT

15.11 Eurobank Ergasias Services

Eurobank Ergasias Services - Overview
Eurobank Ergasias Services - Business segments
Eurobank Ergasias Services - Key offerings
Eurobank Ergasias Services - Segment focus
SWOT

15.12 First Citizens Bancshares Inc.

First Citizens Bancshares Inc. - Overview
First Citizens Bancshares Inc. - Business segments
First Citizens Bancshares Inc. - Key offerings
First Citizens Bancshares Inc. - Segment focus
SWOT

15.13 HSBC Holdings Plc

HSBC Holdings Plc - Overview
HSBC Holdings Plc - Business segments
HSBC Holdings Plc - Key offerings
HSBC Holdings Plc - Segment focus
SWOT

15.14 ICICI Bank Ltd.

ICICI Bank Ltd. - Overview
ICICI Bank Ltd. - Business segments
ICICI Bank Ltd. - Key offerings
ICICI Bank Ltd. - Segment focus
SWOT

15.15 Mitsubishi UFJ Financial Group

Mitsubishi UFJ Financial Group - Overview
Mitsubishi UFJ Financial Group - Business segments
Mitsubishi UFJ Financial Group - Key offerings
Mitsubishi UFJ Financial Group - Segment focus
SWOT

15.16 Riviera Finance of Texas Inc.

Riviera Finance of Texas Inc. - Overview
Riviera Finance of Texas Inc. - Product / Service
Riviera Finance of Texas Inc. - Key offerings
SWOT

15.17 UniCredit Factoring S.p.A.

UniCredit Factoring S.p.A. - Overview
UniCredit Factoring S.p.A. - Product / Service
UniCredit Factoring S.p.A. - Key offerings
SWOT

15.18 Wells Fargo and Co.

Wells Fargo and Co. - Overview
Wells Fargo and Co. - Business segments
Wells Fargo and Co. - Key offerings
Wells Fargo and Co. - Segment focus
SWOT

16. Appendix

16.1 Scope of the report

Market definition
Objectives
Notes and caveats

16.2 Inclusions and exclusions checklist

Inclusions checklist
Exclusions checklist

16.3 Currency conversion rates for US$

16.4 Research methodology

16.5 Data procurement

Information sources

16.6 Data validation

16.7 Validation techniques employed for market sizing

16.8 Data synthesis

16.9 360 degree market analysis

16.10 List of abbreviations

Research Methodology

Technavio presents a detailed picture of the market by way of study, synthesis, and summation of data from multiple sources. The analysts have presented the various facets of the market with a particular focus on identifying the key industry influencers. The data thus presented is comprehensive, reliable, and the result of extensive research, both primary and secondary.

INFORMATION SOURCES

Primary sources

  • Manufacturers and suppliers
  • Channel partners
  • Industry experts
  • Strategic decision makers

Secondary sources

  • Industry journals and periodicals
  • Government data
  • Financial reports of key industry players
  • Historical data
  • Press releases

DATA ANALYSIS

Data Synthesis

  • Collation of data
  • Estimation of key figures
  • Analysis of derived insights

Data Validation

  • Triangulation with data models
  • Reference against proprietary databases
  • Corroboration with industry experts

REPORT WRITING

Qualitative

  • Market drivers
  • Market challenges
  • Market trends
  • Five forces analysis

Quantitative

  • Market size and forecast
  • Market segmentation
  • Geographical insights
  • Competitive landscape

Interested in this report?

Get your sample now to see our research methodology and insights!

Download Now

Frequently Asked Questions

Factoring market growth will increase by USD 2506.4 billion during 2026-2030.

The Factoring market is expected to grow at a CAGR of 8.7% during 2026-2030.

Factoring market is segmented by Type (Domestic, International) Application (SMEs, Large enterprise) Product type (Recourse factoring, Non-recourse factoring)

Banco Santander SA, Barclays PLC, Bibby Financial Services Ltd., China Construction Bank, Citigroup Inc., Deutsche Factoring Bank GmbH, eCapital Corp., Eurobank Ergasias Services, First Citizens Bancshares Inc., HSBC Holdings Plc, ICICI Bank Ltd., Mitsubishi UFJ Financial Group, Mizuho Financial Group Inc., Riviera Finance of Texas Inc., RTS Financial Service Inc., Triumph Financial Inc., UniCredit Factoring S.p.A., Wells Fargo and Co. are a few of the key vendors in the Factoring market.

Europe will register the highest growth rate of 53.4% among the other regions. Therefore, the Factoring market in Europe is expected to garner significant business opportunities for the vendors during the forecast period.

Germany, Italy, France, UK, Spain, The Netherlands, China, Japan, India, South Korea, Australia, Indonesia, US, Canada, Mexico, Brazil, Argentina, Colombia, Saudi Arabia, UAE, South Africa, Israel, Turkey

  • Growing SME financing and liquidity needs is the driving factor this market.

The Factoring market vendors should focus on grabbing business opportunities from the Type segment as it accounted for the largest market share in the base year.