Rigless Intervention Services Market Size 2025-2029
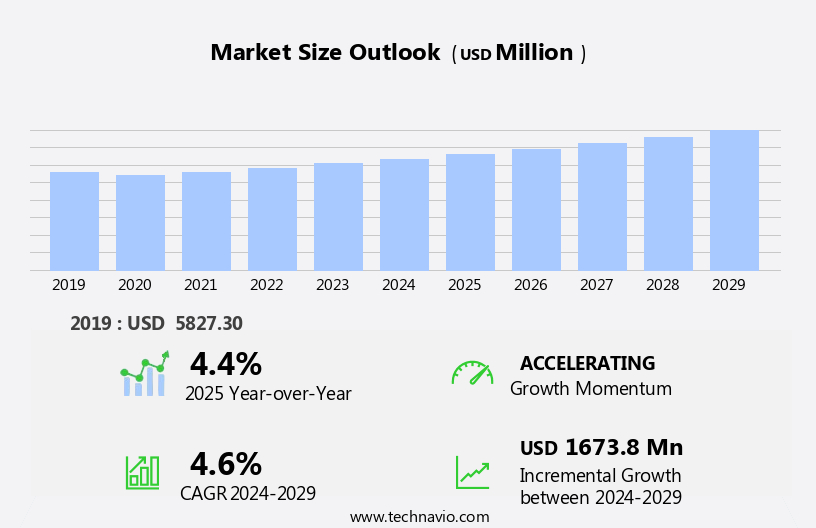
The rigless intervention services market size is forecast to increase by USD 1.67 billion at a CAGR of 4.6% between 2024 and 2029.
- The market is experiencing significant growth, driven by the increasing oil and gas Exploration and Production (E&P) activities. This trend is attributed to the cost savings and operational efficiency gains associated with rigless interventions, which enable operators to access reservoirs and perform maintenance tasks without the need for traditional drilling rigs. Moreover, advancements in 4D seismic survey technologies are fueling market growth, as these technologies enable real-time monitoring of reservoirs and provide valuable data for optimizing production and identifying new opportunities. Additionally, the rise in adoption of renewable energy sources is creating new applications for rigless intervention services, particularly in the installation and maintenance of offshore wind turbines. Furthermore, the integration of laser technology in workover operations has revolutionized the industry, enabling more precise and efficient interventions.
- However, the market faces several challenges. Regulatory compliance, including safety and environmental regulations, poses a significant obstacle for market participants. Furthermore, the high upfront costs of rigless intervention technologies and the need for specialized expertise can limit market penetration, particularly for smaller operators. Despite these challenges, the market's potential is significant, with opportunities for innovation and cost savings driving continued growth. Companies seeking to capitalize on these opportunities must focus on developing cost-effective solutions and building strategic partnerships to navigate regulatory complexities and access specialized expertise. In addition, well stimulation techniques like jetting systems and coiled tubing are being employed to enhance production.
What will be the Size of the Rigless Intervention Services Market during the forecast period?
Explore in-depth regional segment analysis with market size data - historical 2019-2023 and forecasts 2025-2029 - in the full report.
Request Free Sample
- In the market, subsea data analysis plays a crucial role in optimizing production and enhancing asset integrity. Well stimulation and completion are key areas where rigless interventions, such as hydraulic intervention and coiled tubing intervention, are employed. Subsea asset integrity is maintained through corrosion control and cathodic protection, while subsea decommissioning requires specialized techniques for safe and efficient execution. Subsea processing systems, including subsea trees and flowlines, necessitate remote operations for maintenance and repair. Well testing and logging are essential for reservoir management, and downhole tools are utilized for production optimization. Drilling fluids and subsea umbilicals are critical components in drilling and production operations.
- Subsea environmental monitoring ensures regulatory compliance and reduces operational risks. Automation and control systems are integral to subsea operations optimization, and subsea manifolds facilitate the distribution of oil and gas. Well testing and subsea processing systems require periodic maintenance for optimal performance. Well stimulation and completion involve the use of wireline intervention and subsea trees. Hydraulic intervention and coiled tubing intervention are employed for well stimulation, while wireline intervention is used for well completion and well logging. Subsea corrosion control and cathodic protection are essential for maintaining the integrity of subsea trees and other assets. The use of safety equipment, including fire suppression systems and personal protective equipment, is essential to mitigate risks and ensure the wellbeing of personnel.
- Subsea flowlines and risers require regular inspection and maintenance for optimal performance. Subsea data acquisition and analysis are essential for monitoring and optimizing subsea production systems. Production optimization is achieved through the use of downhole tools and completion fluids, while subsea automation enhances operational efficiency. In summary, the market encompasses various subsea applications, from well stimulation and completion to production optimization and asset integrity management. Technological advancements and the increasing focus on operational efficiency are driving market growth in this sector.
How is this Rigless Intervention Services Industry segmented?
The rigless intervention services industry research report provides comprehensive data (region-wise segment analysis), with forecasts and estimates in "USD million" for the period 2025-2029, as well as historical data from 2019-2023 for the following segments.
- Application
- Onshore
- Offshore
- Technique
- Coiled tubing
- Wireline
- Hydraulic workover services
- Type
- Horizontal wells
- Vertical wells
- Multilateral wells
- Geography
- North America
- US
- Canada
- Mexico
- Europe
- Germany
- Russia
- Middle East and Africa
- UAE
- APAC
- China
- Japan
- South America
- Brazil
- Rest of World (ROW)
- North America
By Application Insights
The onshore segment is estimated to witness significant growth during the forecast period. The subsea fabrication and underwater welding markets are experiencing significant growth due to the increasing demand for rigless intervention services in subsea engineering. Rigless intervention enables the execution of various tasks, including underwater cutting, subsea production systems installation, and subsea integrity assessments, without the need for a traditional drilling rig. This approach is particularly beneficial for subsea abandonment projects and wellhead systems maintenance. Subsea technology innovation and subsea valve advancements have played a crucial role in enhancing subsea operations' efficiency and safety. Underwater survey and inspection are essential components of subsea project management, ensuring subsea regulations compliance and maintaining subsea pipelines' integrity.
Subsea sensors and underwater communication systems enable real-time monitoring and control of subsea systems. The boost in subsea robotics and automation technologies has revolutionized subsea operations, enabling cost-effective and efficient subsea intervention and repair. Subsea processing and subsea injection systems have gained popularity due to their ability to maximize oil and gas recovery. Subsea manifolds and underwater construction are critical components of subsea production systems, ensuring seamless oil and gas transportation. The onshore segment of the market is growing steadily, driven by the increasing demand for onshore E and P activities. These activities have a lower cost of operation compared to offshore E and P activities, making them an attractive option for oil and gas producers. The recent recovery of the global crude oil price has led to increased investments in shale oil and gas in the US. Subsea safety and security are paramount, with underwater navigation and positioning systems ensuring safe and efficient subsea operations.
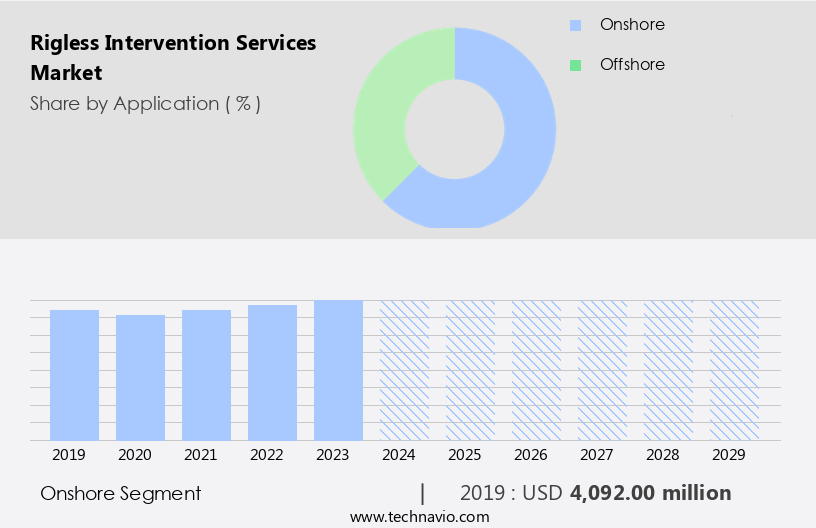
The Onshore segment was valued at USD 4.09 billion in 2019 and showed a gradual increase during the forecast period.
Regional Analysis
North America is estimated to contribute 51% to the growth of the global market during the forecast period. Technavio's analysts have elaborately explained the regional trends and drivers that shape the market during the forecast period.
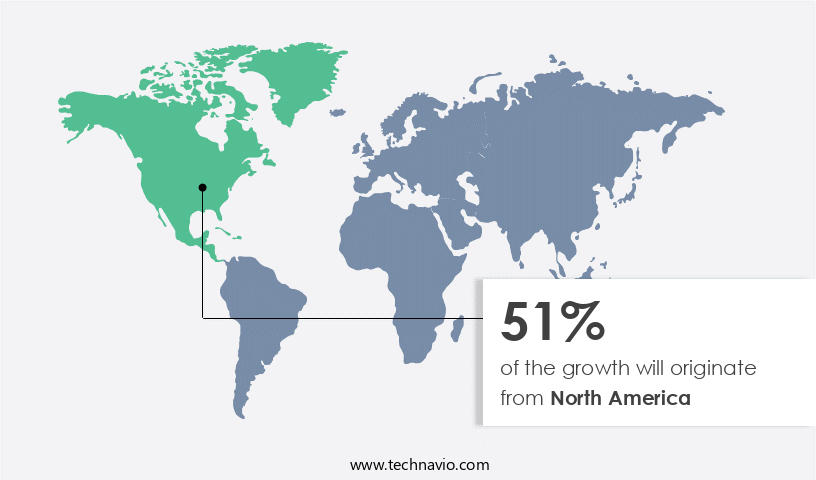
The market in the Americas is experiencing significant growth due to the increasing demand for crude oil in North America, making it the leading consumer worldwide. The region's energy and exploration (E&P) activities are surging, fueled by the recovery of global crude oil prices. The US shale industry is particularly impacted, with high investments being made due to firmer oil prices. This boom had a profound effect on the upstream oil and gas industry, leading to an increase in subsea fabrication, underwater welding, and rigless intervention. Subsea engineering, abandonment, safety, production systems, integrity, wellhead systems, technology, innovation, valves, survey, communication, control systems, design, injection systems, standards, connectors, corrosion, positioning, monitoring, manifolds, construction, repair, project management, security, navigation, sensors, intervention, operations, robotics, regulations, pipelines, installation, decommissioning, processing, maintenance, pumps, separators, and inspection are all areas experiencing growth in the subsea market.
These services are essential for underwater construction, maintenance, and repair of subsea infrastructure, including pipelines, platforms, and production systems. The market's evolution is driven by the need for efficient and cost-effective solutions to maximize subsea production while ensuring safety and environmental sustainability.
Market Dynamics
Our researchers analyzed the data with 2024 as the base year, along with the key drivers, trends, and challenges. A holistic analysis of drivers will help companies refine their marketing strategies to gain a competitive advantage.
What are the Rigless Intervention Services market drivers leading to the rise in the adoption of Industry?
- The increase in exploration and production (E&P) activities within the oil and gas sector serves as the primary catalyst for market growth. The market has gained significant traction in the upstream oil and gas industry due to advancements in subsea engineering and technology. Traditional exploration and production (E and P) activities involved random drilling to locate oil and gas reserves. However, the introduction of more precise and sensitive equipment, such as subsea fabrication, underwater welding, and underwater cutting, has enabled a more calculated approach. These technologies utilize seismic waves to analyze the composition of the reserves beneath the Earth's surface, reducing the need for drilling for identification. The increasing investment in onshore oil and gas E and P activities is expected to boost the upstream sector, subsequently increasing the demand for rigless intervention services.
- Subsea production systems, wellhead systems, and subsea integrity are critical aspects of subsea engineering that require rigless intervention services for maintenance and repair. Underwater welding and cutting are essential for subsea production systems, while subsea safety is a primary concern for all subsea engineering projects. Subsea abandonment is another area where rigless intervention services play a crucial role. As oil and gas fields reach the end of their productive life, rigless intervention services are used to safely and efficiently decommission subsea infrastructure. The market is expected to grow due to the increasing focus on subsea technology, subsea production systems, and subsea integrity.
What are the Rigless Intervention Services market trends shaping the Industry?
- Advances in 4D seismic survey technology represent a significant market trend. This cutting-edge technology continues to evolve, offering enhanced capabilities for monitoring subsurface changes over time. Subsea innovation continues to advance in the oil and gas industry, driven by the need for more accurate and efficient well intervention techniques. Subsea valves, underwater survey, communication, control systems, injection systems, and connectors are essential components of subsea technology. Subsea design and engineering have evolved to address the challenges of corrosion and other environmental factors. The latest trend in subsea technology is the adoption of 4D seismic surveys, also known as time-lapse seismic surveys. These surveys use advanced imaging techniques to monitor changes in the reservoir over time, providing valuable insights into reservoir behavior and optimizing production.
- Underwater communication and control systems enable real-time data transfer and analysis, enhancing operational efficiency and safety. Subsea standards and regulations play a crucial role in ensuring the reliability and safety of subsea technology. Continuous research and development in subsea technology aim to improve performance, reduce costs, and minimize environmental impact. The future of subsea technology lies in the integration of advanced technologies such as artificial intelligence, machine learning, and the Internet of Things (IoT) to optimize operations and maximize returns on investment.
How does Rigless Intervention Services market face challenges during its growth?
- The increasing adoption of renewable energy sources poses a significant challenge to the growth of the energy industry. This trend necessitates continuous innovation and adaptation by industry players to remain competitive in the shifting energy landscape. The global energy landscape is undergoing a significant shift as the world grapples with increasing energy demand and the need to reduce greenhouse gas emissions. Fossil fuels, while still dominant, are being supplanted by renewable energy sources due to government mandates and the growing awareness of sustainability. This trend is driving the growth of the market, which plays a crucial role in underwater positioning, subsea monitoring, subsea manifolds, underwater construction, subsea repair, subsea project management, subsea security, underwater navigation, subsea sensors, and subsea intervention.
- These services enable efficient and cost-effective subsea operations, making them essential for the successful implementation of subsea projects. The market is expected to continue its growth trajectory, driven by the increasing adoption of renewable energy sources and the expanding offshore oil and gas industry.
Exclusive Customer Landscape
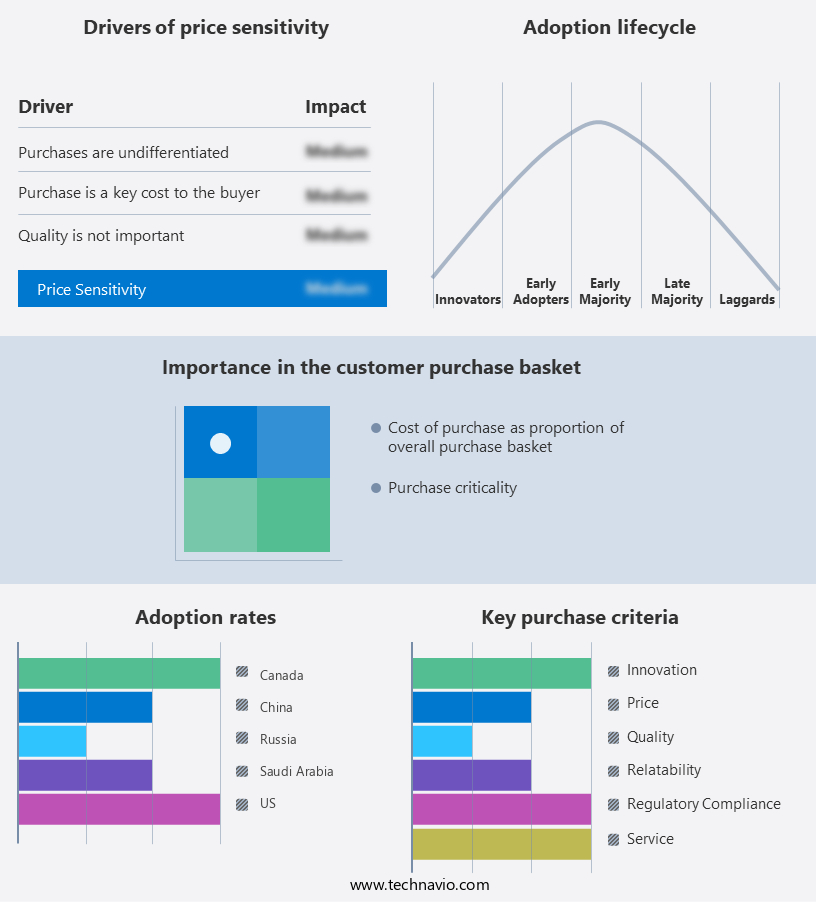
The rigless intervention services market forecasting report includes the adoption lifecycle of the market, covering from the innovator's stage to the laggard's stage. It focuses on adoption rates in different regions based on penetration. Furthermore, the rigless intervention services market report also includes key purchase criteria and drivers of price sensitivity to help companies evaluate and develop their market growth analysis strategies.
Customer Landscape
Key Companies & Market Insights
Companies are implementing various strategies, such as strategic alliances, rigless intervention services market forecast, partnerships, mergers and acquisitions, geographical expansion, and product/service launches, to enhance their presence in the industry.
ABL Group ASA - The company specializes in rigless intervention services, providing expertise in coiled tubing with thru tubing downhole tools, stimulation, surface well testing, wireline, production logging, saturation monitoring, and well integrity solutions.
The industry research and growth report includes detailed analyses of the competitive landscape of the market and information about key companies, including:
- ABL Group ASA
- Abu Dhabi National Oil Co.
- Acteon Group Ltd.
- Aker Solutions ASA
- Attollo Ltd.
- Baker Hughes Co.
- EFC Group Ltd.
- Expro Group Holdings NV
- General Electric Co.
- Gulf Intervention Services DMCC
- Halliburton Co.
- Havilah Energy
- Helix Energy Solutions Group Inc.
- NOV Inc.
- Oceaneering International Inc.
- Odfjell Technology Ltd.
- Qatar Navigation QPSC
- Sapura Energy Berhad
- Schlumberger Ltd.
- Weatherford International Plc
Qualitative and quantitative analysis of companies has been conducted to help clients understand the wider business environment as well as the strengths and weaknesses of key industry players. Data is qualitatively analyzed to categorize companies as pure play, category-focused, industry-focused, and diversified; it is quantitatively analyzed to categorize companies as dominant, leading, strong, tentative, and weak.
Recent Development and News in Rigless Intervention Services Market
- In February 2023, Baker Hughes, a GE company, announced the expansion of its Rigless Intervention Services (RIS) portfolio with the launch of the new Rigless Subsurface Flow Control (SSFC) system. This innovative solution aims to improve operational efficiency and reduce costs for clients by enabling the remote control and monitoring of flow control valves without the need for rig intervention (Baker Hughes press release, 2023).
- In March 2024, Schlumberger and Equinor signed a strategic collaboration agreement to jointly develop and deploy Rigless Intervention Services in Equinor's offshore fields. This partnership is expected to result in significant cost savings and increased operational efficiency for both parties (Schlumberger press release, 2024).
- In May 2024, Halliburton completed the acquisition of 100% ownership of Cygnet Texkool, a leading provider of Rigless Intervention Services, for approximately USD1.2 billion. This acquisition strengthens Halliburton's position in the RIS market and provides the company with access to Cygnet Texkool's proprietary technologies and experienced workforce (Halliburton press release, 2024).
Research Analyst Overview
The market continues to evolve, driven by the ever-increasing complexity of subsea projects. Subsea innovation is at the forefront of this evolution, with advancements in subsea valves, underwater survey, well intervention, underwater communication, subsea control systems, subsea design, subsea injection systems, subsea standards, subsea connectors, and subsea corrosion protection. Underwater survey and mapping technologies enable precise positioning and monitoring, ensuring the integrity of subsea infrastructure. Well intervention techniques allow for the optimization of subsea production systems, enhancing efficiency and safety. Subsea communication systems facilitate real-time data exchange between onshore and offshore assets, enabling effective subsea project management and maintenance. Subsea design and engineering continue to push the boundaries of what is possible in underwater construction and repair.
Subsea safety remains a top priority, with ongoing efforts to address underwater welding and cutting hazards, as well as the development of subsea security measures. Subsea regulations continue to evolve, reflecting the dynamic nature of the industry and the need for continuous improvement. Subsea technology is advancing at a rapid pace, with new applications in underwater navigation, underwater sensors, subsea robotics, and subsea processing. Subsea pumps and separators are essential components of subsea production systems, ensuring the efficient extraction and processing of hydrocarbons. Subsea decommissioning and abandonment are also becoming increasingly important, with a focus on minimizing environmental impact and maximizing asset recovery.
Subsea pipelines and manifolds are critical infrastructure for transporting hydrocarbons from offshore fields to onshore facilities. In summary, the market is characterized by continuous innovation and evolution, with applications across various sectors of the subsea industry. From underwater survey and mapping to subsea safety and production systems, the market is driven by the need for efficient, safe, and cost-effective solutions to meet the challenges of subsea engineering and construction.
Dive into Technavio's robust research methodology, blending expert interviews, extensive data synthesis, and validated models for unparalleled Rigless Intervention Services Market insights. See full methodology.
|
Market Scope |
|
|
Report Coverage |
Details |
|
Page number |
218 |
|
Base year |
2024 |
|
Historic period |
2019-2023 |
|
Forecast period |
2025-2029 |
|
Growth momentum & CAGR |
Accelerate at a CAGR of 4.6% |
|
Market growth 2025-2029 |
USD 1.67 billion |
|
Market structure |
Fragmented |
|
YoY growth 2024-2025(%) |
4.4 |
|
Key countries |
US, Canada, Saudi Arabia, Russia, UAE, China, Germany, Brazil, Mexico, and Japan |
|
Competitive landscape |
Leading Companies, Market Positioning of Companies, Competitive Strategies, and Industry Risks |
What are the Key Data Covered in this Rigless Intervention Services Market Research and Growth Report?
- CAGR of the Rigless Intervention Services industry during the forecast period
- Detailed information on factors that will drive the growth and forecasting between 2025 and 2029
- Precise estimation of the size of the market and its contribution of the industry in focus to the parent market
- Accurate predictions about upcoming growth and trends and changes in consumer behaviour
- Growth of the market across North America, Middle East and Africa, Europe, APAC, and South America
- Thorough analysis of the market's competitive landscape and detailed information about companies
- Comprehensive analysis of factors that will challenge the rigless intervention services market growth of industry companies
We can help! Our analysts can customize this rigless intervention services market research report to meet your requirements.
 RIA -
RIA - 
