Robotic Medical Imaging Systems Market Analysis, Size, and Forecast 2026-2030: North America (US, Canada, and Mexico), Europe (Germany, UK, and France), APAC (China, Japan, and India), South America (Brazil, Argentina, and Colombia), Middle East and Africa (Saudi Arabia, UAE, and South Africa), and Rest of World (ROW)

Robotic Medical Imaging Systems Market Analysis, Size, and Forecast 2026-2030:
North America (US, Canada, and Mexico), Europe (Germany, UK, and France), APAC (China, Japan, and India), South America (Brazil, Argentina, and Colombia), Middle East and Africa (Saudi Arabia, UAE, and South Africa), and Rest of World (ROW)

Published: Jan 2026 306 Pages SKU: IRTNTR74040

Market Overview at a Glance

$1.04 B
Market Opportunity
17.2%
CAGR 2025 - 2030
42.4%
North America Growth
$264.3 Mn
X-ray segment 2024

Robotic Medical Imaging Systems Market Size 2026-2030

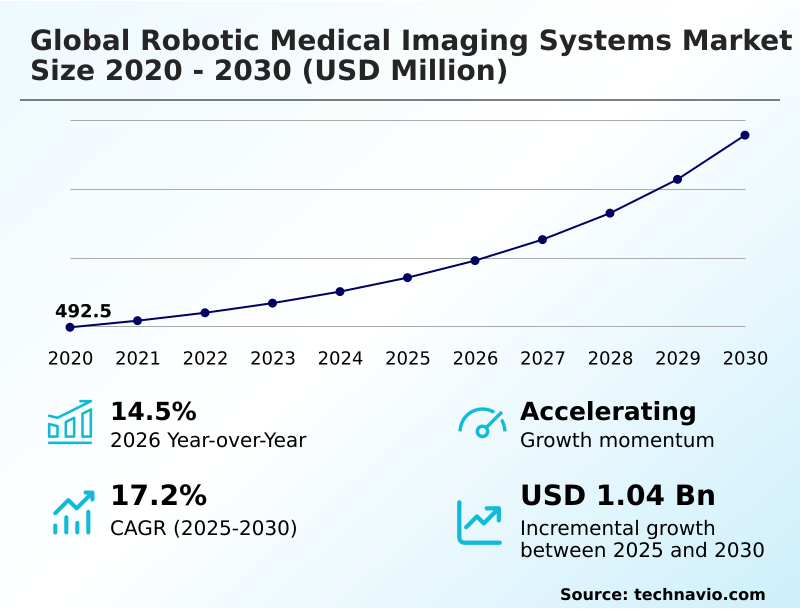
The robotic medical imaging systems market size is valued to increase by USD 1.04 billion, at a CAGR of 17.2% from 2025 to 2030. Technological integration of AI and automation will drive the robotic medical imaging systems market.

Major Market Trends & Insights

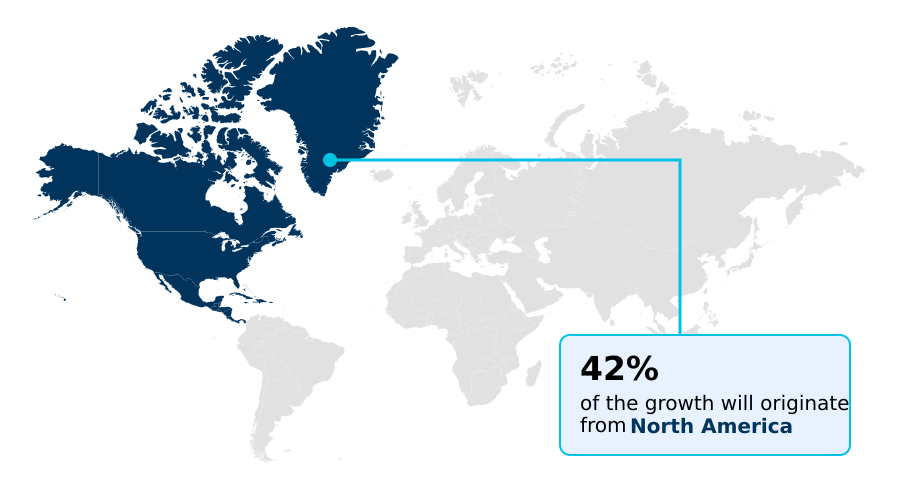
  • North America dominated the market and accounted for a 42.4% growth during the forecast period.
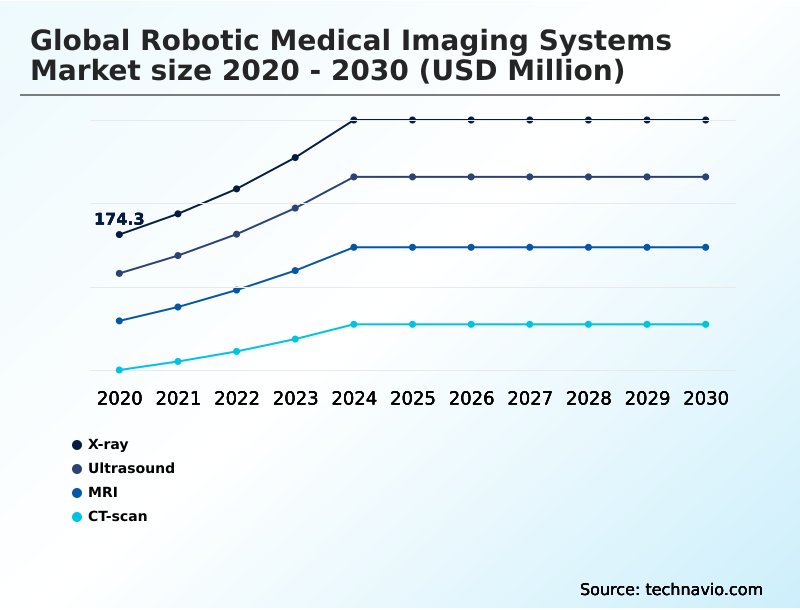
  • By Product - X-ray segment was valued at USD 264.3 million in 2024
  • By Application - Interventional radiology segment accounted for the largest market revenue share in 2024

Market Size & Forecast

  • Market Opportunities: USD 1.40 billion
  • Market Future Opportunities: USD 1.04 billion
  • CAGR from 2025 to 2030 : 17.2%

Market Summary

  • The robotic medical imaging systems market is transitioning from standalone devices to integrated platforms that combine robotics with AI-driven analytics. This evolution is driven by the need for enhanced precision in minimally invasive procedures, the rising prevalence of chronic diseases, and persistent workforce shortages in radiology.
  • By leveraging technologies like robotic c-arm positioning and AI-driven workflow automation, these systems standardize complex procedures and reduce operator-dependent variability. For example, a hospital can optimize its operating room throughput by using an image-guided intervention platform that automates patient setup and image acquisition, shortening procedure times and allowing for more surgeries to be performed daily.
  • While the high capital investment remains a significant barrier, the clinical and operational benefits, including improved patient outcomes and greater efficiency, continue to fuel adoption. The technology is critical for enabling tele-robotic ultrasound and other remote diagnostic capabilities, expanding access to specialized care. These systems are foundational to the future of data-driven, precision medicine.

What will be the Size of the Robotic Medical Imaging Systems Market during the forecast period?

Get Key Insights on Market Forecast (PDF) Request Free Sample

How is the Robotic Medical Imaging Systems Market Segmented?

The robotic medical imaging systems industry research report provides comprehensive data (region-wise segment analysis), with forecasts and estimates in "USD million" for the period 2026-2030, as well as historical data from 2020-2024 for the following segments.

  • Product
    • X-ray
    • Ultrasound
    • MRI
    • CT-scan
  • Application
    • Interventional radiology
    • Orthopedic and spine surgery
    • Neurosurgery
    • Others
  • End-user
    • Hospitals
    • Specialty clinics
    • Ambulatory surgical centers
  • Geography
    • North America
      • US
      • Canada
      • Mexico
    • Europe
      • Germany
      • UK
      • France
    • APAC
      • China
      • Japan
      • India
    • South America
      • Brazil
      • Argentina
      • Colombia
    • Middle East and Africa
      • Saudi Arabia
      • UAE
      • South Africa
    • Rest of World (ROW)

By Product Insights

The x-ray segment is estimated to witness significant growth during the forecast period.

The robotic medical imaging systems market is segmented by product, application, end-user, and geography. The X-ray segment is evolving with the adoption of systems featuring robotic c-arm positioning and a self-driving mobile c-arm, which enhance precision in surgical settings.

These platforms, including the laser-guided mobile gantry, are designed for AI-driven workflow automation, significantly improving operational efficiency. The integration of surgical navigation tools and autonomous diagnostic imaging addresses the need for greater accuracy and reduced manual intervention.

For instance, advanced systems reduce procedural radiation exposure for staff by up to 50%.

This focus on workflow efficiency in radiology and improved patient throughput optimization reflects a broader shift towards value-based healthcare technology and safer, more effective interventional radiology robotics and computer-assisted surgery.

Request Free Sample

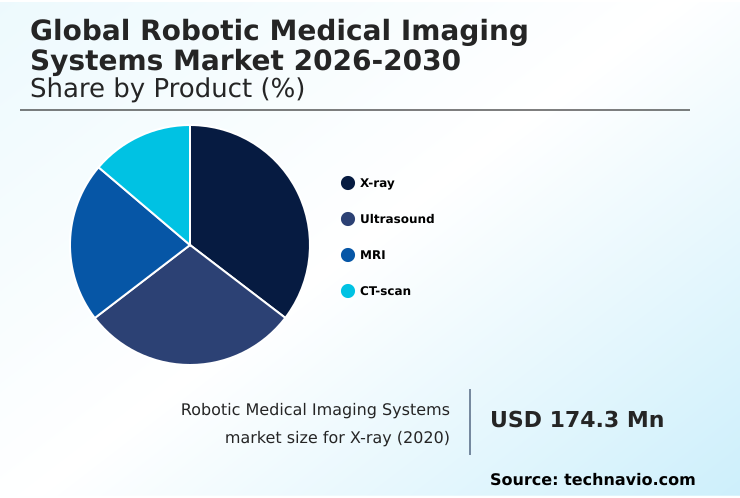
The X-ray segment was valued at USD 264.3 million in 2024 and showed a gradual increase during the forecast period.

Request Free Sample

Regional Analysis

North America is estimated to contribute 42.4% to the growth of the global market during the forecast period.Technavio’s analysts have elaborately explained the regional trends and drivers that shape the market during the forecast period.

See How Robotic Medical Imaging Systems Market Demand is Rising in North America Request Free Sample

The geographic landscape of the robotic medical imaging systems market is led by North America, which accounts for over 42% of incremental growth, driven by high healthcare spending and early technology adoption.

The region sees widespread use of advanced primary and revision capabilities in orthopedics and minimally invasive tumor ablation in oncology. Europe follows, with strong government support for digital surgical ecosystems and precision oncology robotics.

Meanwhile, the APAC region is the fastest-growing market, with investments in smart hospital infrastructure growing by 30% annually in key countries.

This expansion is supported by demand for automated tissue recognition and remote procedural control to serve a large patient base.

These platforms which use real time imaging data for surgical guidance, are becoming integral to both established and emerging healthcare systems globally, with a focus on improving diagnostic-grade image capture and standardizing surgical outcome standardization.

Market Dynamics

Our researchers analyzed the data with 2025 as the base year, along with the key drivers, trends, and challenges. A holistic analysis of drivers will help companies refine their marketing strategies to gain a competitive advantage.

  • Strategic adoption of robotic medical imaging systems requires a thorough cost-benefit analysis of robotic bronchoscopy and similar specialized platforms. Healthcare leaders must evaluate the impact of AI on robotic imaging accuracy and understand the training requirements for robotic surgery systems to ensure successful integration.
  • A key consideration is the potential for workflow improvements with automated imaging, which often outperform legacy systems by a two-to-one margin in high-volume settings. When comparing robotic vs. manual biopsy precision, data consistently favors automated platforms.
  • The ROI of robotic imaging in orthopedic surgery is significant, driven by improved patient outcomes in robotic joint replacement and enhanced robotic spine surgery navigation accuracy. Furthermore, these systems play a crucial role in reducing radiation with robotic c-arm systems.
  • The future of autonomous medical imaging systems depends on resolving challenges like data interoperability for robotic platforms and establishing robust security protocols for remote robotic surgery. For institutions aiming to expand care, tele-robotic ultrasound for rural healthcare access offers a transformative solution.
  • Integrating robotic imaging with hospital PACS is critical for a seamless workflow, as is understanding the regulatory pathways for AI-enabled imaging devices.
  • Ultimately, the focus is on leveraging robotic systems for minimally invasive oncology and robotic imaging for cardiovascular interventions, addressing the ergonomic benefits for sonographers using robotics, and utilizing MRI-compatible robotics for neurosurgery and AI-powered image analysis in robotic systems.

What are the key market drivers leading to the rise in the adoption of Robotic Medical Imaging Systems Industry?

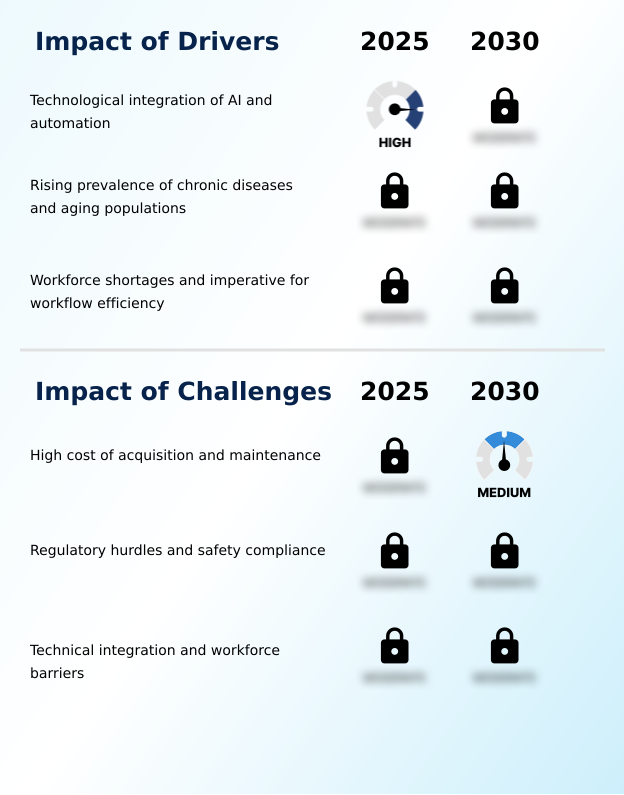
  • The technological integration of AI and automation is a primary driver for the robotic medical imaging systems market, enhancing diagnostic capabilities and workflow efficiency.

  • Market growth is primarily driven by the integration of AI and the urgent need for operational efficiency. AI-driven workflow automation and autonomous diagnostic imaging are transforming radiology departments, improving diagnostic throughput by up to 40%.
  • The adoption of CT-based navigation and real-time image fusion allows for sub-millimeter accuracy in complex procedures, a key factor in neurosurgical navigation systems and interventional radiology. Furthermore, these systems standardize image quality, which reduces retake rates by 25%.
  • The demand for remote real-time ultrasound examinations is met by platforms that incorporate clinical decision support tools, helping to bridge the expertise gap in underserved areas.
  • This convergence of technologies is making robotic-assisted procedures safer and more consistent, directly impacting patient care and hospital workflows.

What are the market trends shaping the Robotic Medical Imaging Systems Industry?

  • The integration of machine learning is a key trend, enhancing precision in robotic medical imaging systems. This shift transforms static hardware into intelligent, data-driven platforms.

  • Key trends in the robotic medical imaging systems market are centered on intelligent automation and remote capabilities. The integration of image recognition software and robotic needle positioning is enabling a new level of precision in robotic biopsy guidance, enhancing needle placement accuracy by 20%.
  • Advancements in tele-robotic ultrasound and tele-sonography systems, often equipped with a haptic feedback mechanism and remote real-time ultrasound examinations, are addressing workforce shortages and expanding diagnostic reach. These automated medical imaging platforms reduce procedure times by 15%.
  • This shift toward AI in medical diagnostics and robotic microsurgery systems is creating more efficient and accessible healthcare solutions, with a strong focus on improving surgical outcome standardization and remote diagnostic imaging.

What challenges does the Robotic Medical Imaging Systems Industry face during its growth?

  • The high cost of acquisition and maintenance presents a significant challenge, impacting the adoption rate of advanced robotic medical imaging systems.

  • Significant challenges in the robotic medical imaging systems market include high initial costs and complex technical integration. The implementation of a complete cardiovascular workspace or platforms with force-sensing technology requires a capital outlay that can be 3-5 times higher than conventional equipment.
  • Integrating these systems into existing hospital IT infrastructures, or achieving seamless digital twin integration, can increase project timelines by up to 60%. The development of digital surgical ecosystems and ensuring compatibility with various intraoperative imaging solutions present ongoing hurdles.
  • As the industry moves toward value-based healthcare technology, justifying the high costs of systems with specialized features like a robotic-assisted knee and hip replacements or advanced imaging and informatics tools remains a primary focus for healthcare administrators.

Exclusive Technavio Analysis on Customer Landscape

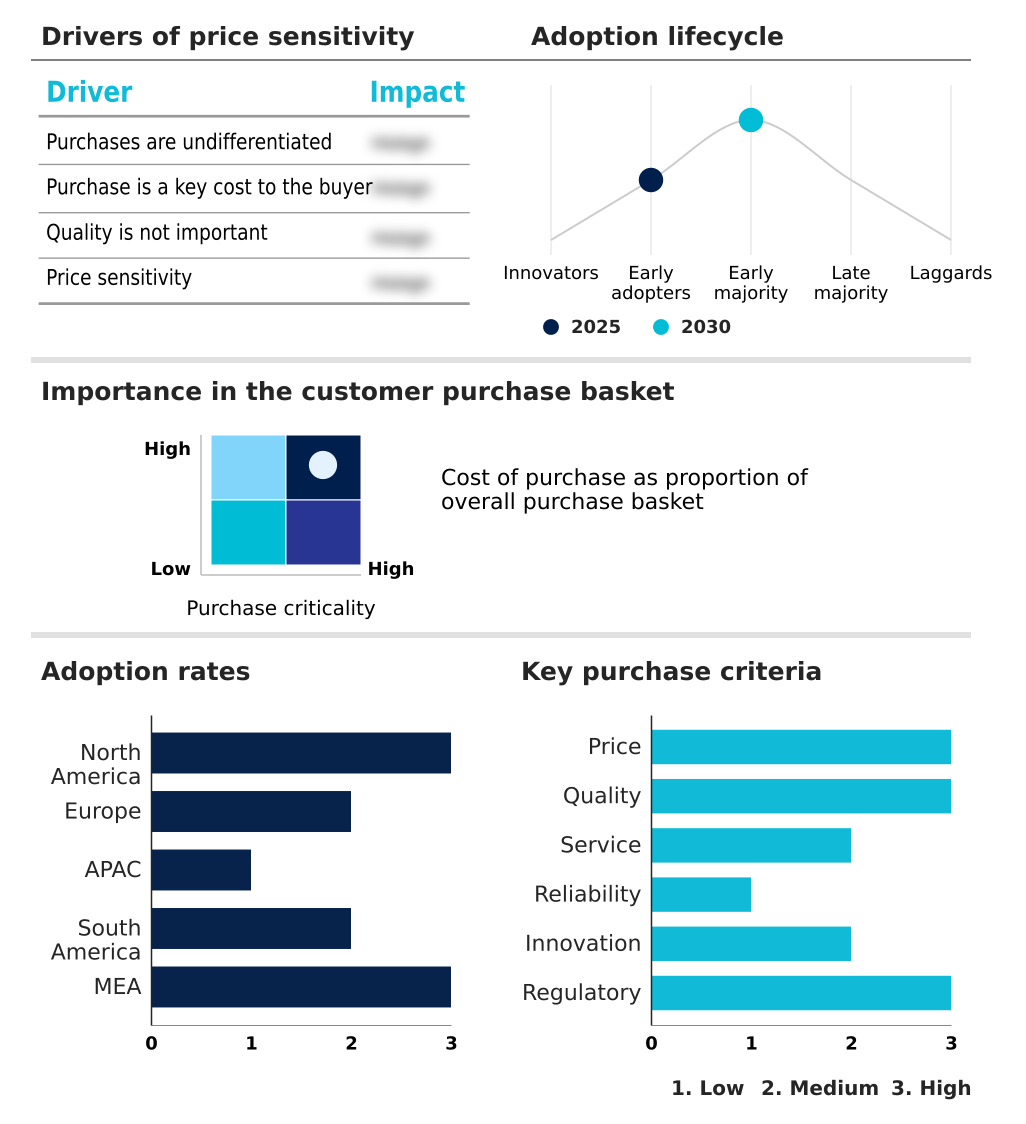
The robotic medical imaging systems market forecasting report includes the adoption lifecycle of the market, covering from the innovator’s stage to the laggard’s stage. It focuses on adoption rates in different regions based on penetration. Furthermore, the robotic medical imaging systems market report also includes key purchase criteria and drivers of price sensitivity to help companies evaluate and develop their market growth analysis strategies.

Customer Landscape of Robotic Medical Imaging Systems Industry

Competitive Landscape

Companies are implementing various strategies, such as strategic alliances, robotic medical imaging systems market forecast, partnerships, mergers and acquisitions, geographical expansion, and product/service launches, to enhance their presence in the industry.

AdEchoTech - Delivers advanced telerobotic ultrasound systems, enabling remote, real-time diagnostic examinations through proprietary, internally designed and manufactured solutions.

The industry research and growth report includes detailed analyses of the competitive landscape of the market and information about key companies, including:

  • AdEchoTech
  • Asensus Surgical US Inc.
  • Brainlab AG
  • General Electric Co.
  • Globus Medical Inc.
  • Intuitive Surgical Inc.
  • Johnson and Johnson Services
  • KUKA AG
  • Medtronic Plc
  • MGI Tech Co. Ltd.
  • Neocis Inc.
  • NeuraSignal Inc.
  • Perfint Healthcare Corp.
  • Renishaw Plc
  • Siemens Healthineers AG
  • Smith and Nephew plc
  • Stereotaxis Inc.
  • Stryker Corp.
  • Synaptive Medical Inc.
  • Zimmer Biomet Holdings Inc.

Qualitative and quantitative analysis of companies has been conducted to help clients understand the wider business environment as well as the strengths and weaknesses of key industry players. Data is qualitatively analyzed to categorize companies as pure play, category-focused, industry-focused, and diversified; it is quantitatively analyzed to categorize companies as dominant, leading, strong, tentative, and weak.

Recent Development and News in Robotic medical imaging systems market

  • In August, 2024, PROCEPT BioRobotics Corp. received FDA 510(k) clearance for its HYDROS Robotic System, which features the FirstAssist AI software for analyzing ultrasound and cystoscopy images to suggest treatment plans.
  • In November, 2024, Rush University System for Health acquired the Epione robotic platform from Quantum Surgical, becoming the first hospital in the Midwest to use the technology for minimally invasive treatment of abdominal tumors.
  • In March, 2025, GE HealthCare and NVIDIA announced a strategic collaboration to develop autonomous imaging systems using physical AI, enabling devices to perceive patient positioning and automate imaging protocols.
  • In April, 2025, United Imaging Healthcare announced that its advanced imaging products had achieved coverage in over 70% of United States administrative regions, indicating a significant expansion of its high-end imaging modalities.

Dive into Technavio’s robust research methodology, blending expert interviews, extensive data synthesis, and validated models for unparalleled Robotic Medical Imaging Systems Market insights. See full methodology.

Market Scope
Page number 306
Base year 2025
Historic period 2020-2024
Forecast period 2026-2030
Growth momentum & CAGR Accelerate at a CAGR of 17.2%
Market growth 2026-2030 USD 1036.3 million
Market structure Fragmented
YoY growth 2025-2026(%) 14.5%
Key countries US, Canada, Mexico, Germany, UK, France, Italy, Spain, The Netherlands, China, Japan, India, South Korea, Australia, Indonesia, Brazil, Argentina, Colombia, Saudi Arabia, UAE, South Africa, Israel and Turkey
Competitive landscape Leading Companies, Market Positioning of Companies, Competitive Strategies, and Industry Risks

Request Free Sample

Research Analyst Overview

  • The robotic medical imaging systems market is defined by a technological shift toward integrated, intelligent platforms. Advanced systems now incorporate not just robotic c-arm positioning and intraoperative 3d imaging but also a haptic feedback mechanism and force-sensing technology for enhanced procedural control. The use of a mobile ct scanner, augmented intelligence platforms, and a cardiovascular workspace is becoming standard.
  • Key innovations include stereotactic robotic assistance, AI-based live image denoising, motion scaling algorithms, robotic digital microscopy, and robotic exoscope visualization. Platforms featuring a 3dhd vision system, cone-beam ct synchronization, and a photon-counting detector are enabling breakthroughs in image-guided intervention and tele-robotic ultrasound.
  • The integration of a remote scanning solution, robotic needle positioning, and image recognition software is central to AI-driven workflow automation. In board-level strategy, a focus on platforms offering digital twin integration and a self-driving mobile c-arm is critical for future-proofing investments.
  • Systems that provide automated patient positioning and real-time 3d digital joint models have demonstrated a 25% improvement in diagnostic first-pass accuracy. The market is also seeing adoption of robotic-assisted bronchoscopy and technologies like the laser-guided mobile gantry to support minimally invasive tumor ablation and advanced primary and revision capabilities.

What are the Key Data Covered in this Robotic Medical Imaging Systems Market Research and Growth Report?

  • What is the expected growth of the Robotic Medical Imaging Systems Market between 2026 and 2030?

    • USD 1.04 billion, at a CAGR of 17.2%

  • What segmentation does the market report cover?

    • The report is segmented by Product (X-ray, Ultrasound, MRI, and CT-scan), Application (Interventional radiology, Orthopedic and spine surgery, Neurosurgery, and Others), End-user (Hospitals, Specialty clinics, and Ambulatory surgical centers) and Geography (North America, Europe, APAC, South America, Middle East and Africa)

  • Which regions are analyzed in the report?

    • North America, Europe, APAC, South America and Middle East and Africa

  • What are the key growth drivers and market challenges?

    • Technological integration of AI and automation, High cost of acquisition and maintenance

  • Who are the major players in the Robotic Medical Imaging Systems Market?

    • AdEchoTech, Asensus Surgical US Inc., Brainlab AG, General Electric Co., Globus Medical Inc., Intuitive Surgical Inc., Johnson and Johnson Services, KUKA AG, Medtronic Plc, MGI Tech Co. Ltd., Neocis Inc., NeuraSignal Inc., Perfint Healthcare Corp., Renishaw Plc, Siemens Healthineers AG, Smith and Nephew plc, Stereotaxis Inc., Stryker Corp., Synaptive Medical Inc. and Zimmer Biomet Holdings Inc.

Market Research Insights

  • The dynamics of the robotic medical imaging systems market are shaped by the push for improved surgical outcomes and greater operational efficiency.
  • The adoption of image-guided surgery and robotic-assisted procedures is driven by compelling clinical data; robotic assistance has been shown to improve procedural consistency by over 30%, while automated medical imaging workflows reduce scan setup times by an average of 15%.
  • This focus on workflow efficiency in radiology is a direct response to staffing shortages and the need to maximize patient throughput. Furthermore, the integration of robotic biopsy guidance and tele-sonography systems is expanding access to high-quality diagnostics.
  • Technologies that enable radiation exposure reduction and support orthopedic surgical robots are becoming standard in advanced healthcare settings, underpinning the shift toward safer and more precise interventions.

We can help! Our analysts can customize this robotic medical imaging systems market research report to meet your requirements.

Get in touch

1. Executive Summary

1.1 Market overview

Executive Summary - Chart on Market Overview
Executive Summary - Data Table on Market Overview
Executive Summary - Chart on Global Market Characteristics
Executive Summary - Chart on Market by Geography
Executive Summary - Chart on Market Segmentation by Product
Executive Summary - Chart on Market Segmentation by Application
Executive Summary - Chart on Market Segmentation by End-user
Executive Summary - Chart on Incremental Growth
Executive Summary - Data Table on Incremental Growth
Executive Summary - Chart on Company Market Positioning

2. Technavio Analysis

2.1 Analysis of price sensitivity, lifecycle, customer purchase basket, adoption rates, and purchase criteria

2.2 Criticality of inputs and Factors of differentiation

Chart on Overview on criticality of inputs and factors of differentiation

2.3 Factors of disruption

Chart on Overview on factors of disruption

2.4 Impact of drivers and challenges

Chart on Impact of drivers and challenges in 2025 and 2030

3. Market Landscape

3.1 Market ecosystem

Chart on Parent Market
Data Table on - Parent Market

3.2 Market characteristics

Chart on Market characteristics analysis

3.3 Value chain analysis

Chart on Value chain analysis

4. Market Sizing

4.1 Market definition

Data Table on Offerings of companies included in the market definition

4.2 Market segment analysis

Market segments

4.3 Market size 2025

4.4 Market outlook: Forecast for 2025-2030

Chart on Global - Market size and forecast 2025-2030 ($ million)
Data Table on Global - Market size and forecast 2025-2030 ($ million)
Chart on Global Market: Year-over-year growth 2025-2030 (%)
Data Table on Global Market: Year-over-year growth 2025-2030 (%)

5. Historic Market Size

5.1 Global Robotic Medical Imaging Systems Market 2020 - 2024

Historic Market Size - Data Table on Global Robotic Medical Imaging Systems Market 2020 - 2024 ($ million)

5.2 Product segment analysis 2020 - 2024

Historic Market Size - Product Segment 2020 - 2024 ($ million)

5.3 Application segment analysis 2020 - 2024

Historic Market Size - Application Segment 2020 - 2024 ($ million)

5.4 End-user segment analysis 2020 - 2024

Historic Market Size - End-user Segment 2020 - 2024 ($ million)

5.5 Geography segment analysis 2020 - 2024

Historic Market Size - Geography Segment 2020 - 2024 ($ million)

5.6 Country segment analysis 2020 - 2024

Historic Market Size - Country Segment 2020 - 2024 ($ million)

6. Qualitative Analysis

6.1 The AI impact on Global Robotic Medical Imaging Systems Market

7. Five Forces Analysis

7.1 Five forces summary

Five forces analysis - Comparison between 2025 and 2030

7.2 Bargaining power of buyers

Bargaining power of buyers - Impact of key factors 2025 and 2030

7.3 Bargaining power of suppliers

Bargaining power of suppliers - Impact of key factors in 2025 and 2030

7.4 Threat of new entrants

Threat of new entrants - Impact of key factors in 2025 and 2030

7.5 Threat of substitutes

Threat of substitutes - Impact of key factors in 2025 and 2030

7.6 Threat of rivalry

Threat of rivalry - Impact of key factors in 2025 and 2030

7.7 Market condition

Chart on Market condition - Five forces 2025 and 2030

8. Market Segmentation by Product

8.1 Market segments

Chart on Product - Market share 2025-2030 (%)
Data Table on Product - Market share 2025-2030 (%)

8.2 Comparison by Product

Chart on Comparison by Product
Data Table on Comparison by Product

8.3 X-ray - Market size and forecast 2025-2030

Chart on X-ray - Market size and forecast 2025-2030 ($ million)
Data Table on X-ray - Market size and forecast 2025-2030 ($ million)
Chart on X-ray - Year-over-year growth 2025-2030 (%)
Data Table on X-ray - Year-over-year growth 2025-2030 (%)

8.4 Ultrasound - Market size and forecast 2025-2030

Chart on Ultrasound - Market size and forecast 2025-2030 ($ million)
Data Table on Ultrasound - Market size and forecast 2025-2030 ($ million)
Chart on Ultrasound - Year-over-year growth 2025-2030 (%)
Data Table on Ultrasound - Year-over-year growth 2025-2030 (%)

8.5 MRI - Market size and forecast 2025-2030

Chart on MRI - Market size and forecast 2025-2030 ($ million)
Data Table on MRI - Market size and forecast 2025-2030 ($ million)
Chart on MRI - Year-over-year growth 2025-2030 (%)
Data Table on MRI - Year-over-year growth 2025-2030 (%)

8.6 CT-scan - Market size and forecast 2025-2030

Chart on CT-scan - Market size and forecast 2025-2030 ($ million)
Data Table on CT-scan - Market size and forecast 2025-2030 ($ million)
Chart on CT-scan - Year-over-year growth 2025-2030 (%)
Data Table on CT-scan - Year-over-year growth 2025-2030 (%)

8.7 Market opportunity by Product

Market opportunity by Product ($ million)
Data Table on Market opportunity by Product ($ million)

9. Market Segmentation by Application

9.1 Market segments

Chart on Application - Market share 2025-2030 (%)
Data Table on Application - Market share 2025-2030 (%)

9.2 Comparison by Application

Chart on Comparison by Application
Data Table on Comparison by Application

9.3 Interventional radiology - Market size and forecast 2025-2030

Chart on Interventional radiology - Market size and forecast 2025-2030 ($ million)
Data Table on Interventional radiology - Market size and forecast 2025-2030 ($ million)
Chart on Interventional radiology - Year-over-year growth 2025-2030 (%)
Data Table on Interventional radiology - Year-over-year growth 2025-2030 (%)

9.4 Orthopedic and spine surgery - Market size and forecast 2025-2030

Chart on Orthopedic and spine surgery - Market size and forecast 2025-2030 ($ million)
Data Table on Orthopedic and spine surgery - Market size and forecast 2025-2030 ($ million)
Chart on Orthopedic and spine surgery - Year-over-year growth 2025-2030 (%)
Data Table on Orthopedic and spine surgery - Year-over-year growth 2025-2030 (%)

9.5 Neurosurgery - Market size and forecast 2025-2030

Chart on Neurosurgery - Market size and forecast 2025-2030 ($ million)
Data Table on Neurosurgery - Market size and forecast 2025-2030 ($ million)
Chart on Neurosurgery - Year-over-year growth 2025-2030 (%)
Data Table on Neurosurgery - Year-over-year growth 2025-2030 (%)

9.6 Others - Market size and forecast 2025-2030

Chart on Others - Market size and forecast 2025-2030 ($ million)
Data Table on Others - Market size and forecast 2025-2030 ($ million)
Chart on Others - Year-over-year growth 2025-2030 (%)
Data Table on Others - Year-over-year growth 2025-2030 (%)

9.7 Market opportunity by Application

Market opportunity by Application ($ million)
Data Table on Market opportunity by Application ($ million)

10. Market Segmentation by End-user

10.1 Market segments

Chart on End-user - Market share 2025-2030 (%)
Data Table on End-user - Market share 2025-2030 (%)

10.2 Comparison by End-user

Chart on Comparison by End-user
Data Table on Comparison by End-user

10.3 Hospitals - Market size and forecast 2025-2030

Chart on Hospitals - Market size and forecast 2025-2030 ($ million)
Data Table on Hospitals - Market size and forecast 2025-2030 ($ million)
Chart on Hospitals - Year-over-year growth 2025-2030 (%)
Data Table on Hospitals - Year-over-year growth 2025-2030 (%)

10.4 Specialty clinics - Market size and forecast 2025-2030

Chart on Specialty clinics - Market size and forecast 2025-2030 ($ million)
Data Table on Specialty clinics - Market size and forecast 2025-2030 ($ million)
Chart on Specialty clinics - Year-over-year growth 2025-2030 (%)
Data Table on Specialty clinics - Year-over-year growth 2025-2030 (%)

10.5 Ambulatory surgical centers - Market size and forecast 2025-2030

Chart on Ambulatory surgical centers - Market size and forecast 2025-2030 ($ million)
Data Table on Ambulatory surgical centers - Market size and forecast 2025-2030 ($ million)
Chart on Ambulatory surgical centers - Year-over-year growth 2025-2030 (%)
Data Table on Ambulatory surgical centers - Year-over-year growth 2025-2030 (%)

10.6 Market opportunity by End-user

Market opportunity by End-user ($ million)
Data Table on Market opportunity by End-user ($ million)

11. Customer Landscape

11.1 Customer landscape overview

Analysis of price sensitivity, lifecycle, customer purchase basket, adoption rates, and purchase criteria

12. Geographic Landscape

12.1 Geographic segmentation

Chart on Market share by geography 2025-2030 (%)
Data Table on Market share by geography 2025-2030 (%)

12.2 Geographic comparison

Chart on Geographic comparison
Data Table on Geographic comparison

12.3 North America - Market size and forecast 2025-2030

Chart on North America - Market size and forecast 2025-2030 ($ million)
Data Table on North America - Market size and forecast 2025-2030 ($ million)
Chart on North America - Year-over-year growth 2025-2030 (%)
Data Table on North America - Year-over-year growth 2025-2030 (%)
Chart on Regional Comparison - North America
Data Table on Regional Comparison - North America

12.3.1 US - Market size and forecast 2025-2030

Chart on US - Market size and forecast 2025-2030 ($ million)
Data Table on US - Market size and forecast 2025-2030 ($ million)
Chart on US - Year-over-year growth 2025-2030 (%)
Data Table on US - Year-over-year growth 2025-2030 (%)

12.3.2 Canada - Market size and forecast 2025-2030

Chart on Canada - Market size and forecast 2025-2030 ($ million)
Data Table on Canada - Market size and forecast 2025-2030 ($ million)
Chart on Canada - Year-over-year growth 2025-2030 (%)
Data Table on Canada - Year-over-year growth 2025-2030 (%)

12.3.3 Mexico - Market size and forecast 2025-2030

Chart on Mexico - Market size and forecast 2025-2030 ($ million)
Data Table on Mexico - Market size and forecast 2025-2030 ($ million)
Chart on Mexico - Year-over-year growth 2025-2030 (%)
Data Table on Mexico - Year-over-year growth 2025-2030 (%)

12.4 Europe - Market size and forecast 2025-2030

Chart on Europe - Market size and forecast 2025-2030 ($ million)
Data Table on Europe - Market size and forecast 2025-2030 ($ million)
Chart on Europe - Year-over-year growth 2025-2030 (%)
Data Table on Europe - Year-over-year growth 2025-2030 (%)
Chart on Regional Comparison - Europe
Data Table on Regional Comparison - Europe

12.4.1 Germany - Market size and forecast 2025-2030

Chart on Germany - Market size and forecast 2025-2030 ($ million)
Data Table on Germany - Market size and forecast 2025-2030 ($ million)
Chart on Germany - Year-over-year growth 2025-2030 (%)
Data Table on Germany - Year-over-year growth 2025-2030 (%)

12.4.2 UK - Market size and forecast 2025-2030

Chart on UK - Market size and forecast 2025-2030 ($ million)
Data Table on UK - Market size and forecast 2025-2030 ($ million)
Chart on UK - Year-over-year growth 2025-2030 (%)
Data Table on UK - Year-over-year growth 2025-2030 (%)

12.4.3 France - Market size and forecast 2025-2030

Chart on France - Market size and forecast 2025-2030 ($ million)
Data Table on France - Market size and forecast 2025-2030 ($ million)
Chart on France - Year-over-year growth 2025-2030 (%)
Data Table on France - Year-over-year growth 2025-2030 (%)

12.4.4 Italy - Market size and forecast 2025-2030

Chart on Italy - Market size and forecast 2025-2030 ($ million)
Data Table on Italy - Market size and forecast 2025-2030 ($ million)
Chart on Italy - Year-over-year growth 2025-2030 (%)
Data Table on Italy - Year-over-year growth 2025-2030 (%)

12.4.5 Spain - Market size and forecast 2025-2030

Chart on Spain - Market size and forecast 2025-2030 ($ million)
Data Table on Spain - Market size and forecast 2025-2030 ($ million)
Chart on Spain - Year-over-year growth 2025-2030 (%)
Data Table on Spain - Year-over-year growth 2025-2030 (%)

12.4.6 The Netherlands - Market size and forecast 2025-2030

Chart on The Netherlands - Market size and forecast 2025-2030 ($ million)
Data Table on The Netherlands - Market size and forecast 2025-2030 ($ million)
Chart on The Netherlands - Year-over-year growth 2025-2030 (%)
Data Table on The Netherlands - Year-over-year growth 2025-2030 (%)

12.5 APAC - Market size and forecast 2025-2030

Chart on APAC - Market size and forecast 2025-2030 ($ million)
Data Table on APAC - Market size and forecast 2025-2030 ($ million)
Chart on APAC - Year-over-year growth 2025-2030 (%)
Data Table on APAC - Year-over-year growth 2025-2030 (%)
Chart on Regional Comparison - APAC
Data Table on Regional Comparison - APAC

12.5.1 China - Market size and forecast 2025-2030

Chart on China - Market size and forecast 2025-2030 ($ million)
Data Table on China - Market size and forecast 2025-2030 ($ million)
Chart on China - Year-over-year growth 2025-2030 (%)
Data Table on China - Year-over-year growth 2025-2030 (%)

12.5.2 Japan - Market size and forecast 2025-2030

Chart on Japan - Market size and forecast 2025-2030 ($ million)
Data Table on Japan - Market size and forecast 2025-2030 ($ million)
Chart on Japan - Year-over-year growth 2025-2030 (%)
Data Table on Japan - Year-over-year growth 2025-2030 (%)

12.5.3 India - Market size and forecast 2025-2030

Chart on India - Market size and forecast 2025-2030 ($ million)
Data Table on India - Market size and forecast 2025-2030 ($ million)
Chart on India - Year-over-year growth 2025-2030 (%)
Data Table on India - Year-over-year growth 2025-2030 (%)

12.5.4 South Korea - Market size and forecast 2025-2030

Chart on South Korea - Market size and forecast 2025-2030 ($ million)
Data Table on South Korea - Market size and forecast 2025-2030 ($ million)
Chart on South Korea - Year-over-year growth 2025-2030 (%)
Data Table on South Korea - Year-over-year growth 2025-2030 (%)

12.5.5 Australia - Market size and forecast 2025-2030

Chart on Australia - Market size and forecast 2025-2030 ($ million)
Data Table on Australia - Market size and forecast 2025-2030 ($ million)
Chart on Australia - Year-over-year growth 2025-2030 (%)
Data Table on Australia - Year-over-year growth 2025-2030 (%)

12.5.6 Indonesia - Market size and forecast 2025-2030

Chart on Indonesia - Market size and forecast 2025-2030 ($ million)
Data Table on Indonesia - Market size and forecast 2025-2030 ($ million)
Chart on Indonesia - Year-over-year growth 2025-2030 (%)
Data Table on Indonesia - Year-over-year growth 2025-2030 (%)

12.6 South America - Market size and forecast 2025-2030

Chart on South America - Market size and forecast 2025-2030 ($ million)
Data Table on South America - Market size and forecast 2025-2030 ($ million)
Chart on South America - Year-over-year growth 2025-2030 (%)
Data Table on South America - Year-over-year growth 2025-2030 (%)
Chart on Regional Comparison - South America
Data Table on Regional Comparison - South America

12.6.1 Brazil - Market size and forecast 2025-2030

Chart on Brazil - Market size and forecast 2025-2030 ($ million)
Data Table on Brazil - Market size and forecast 2025-2030 ($ million)
Chart on Brazil - Year-over-year growth 2025-2030 (%)
Data Table on Brazil - Year-over-year growth 2025-2030 (%)

12.6.2 Argentina - Market size and forecast 2025-2030

Chart on Argentina - Market size and forecast 2025-2030 ($ million)
Data Table on Argentina - Market size and forecast 2025-2030 ($ million)
Chart on Argentina - Year-over-year growth 2025-2030 (%)
Data Table on Argentina - Year-over-year growth 2025-2030 (%)

12.6.3 Colombia - Market size and forecast 2025-2030

Chart on Colombia - Market size and forecast 2025-2030 ($ million)
Data Table on Colombia - Market size and forecast 2025-2030 ($ million)
Chart on Colombia - Year-over-year growth 2025-2030 (%)
Data Table on Colombia - Year-over-year growth 2025-2030 (%)

12.7 Middle East and Africa - Market size and forecast 2025-2030

Chart on Middle East and Africa - Market size and forecast 2025-2030 ($ million)
Data Table on Middle East and Africa - Market size and forecast 2025-2030 ($ million)
Chart on Middle East and Africa - Year-over-year growth 2025-2030 (%)
Data Table on Middle East and Africa - Year-over-year growth 2025-2030 (%)
Chart on Regional Comparison - Middle East and Africa
Data Table on Regional Comparison - Middle East and Africa

12.7.1 Saudi Arabia - Market size and forecast 2025-2030

Chart on Saudi Arabia - Market size and forecast 2025-2030 ($ million)
Data Table on Saudi Arabia - Market size and forecast 2025-2030 ($ million)
Chart on Saudi Arabia - Year-over-year growth 2025-2030 (%)
Data Table on Saudi Arabia - Year-over-year growth 2025-2030 (%)

12.7.2 UAE - Market size and forecast 2025-2030

Chart on UAE - Market size and forecast 2025-2030 ($ million)
Data Table on UAE - Market size and forecast 2025-2030 ($ million)
Chart on UAE - Year-over-year growth 2025-2030 (%)
Data Table on UAE - Year-over-year growth 2025-2030 (%)

12.7.3 South Africa - Market size and forecast 2025-2030

Chart on South Africa - Market size and forecast 2025-2030 ($ million)
Data Table on South Africa - Market size and forecast 2025-2030 ($ million)
Chart on South Africa - Year-over-year growth 2025-2030 (%)
Data Table on South Africa - Year-over-year growth 2025-2030 (%)

12.7.4 Israel - Market size and forecast 2025-2030

Chart on Israel - Market size and forecast 2025-2030 ($ million)
Data Table on Israel - Market size and forecast 2025-2030 ($ million)
Chart on Israel - Year-over-year growth 2025-2030 (%)
Data Table on Israel - Year-over-year growth 2025-2030 (%)

12.7.5 Turkey - Market size and forecast 2025-2030

Chart on Turkey - Market size and forecast 2025-2030 ($ million)
Data Table on Turkey - Market size and forecast 2025-2030 ($ million)
Chart on Turkey - Year-over-year growth 2025-2030 (%)
Data Table on Turkey - Year-over-year growth 2025-2030 (%)

12.8 Market opportunity by geography

Market opportunity by geography ($ million)
Data Tables on Market opportunity by geography ($ million)

13. Drivers, Challenges, and Opportunity

13.1 Market drivers

Technological integration of AI and automation
Rising prevalence of chronic diseases and aging populations
Workforce shortages and imperative for workflow efficiency

13.2 Market challenges

High cost of acquisition and maintenance
Regulatory hurdles and safety compliance
Technical integration and workforce barriers

13.3 Impact of drivers and challenges

Impact of drivers and challenges in 2025 and 2030

13.4 Market opportunities

Integration of ML for enhanced precision
Expansion of minimally invasive and image-guided interventional robotics
Advancements in remote and tele-robotic imaging capabilities

14. Competitive Landscape

14.1 Overview

14.2

Overview on criticality of inputs and factors of differentiation

14.3 Landscape disruption

Overview on factors of disruption

14.4 Industry risks

Impact of key risks on business

15. Competitive Analysis

15.1 Companies profiled

Companies covered

15.2 Company ranking index

15.3 Market positioning of companies

Matrix on companies position and classification

15.4 AdEchoTech

AdEchoTech - Overview
AdEchoTech - Product / Service
AdEchoTech - Key offerings
SWOT

15.5 Asensus Surgical US Inc.

Asensus Surgical US Inc. - Overview
Asensus Surgical US Inc. - Product / Service
Asensus Surgical US Inc. - Key offerings
SWOT

15.6 Brainlab AG

Brainlab AG - Overview
Brainlab AG - Product / Service
Brainlab AG - Key offerings
SWOT

15.7 General Electric Co.

General Electric Co. - Overview
General Electric Co. - Business segments
General Electric Co. - Key news
General Electric Co. - Key offerings
General Electric Co. - Segment focus
SWOT

15.8 Globus Medical Inc.

Globus Medical Inc. - Overview
Globus Medical Inc. - Product / Service
Globus Medical Inc. - Key offerings
SWOT

15.9 Intuitive Surgical Inc.

Intuitive Surgical Inc. - Overview
Intuitive Surgical Inc. - Product / Service
Intuitive Surgical Inc. - Key offerings
SWOT

15.10 Johnson and Johnson Services

Johnson and Johnson Services - Overview
Johnson and Johnson Services - Business segments
Johnson and Johnson Services - Key news
Johnson and Johnson Services - Key offerings
Johnson and Johnson Services - Segment focus
SWOT

15.11 KUKA AG

KUKA AG - Overview
KUKA AG - Business segments
KUKA AG - Key offerings
KUKA AG - Segment focus
SWOT

15.12 Medtronic Plc

Medtronic Plc - Overview
Medtronic Plc - Business segments
Medtronic Plc - Key news
Medtronic Plc - Key offerings
Medtronic Plc - Segment focus
SWOT

15.13 Renishaw Plc

Renishaw Plc - Overview
Renishaw Plc - Business segments
Renishaw Plc - Key offerings
Renishaw Plc - Segment focus
SWOT

15.14 Siemens Healthineers AG

Siemens Healthineers AG - Overview
Siemens Healthineers AG - Business segments
Siemens Healthineers AG - Key news
Siemens Healthineers AG - Key offerings
Siemens Healthineers AG - Segment focus
SWOT

15.15 Smith and Nephew plc

Smith and Nephew plc - Overview
Smith and Nephew plc - Business segments
Smith and Nephew plc - Key news
Smith and Nephew plc - Key offerings
Smith and Nephew plc - Segment focus
SWOT

15.16 Stereotaxis Inc.

Stereotaxis Inc. - Overview
Stereotaxis Inc. - Product / Service
Stereotaxis Inc. - Key offerings
SWOT

15.17 Stryker Corp.

Stryker Corp. - Overview
Stryker Corp. - Business segments
Stryker Corp. - Key news
Stryker Corp. - Key offerings
Stryker Corp. - Segment focus
SWOT

15.18 Zimmer Biomet Holdings Inc.

Zimmer Biomet Holdings Inc. - Overview
Zimmer Biomet Holdings Inc. - Business segments
Zimmer Biomet Holdings Inc. - Key news
Zimmer Biomet Holdings Inc. - Key offerings
Zimmer Biomet Holdings Inc. - Segment focus
SWOT

16. Appendix

16.1 Scope of the report

Market definition
Objectives
Notes and caveats

16.2 Inclusions and exclusions checklist

Inclusions checklist
Exclusions checklist

16.3 Currency conversion rates for US$

16.4 Research methodology

16.5 Data procurement

Information sources

16.6 Data validation

16.7 Validation techniques employed for market sizing

16.8 Data synthesis

16.9 360 degree market analysis

16.10 List of abbreviations

Research Methodology

Technavio presents a detailed picture of the market by way of study, synthesis, and summation of data from multiple sources. The analysts have presented the various facets of the market with a particular focus on identifying the key industry influencers. The data thus presented is comprehensive, reliable, and the result of extensive research, both primary and secondary.

INFORMATION SOURCES

Primary sources

  • Manufacturers and suppliers
  • Channel partners
  • Industry experts
  • Strategic decision makers

Secondary sources

  • Industry journals and periodicals
  • Government data
  • Financial reports of key industry players
  • Historical data
  • Press releases

DATA ANALYSIS

Data Synthesis

  • Collation of data
  • Estimation of key figures
  • Analysis of derived insights

Data Validation

  • Triangulation with data models
  • Reference against proprietary databases
  • Corroboration with industry experts

REPORT WRITING

Qualitative

  • Market drivers
  • Market challenges
  • Market trends
  • Five forces analysis

Quantitative

  • Market size and forecast
  • Market segmentation
  • Geographical insights
  • Competitive landscape

Interested in this report?

Get your sample now to see our research methodology and insights!

Download Now

Frequently Asked Questions

Robotic Medical Imaging Systems market growth will increase by USD 1036.3 million during 2026-2030.

The Robotic Medical Imaging Systems market is expected to grow at a CAGR of 17.2% during 2026-2030.

Robotic Medical Imaging Systems market is segmented by Product (X-ray, Ultrasound, MRI, CT-scan) Application (Interventional radiology, Orthopedic and spine surgery, Neurosurgery, Others) End-user (Hospitals, Specialty clinics, Ambulatory surgical centers)

AdEchoTech, Asensus Surgical US Inc., Brainlab AG, General Electric Co., Globus Medical Inc., Intuitive Surgical Inc., Johnson and Johnson Services, KUKA AG, Medtronic Plc, MGI Tech Co. Ltd., Neocis Inc., NeuraSignal Inc., Perfint Healthcare Corp., Renishaw Plc, Siemens Healthineers AG, Smith and Nephew plc, Stereotaxis Inc., Stryker Corp., Synaptive Medical Inc., Zimmer Biomet Holdings Inc. are a few of the key vendors in the Robotic Medical Imaging Systems market.

North America will register the highest growth rate of 42.4% among the other regions. Therefore, the Robotic Medical Imaging Systems market in North America is expected to garner significant business opportunities for the vendors during the forecast period.

US, Canada, Mexico, Germany, UK, France, Italy, Spain, The Netherlands, China, Japan, India, South Korea, Australia, Indonesia, Brazil, Argentina, Colombia, Saudi Arabia, UAE, South Africa, Israel, Turkey

  • Technological integration of AI and automation is the driving factor this market.

The Robotic Medical Imaging Systems market vendors should focus on grabbing business opportunities from the Product segment as it accounted for the largest market share in the base year.