Pharmacy Automation Systems Market Analysis, Size, and Forecast 2025-2029: North America (US, Canada, and Mexico), Europe (Germany, UK, and France), APAC (China, Japan, and India), Middle East and Africa (UAE, South Africa, and Saudi Arabia), South America (Brazil), Rest of World (ROW)

Pharmacy Automation Systems Market Analysis, Size, and Forecast 2025-2029:
North America (US, Canada, and Mexico), Europe (Germany, UK, and France), APAC (China, Japan, and India), Middle East and Africa (UAE, South Africa, and Saudi Arabia), South America (Brazil), Rest of World (ROW)

Published: Dec 2025 290 Pages SKU: IRTNTR77068

Market Overview at a Glance

$3.49 B
Market Opportunity
9.2%
CAGR 2024 - 2029
37.5%
North America Growth
$1.68 B
Automated medication dispensing system segment 2023

Pharmacy Automation Systems Market Size 2025-2029

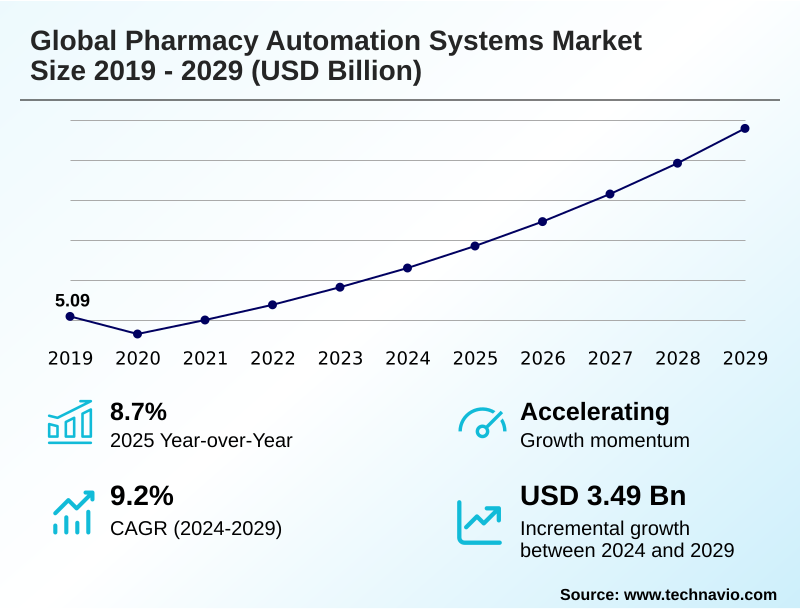
The pharmacy automation systems market size is valued to increase by USD 3.49 billion, at a CAGR of 9.2% from 2024 to 2029. Heightened emphasis on medication error reduction and patient safety will drive the pharmacy automation systems market.

Major Market Trends & Insights

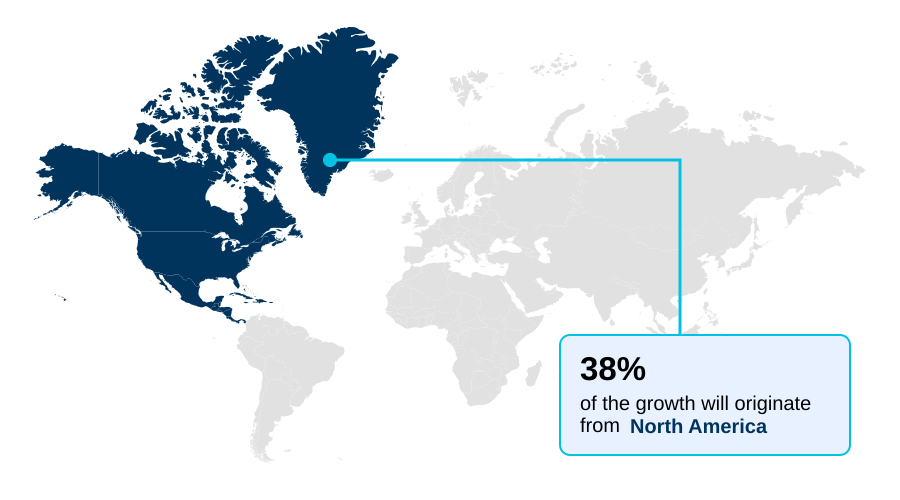
  • North America dominated the market and accounted for a 37.5% growth during the forecast period.
  • By Product Type - Automated medication dispensing system segment was valued at USD 1.68 billion in 2023
  • By End-user - Retail pharmacy segment accounted for the largest market revenue share in 2023

Market Size & Forecast

  • Market Opportunities: USD 4.70 billion
  • Market Future Opportunities: USD 3.49 billion
  • CAGR from 2024 to 2029 : 9.2%

Market Summary

What will be the Size of the Pharmacy Automation Systems Market during the forecast period?

Get Key Insights on Market Forecast (PDF) Request Free Sample

How is the Pharmacy Automation Systems Market Segmented?

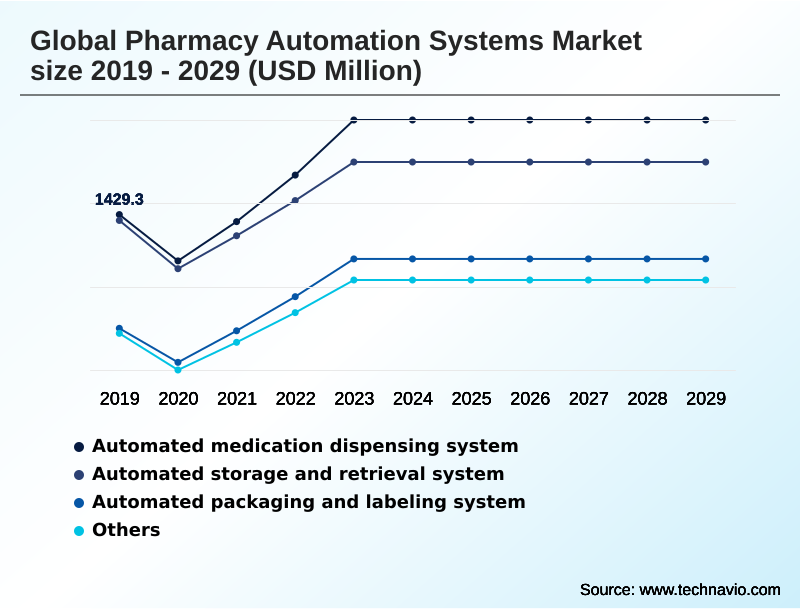
The pharmacy automation systems industry research report provides comprehensive data (region-wise segment analysis), with forecasts and estimates in "USD million" for the period 2025-2029, as well as historical data from 2019-2023 for the following segments.

  • Product type
    • Automated medication dispensing system
    • Automated storage and retrieval system
    • Automated packaging and labeling system
    • Others
  • End-user
    • Retail pharmacy
    • Hospital pharmacy
    • Others
  • Type
    • Semi automatic systems
    • Fully automatic systems
  • Geography
    • North America
      • US
      • Canada
      • Mexico
    • Europe
      • Germany
      • UK
      • France
    • APAC
      • China
      • Japan
      • India
    • Rest of World (ROW)

By Product Type Insights

The automated medication dispensing system segment is estimated to witness significant growth during the forecast period.

Request Free Sample

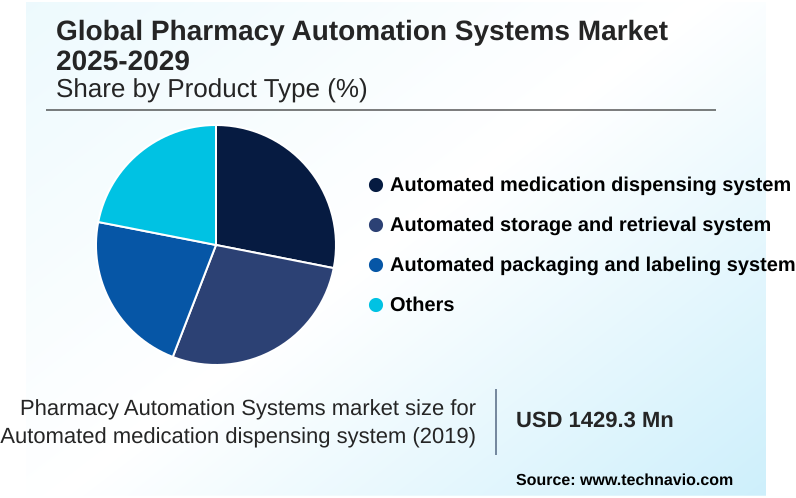
The Automated medication dispensing system segment was valued at USD 1.68 billion in 2023 and showed a gradual increase during the forecast period.

Request Free Sample

Regional Analysis

North America is estimated to contribute 37.5% to the growth of the global market during the forecast period.Technavio’s analysts have elaborately explained the regional trends and drivers that shape the market during the forecast period.

See How Pharmacy Automation Systems Market Demand is Rising in North America Request Free Sample

Market Dynamics

Our researchers analyzed the data with 2024 as the base year, along with the key drivers, trends, and challenges. A holistic analysis of drivers will help companies refine their marketing strategies to gain a competitive advantage.

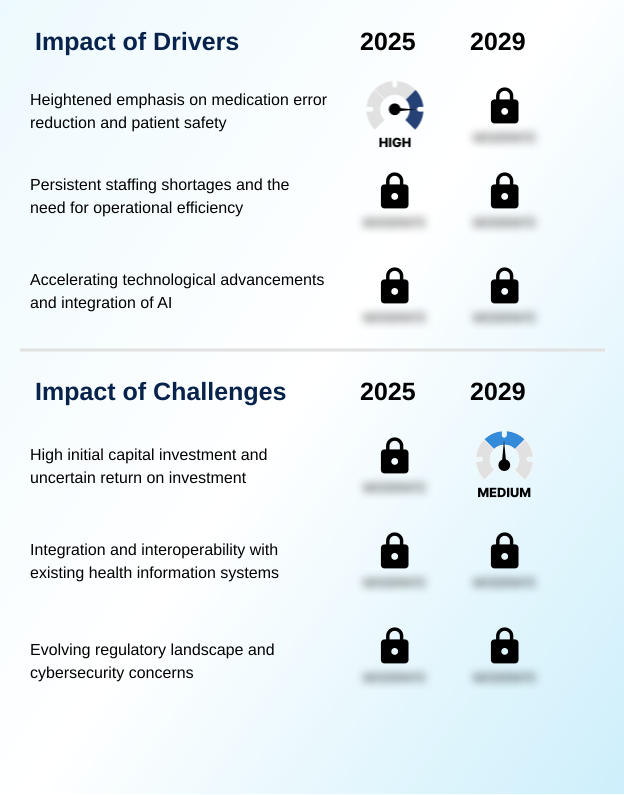
What are the key market drivers leading to the rise in the adoption of Pharmacy Automation Systems Industry?

What are the market trends shaping the Pharmacy Automation Systems Industry?

What challenges does the Pharmacy Automation Systems Industry face during its growth?

Exclusive Technavio Analysis on Customer Landscape

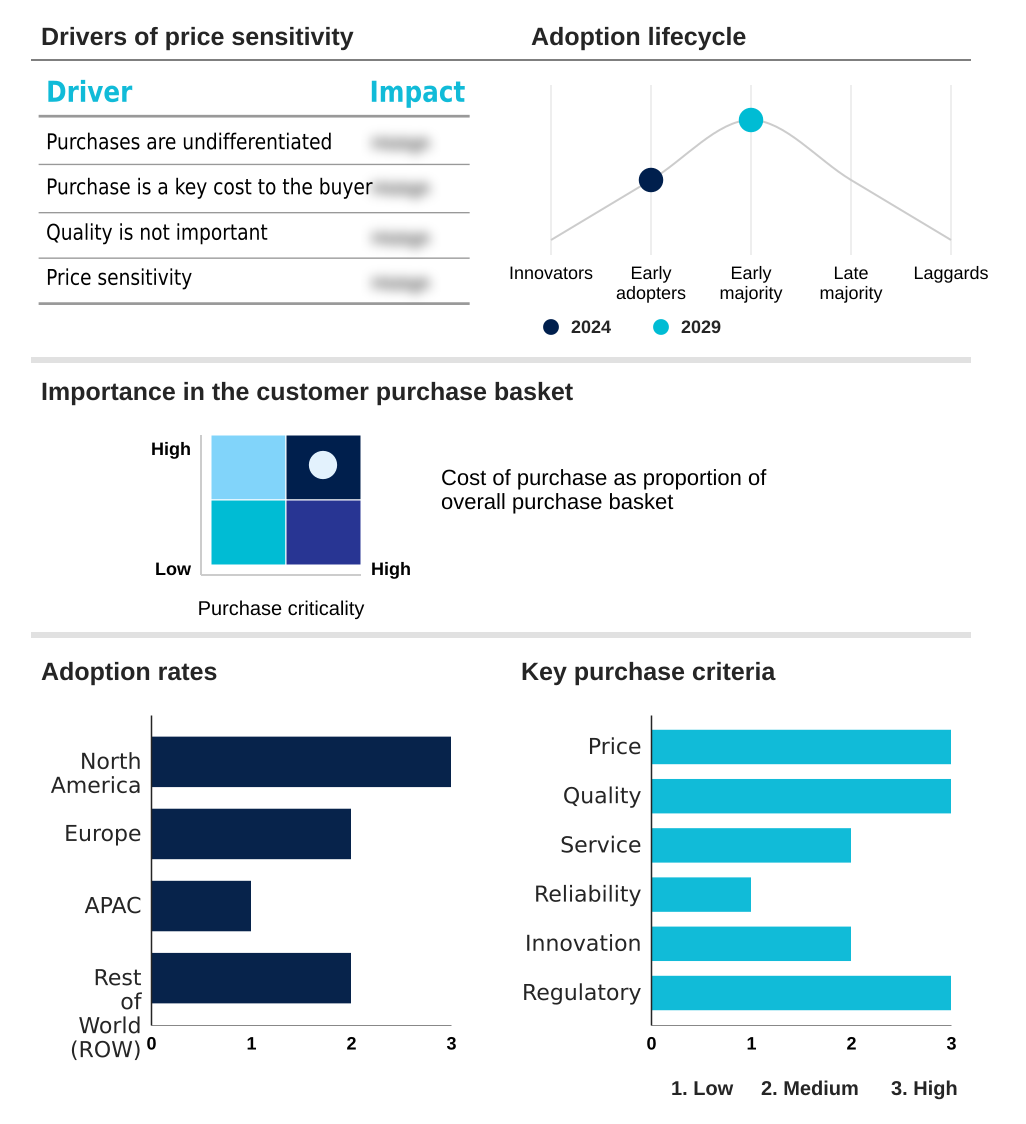
The pharmacy automation systems market forecasting report includes the adoption lifecycle of the market, covering from the innovator’s stage to the laggard’s stage. It focuses on adoption rates in different regions based on penetration. Furthermore, the pharmacy automation systems market report also includes key purchase criteria and drivers of price sensitivity to help companies evaluate and develop their market growth analysis strategies.

Customer Landscape of Pharmacy Automation Systems Industry

Competitive Landscape

Companies are implementing various strategies, such as strategic alliances, pharmacy automation systems market forecast, partnerships, mergers and acquisitions, geographical expansion, and product/service launches, to enhance their presence in the industry.

Accu Chart Plus Healthcare Systems Inc. -

The industry research and growth report includes detailed analyses of the competitive landscape of the market and information about key companies, including:

  • Accu Chart Plus Healthcare Systems Inc.
  • AmerisourceBergen Corp.
  • ARxIUM Inc.
  • Baxter International Inc.
  • Becton Dickinson and Co.
  • Capsa Healthcare LLC
  • McKesson Corp.
  • MIDEA Group Co. Ltd.
  • Omnicell Inc.
  • Optel Group
  • Oracle Corp.
  • Pearson Medical Technologies LLC
  • Rxsafe LLC
  • Scientific Industries Inc.
  • ScriptPro LLC
  • Swisslog Healthcare AG
  • Yuyama USA Inc.

Qualitative and quantitative analysis of companies has been conducted to help clients understand the wider business environment as well as the strengths and weaknesses of key industry players. Data is qualitatively analyzed to categorize companies as pure play, category-focused, industry-focused, and diversified; it is quantitatively analyzed to categorize companies as dominant, leading, strong, tentative, and weak.

Recent Development and News in Pharmacy automation systems market

Dive into Technavio’s robust research methodology, blending expert interviews, extensive data synthesis, and validated models for unparalleled Pharmacy Automation Systems Market insights. See full methodology.

Market Scope
Page number 290
Base year 2024
Historic period 2019-2023
Forecast period 2025-2029
Growth momentum & CAGR Accelerate at a CAGR of 9.2%
Market growth 2025-2029 USD 3492.3 million
Market structure Fragmented
YoY growth 2024-2025(%) 8.7%
Key countries US, Canada, Mexico, Germany, UK, France, Italy, The Netherlands, Spain, Russia, China, Japan, India, South Korea, Australia, Indonesia, Thailand, Singapore, UAE, Brazil, South Africa, Saudi Arabia and Turkey
Competitive landscape Leading Companies, Market Positioning of Companies, Competitive Strategies, and Industry Risks

Request Free Sample

Research Analyst Overview

What are the Key Data Covered in this Pharmacy Automation Systems Market Research and Growth Report?

  • What is the expected growth of the Pharmacy Automation Systems Market between 2025 and 2029?

    • USD 3.49 billion, at a CAGR of 9.2%

  • What segmentation does the market report cover?

    • The report is segmented by Product Type (Automated medication dispensing system, Automated storage and retrieval system, Automated packaging and labeling system, and Others), End-user (Retail pharmacy, Hospital pharmacy, and Others), Type (Semi automatic systems, and Fully automatic systems) and Geography (North America, Europe, APAC, Rest of World (ROW))

  • Which regions are analyzed in the report?

    • North America, Europe, APAC and Rest of World (ROW)

  • What are the key growth drivers and market challenges?

    • Heightened emphasis on medication error reduction and patient safety, High initial capital investment and uncertain return on investment

  • Who are the major players in the Pharmacy Automation Systems Market?

    • Accu Chart Plus Healthcare Systems Inc., AmerisourceBergen Corp., ARxIUM Inc., Baxter International Inc., Becton Dickinson and Co., Capsa Healthcare LLC, McKesson Corp., MIDEA Group Co. Ltd., Omnicell Inc., Optel Group, Oracle Corp., Pearson Medical Technologies LLC, Rxsafe LLC, Scientific Industries Inc., ScriptPro LLC, Swisslog Healthcare AG and Yuyama USA Inc.

Market Research Insights

We can help! Our analysts can customize this pharmacy automation systems market research report to meet your requirements.

Get in touch

1. Executive Summary

1.1 Market overview

Executive Summary - Chart on Market Overview
Executive Summary - Data Table on Market Overview
Executive Summary - Chart on Global Market Characteristics
Executive Summary - Chart on Market by Geography
Executive Summary - Chart on Market Segmentation by Product Type
Executive Summary - Chart on Market Segmentation by End-user
Executive Summary - Chart on Market Segmentation by Type
Executive Summary - Chart on Incremental Growth
Executive Summary - Data Table on Incremental Growth
Executive Summary - Chart on Company Market Positioning

2. Technavio Analysis

2.1 Analysis of price sensitivity, lifecycle, customer purchase basket, adoption rates, and purchase criteria

2.2 Criticality of inputs and Factors of differentiation

Chart on Overview on criticality of inputs and factors of differentiation

2.3 Factors of disruption

Chart on Overview on factors of disruption

2.4 Impact of drivers and challenges

Chart on Impact of drivers and challenges in 2024 and 2029

3. Market Landscape

3.1 Market ecosystem

Chart on Parent Market
Data Table on - Parent Market

3.2 Market characteristics

Chart on Market characteristics analysis

3.3 Value chain analysis

Chart on Value chain analysis

4. Market Sizing

4.1 Market definition

Data Table on Offerings of companies included in the market definition

4.2 Market segment analysis

Market segments

4.3 Market size 2024

4.4 Market outlook: Forecast for 2024-2029

Chart on Global - Market size and forecast 2024-2029 ($ million)
Data Table on Global - Market size and forecast 2024-2029 ($ million)
Chart on Global Market: Year-over-year growth 2024-2029 (%)
Data Table on Global Market: Year-over-year growth 2024-2029 (%)

5. Historic Market Size

5.1 Global Pharmacy Automation Systems Market 2019 - 2023

Historic Market Size - Data Table on Global Pharmacy Automation Systems Market 2019 - 2023 ($ million)

5.2 Product Type segment analysis 2019 - 2023

Historic Market Size - Product Type Segment 2019 - 2023 ($ million)

5.3 End-user segment analysis 2019 - 2023

Historic Market Size - End-user Segment 2019 - 2023 ($ million)

5.4 Type segment analysis 2019 - 2023

Historic Market Size - Type Segment 2019 - 2023 ($ million)

5.5 Geography segment analysis 2019 - 2023

Historic Market Size - Geography Segment 2019 - 2023 ($ million)

5.6 Country segment analysis 2019 - 2023

Historic Market Size - Country Segment 2019 - 2023 ($ million)

6. Qualitative Analysis

6.1 Impact of AI in global pharmacy automation systems market

7. Five Forces Analysis

7.1 Five forces summary

Five forces analysis - Comparison between 2024 and 2029

7.2 Bargaining power of buyers

Bargaining power of buyers - Impact of key factors 2024 and 2029

7.3 Bargaining power of suppliers

Bargaining power of suppliers - Impact of key factors in 2024 and 2029

7.4 Threat of new entrants

Threat of new entrants - Impact of key factors in 2024 and 2029

7.5 Threat of substitutes

Threat of substitutes - Impact of key factors in 2024 and 2029

7.6 Threat of rivalry

Threat of rivalry - Impact of key factors in 2024 and 2029

7.7 Market condition

Chart on Market condition - Five forces 2024 and 2029

8. Market Segmentation by Product Type

8.1 Market segments

Chart on Product Type - Market share 2024-2029 (%)
Data Table on Product Type - Market share 2024-2029 (%)

8.2 Comparison by Product Type

Chart on Comparison by Product Type
Data Table on Comparison by Product Type

8.3 Automated medication dispensing system - Market size and forecast 2024-2029

Chart on Automated medication dispensing system - Market size and forecast 2024-2029 ($ million)
Data Table on Automated medication dispensing system - Market size and forecast 2024-2029 ($ million)
Chart on Automated medication dispensing system - Year-over-year growth 2024-2029 (%)
Data Table on Automated medication dispensing system - Year-over-year growth 2024-2029 (%)

8.4 Automated storage and retrieval system - Market size and forecast 2024-2029

Chart on Automated storage and retrieval system - Market size and forecast 2024-2029 ($ million)
Data Table on Automated storage and retrieval system - Market size and forecast 2024-2029 ($ million)
Chart on Automated storage and retrieval system - Year-over-year growth 2024-2029 (%)
Data Table on Automated storage and retrieval system - Year-over-year growth 2024-2029 (%)

8.5 Automated packaging and labeling system - Market size and forecast 2024-2029

Chart on Automated packaging and labeling system - Market size and forecast 2024-2029 ($ million)
Data Table on Automated packaging and labeling system - Market size and forecast 2024-2029 ($ million)
Chart on Automated packaging and labeling system - Year-over-year growth 2024-2029 (%)
Data Table on Automated packaging and labeling system - Year-over-year growth 2024-2029 (%)

8.6 Others - Market size and forecast 2024-2029

Chart on Others - Market size and forecast 2024-2029 ($ million)
Data Table on Others - Market size and forecast 2024-2029 ($ million)
Chart on Others - Year-over-year growth 2024-2029 (%)
Data Table on Others - Year-over-year growth 2024-2029 (%)

8.7 Market opportunity by Product Type

Market opportunity by Product Type ($ million)
Data Table on Market opportunity by Product Type ($ million)

9. Market Segmentation by End-user

9.1 Market segments

Chart on End-user - Market share 2024-2029 (%)
Data Table on End-user - Market share 2024-2029 (%)

9.2 Comparison by End-user

Chart on Comparison by End-user
Data Table on Comparison by End-user

9.3 Retail pharmacy - Market size and forecast 2024-2029

Chart on Retail pharmacy - Market size and forecast 2024-2029 ($ million)
Data Table on Retail pharmacy - Market size and forecast 2024-2029 ($ million)
Chart on Retail pharmacy - Year-over-year growth 2024-2029 (%)
Data Table on Retail pharmacy - Year-over-year growth 2024-2029 (%)

9.4 Hospital pharmacy - Market size and forecast 2024-2029

Chart on Hospital pharmacy - Market size and forecast 2024-2029 ($ million)
Data Table on Hospital pharmacy - Market size and forecast 2024-2029 ($ million)
Chart on Hospital pharmacy - Year-over-year growth 2024-2029 (%)
Data Table on Hospital pharmacy - Year-over-year growth 2024-2029 (%)

9.5 Others - Market size and forecast 2024-2029

Chart on Others - Market size and forecast 2024-2029 ($ million)
Data Table on Others - Market size and forecast 2024-2029 ($ million)
Chart on Others - Year-over-year growth 2024-2029 (%)
Data Table on Others - Year-over-year growth 2024-2029 (%)

9.6 Market opportunity by End-user

Market opportunity by End-user ($ million)
Data Table on Market opportunity by End-user ($ million)

10. Market Segmentation by Type

10.1 Market segments

Chart on Type - Market share 2024-2029 (%)
Data Table on Type - Market share 2024-2029 (%)

10.2 Comparison by Type

Chart on Comparison by Type
Data Table on Comparison by Type

10.3 Semi automatic systems - Market size and forecast 2024-2029

Chart on Semi automatic systems - Market size and forecast 2024-2029 ($ million)
Data Table on Semi automatic systems - Market size and forecast 2024-2029 ($ million)
Chart on Semi automatic systems - Year-over-year growth 2024-2029 (%)
Data Table on Semi automatic systems - Year-over-year growth 2024-2029 (%)

10.4 Fully automatic systems - Market size and forecast 2024-2029

Chart on Fully automatic systems - Market size and forecast 2024-2029 ($ million)
Data Table on Fully automatic systems - Market size and forecast 2024-2029 ($ million)
Chart on Fully automatic systems - Year-over-year growth 2024-2029 (%)
Data Table on Fully automatic systems - Year-over-year growth 2024-2029 (%)

10.5 Market opportunity by Type

Market opportunity by Type ($ million)
Data Table on Market opportunity by Type ($ million)

11. Customer Landscape

11.1 Customer landscape overview

Analysis of price sensitivity, lifecycle, customer purchase basket, adoption rates, and purchase criteria

12. Geographic Landscape

12.1 Geographic segmentation

Chart on Market share by geography 2024-2029 (%)
Data Table on Market share by geography 2024-2029 (%)

12.2 Geographic comparison

Chart on Geographic comparison
Data Table on Geographic comparison

12.3 North America - Market size and forecast 2024-2029

Chart on North America - Market size and forecast 2024-2029 ($ million)
Data Table on North America - Market size and forecast 2024-2029 ($ million)
Chart on North America - Year-over-year growth 2024-2029 (%)
Data Table on North America - Year-over-year growth 2024-2029 (%)
Chart on Regional Comparison - North America
Data Table on Regional Comparison - North America

12.3.1 US - Market size and forecast 2024-2029

Chart on US - Market size and forecast 2024-2029 ($ million)
Data Table on US - Market size and forecast 2024-2029 ($ million)
Chart on US - Year-over-year growth 2024-2029 (%)
Data Table on US - Year-over-year growth 2024-2029 (%)

12.3.2 Canada - Market size and forecast 2024-2029

Chart on Canada - Market size and forecast 2024-2029 ($ million)
Data Table on Canada - Market size and forecast 2024-2029 ($ million)
Chart on Canada - Year-over-year growth 2024-2029 (%)
Data Table on Canada - Year-over-year growth 2024-2029 (%)

12.3.3 Mexico - Market size and forecast 2024-2029

Chart on Mexico - Market size and forecast 2024-2029 ($ million)
Data Table on Mexico - Market size and forecast 2024-2029 ($ million)
Chart on Mexico - Year-over-year growth 2024-2029 (%)
Data Table on Mexico - Year-over-year growth 2024-2029 (%)

12.4 Europe - Market size and forecast 2024-2029

Chart on Europe - Market size and forecast 2024-2029 ($ million)
Data Table on Europe - Market size and forecast 2024-2029 ($ million)
Chart on Europe - Year-over-year growth 2024-2029 (%)
Data Table on Europe - Year-over-year growth 2024-2029 (%)
Chart on Regional Comparison - Europe
Data Table on Regional Comparison - Europe

12.4.1 Germany - Market size and forecast 2024-2029

Chart on Germany - Market size and forecast 2024-2029 ($ million)
Data Table on Germany - Market size and forecast 2024-2029 ($ million)
Chart on Germany - Year-over-year growth 2024-2029 (%)
Data Table on Germany - Year-over-year growth 2024-2029 (%)

12.4.2 UK - Market size and forecast 2024-2029

Chart on UK - Market size and forecast 2024-2029 ($ million)
Data Table on UK - Market size and forecast 2024-2029 ($ million)
Chart on UK - Year-over-year growth 2024-2029 (%)
Data Table on UK - Year-over-year growth 2024-2029 (%)

12.4.3 France - Market size and forecast 2024-2029

Chart on France - Market size and forecast 2024-2029 ($ million)
Data Table on France - Market size and forecast 2024-2029 ($ million)
Chart on France - Year-over-year growth 2024-2029 (%)
Data Table on France - Year-over-year growth 2024-2029 (%)

12.4.4 Italy - Market size and forecast 2024-2029

Chart on Italy - Market size and forecast 2024-2029 ($ million)
Data Table on Italy - Market size and forecast 2024-2029 ($ million)
Chart on Italy - Year-over-year growth 2024-2029 (%)
Data Table on Italy - Year-over-year growth 2024-2029 (%)

12.4.5 The Netherlands - Market size and forecast 2024-2029

Chart on The Netherlands - Market size and forecast 2024-2029 ($ million)
Data Table on The Netherlands - Market size and forecast 2024-2029 ($ million)
Chart on The Netherlands - Year-over-year growth 2024-2029 (%)
Data Table on The Netherlands - Year-over-year growth 2024-2029 (%)

12.4.6 Spain - Market size and forecast 2024-2029

Chart on Spain - Market size and forecast 2024-2029 ($ million)
Data Table on Spain - Market size and forecast 2024-2029 ($ million)
Chart on Spain - Year-over-year growth 2024-2029 (%)
Data Table on Spain - Year-over-year growth 2024-2029 (%)

12.4.7 Russia - Market size and forecast 2024-2029

Chart on Russia - Market size and forecast 2024-2029 ($ million)
Data Table on Russia - Market size and forecast 2024-2029 ($ million)
Chart on Russia - Year-over-year growth 2024-2029 (%)
Data Table on Russia - Year-over-year growth 2024-2029 (%)

12.5 APAC - Market size and forecast 2024-2029

Chart on APAC - Market size and forecast 2024-2029 ($ million)
Data Table on APAC - Market size and forecast 2024-2029 ($ million)
Chart on APAC - Year-over-year growth 2024-2029 (%)
Data Table on APAC - Year-over-year growth 2024-2029 (%)
Chart on Regional Comparison - APAC
Data Table on Regional Comparison - APAC

12.5.1 China - Market size and forecast 2024-2029

Chart on China - Market size and forecast 2024-2029 ($ million)
Data Table on China - Market size and forecast 2024-2029 ($ million)
Chart on China - Year-over-year growth 2024-2029 (%)
Data Table on China - Year-over-year growth 2024-2029 (%)

12.5.2 Japan - Market size and forecast 2024-2029

Chart on Japan - Market size and forecast 2024-2029 ($ million)
Data Table on Japan - Market size and forecast 2024-2029 ($ million)
Chart on Japan - Year-over-year growth 2024-2029 (%)
Data Table on Japan - Year-over-year growth 2024-2029 (%)

12.5.3 India - Market size and forecast 2024-2029

Chart on India - Market size and forecast 2024-2029 ($ million)
Data Table on India - Market size and forecast 2024-2029 ($ million)
Chart on India - Year-over-year growth 2024-2029 (%)
Data Table on India - Year-over-year growth 2024-2029 (%)

12.5.4 South Korea - Market size and forecast 2024-2029

Chart on South Korea - Market size and forecast 2024-2029 ($ million)
Data Table on South Korea - Market size and forecast 2024-2029 ($ million)
Chart on South Korea - Year-over-year growth 2024-2029 (%)
Data Table on South Korea - Year-over-year growth 2024-2029 (%)

12.5.5 Australia - Market size and forecast 2024-2029

Chart on Australia - Market size and forecast 2024-2029 ($ million)
Data Table on Australia - Market size and forecast 2024-2029 ($ million)
Chart on Australia - Year-over-year growth 2024-2029 (%)
Data Table on Australia - Year-over-year growth 2024-2029 (%)

12.5.6 Indonesia - Market size and forecast 2024-2029

Chart on Indonesia - Market size and forecast 2024-2029 ($ million)
Data Table on Indonesia - Market size and forecast 2024-2029 ($ million)
Chart on Indonesia - Year-over-year growth 2024-2029 (%)
Data Table on Indonesia - Year-over-year growth 2024-2029 (%)

12.5.7 Thailand - Market size and forecast 2024-2029

Chart on Thailand - Market size and forecast 2024-2029 ($ million)
Data Table on Thailand - Market size and forecast 2024-2029 ($ million)
Chart on Thailand - Year-over-year growth 2024-2029 (%)
Data Table on Thailand - Year-over-year growth 2024-2029 (%)

12.5.8 Singapore - Market size and forecast 2024-2029

Chart on Singapore - Market size and forecast 2024-2029 ($ million)
Data Table on Singapore - Market size and forecast 2024-2029 ($ million)
Chart on Singapore - Year-over-year growth 2024-2029 (%)
Data Table on Singapore - Year-over-year growth 2024-2029 (%)

12.6 Rest of World (ROW) - Market size and forecast 2024-2029

Chart on Rest of World (ROW) - Market size and forecast 2024-2029 ($ million)
Data Table on Rest of World (ROW) - Market size and forecast 2024-2029 ($ million)
Chart on Rest of World (ROW) - Year-over-year growth 2024-2029 (%)
Data Table on Rest of World (ROW) - Year-over-year growth 2024-2029 (%)
Chart on Regional Comparison - Rest of World (ROW)
Data Table on Regional Comparison - Rest of World (ROW)

12.6.1 UAE - Market size and forecast 2024-2029

Chart on UAE - Market size and forecast 2024-2029 ($ million)
Data Table on UAE - Market size and forecast 2024-2029 ($ million)
Chart on UAE - Year-over-year growth 2024-2029 (%)
Data Table on UAE - Year-over-year growth 2024-2029 (%)

12.6.2 Brazil - Market size and forecast 2024-2029

Chart on Brazil - Market size and forecast 2024-2029 ($ million)
Data Table on Brazil - Market size and forecast 2024-2029 ($ million)
Chart on Brazil - Year-over-year growth 2024-2029 (%)
Data Table on Brazil - Year-over-year growth 2024-2029 (%)

12.6.3 South Africa - Market size and forecast 2024-2029

Chart on South Africa - Market size and forecast 2024-2029 ($ million)
Data Table on South Africa - Market size and forecast 2024-2029 ($ million)
Chart on South Africa - Year-over-year growth 2024-2029 (%)
Data Table on South Africa - Year-over-year growth 2024-2029 (%)

12.6.4 Saudi Arabia - Market size and forecast 2024-2029

Chart on Saudi Arabia - Market size and forecast 2024-2029 ($ million)
Data Table on Saudi Arabia - Market size and forecast 2024-2029 ($ million)
Chart on Saudi Arabia - Year-over-year growth 2024-2029 (%)
Data Table on Saudi Arabia - Year-over-year growth 2024-2029 (%)

12.6.5 Turkey - Market size and forecast 2024-2029

Chart on Turkey - Market size and forecast 2024-2029 ($ million)
Data Table on Turkey - Market size and forecast 2024-2029 ($ million)
Chart on Turkey - Year-over-year growth 2024-2029 (%)
Data Table on Turkey - Year-over-year growth 2024-2029 (%)

12.7 Market opportunity by geography

Market opportunity by geography ($ million)
Data Tables on Market opportunity by geography ($ million)

13. Drivers, Challenges, and Opportunity

13.1 Market drivers

Heightened emphasis on medication error reduction and patient safety
Persistent staffing shortages and the need for operational efficiency
Accelerating technological advancements and integration of AI

13.2 Market challenges

High initial capital investment and uncertain return on investment
Integration and interoperability with existing health information systems
Evolving regulatory landscape and cybersecurity concerns

13.3 Impact of drivers and challenges

Impact of drivers and challenges in 2024 and 2029

13.4 Market opportunities

Integration of artificial intelligence and machine learning
Expansion of telepharmacy and remote dispensing
Advancements in robotics and automated dispensing systems

14. Competitive Landscape

14.1 Overview

14.2

Overview on criticality of inputs and factors of differentiation

14.3 Landscape disruption

Overview on factors of disruption

14.4 Industry risks

Impact of key risks on business

15. Competitive Analysis

15.1 Companies profiled

Companies covered

15.2 Company ranking index

15.3 Market positioning of companies

Matrix on companies position and classification

15.4 Accu Chart Plus Healthcare Systems Inc.

Accu Chart Plus Healthcare Systems Inc. - Overview
Accu Chart Plus Healthcare Systems Inc. - Product / Service
Accu Chart Plus Healthcare Systems Inc. - Key offerings
SWOT

15.5 AmerisourceBergen Corp.

AmerisourceBergen Corp. - Overview
AmerisourceBergen Corp. - Business segments
AmerisourceBergen Corp. - Key news
AmerisourceBergen Corp. - Key offerings
AmerisourceBergen Corp. - Segment focus
SWOT

15.6 ARxIUM Inc.

ARxIUM Inc. - Overview
ARxIUM Inc. - Product / Service
ARxIUM Inc. - Key offerings
SWOT

15.7 Baxter International Inc.

Baxter International Inc. - Overview
Baxter International Inc. - Business segments
Baxter International Inc. - Key news
Baxter International Inc. - Key offerings
Baxter International Inc. - Segment focus
SWOT

15.8 Becton Dickinson and Co.

Becton Dickinson and Co. - Overview
Becton Dickinson and Co. - Business segments
Becton Dickinson and Co. - Key news
Becton Dickinson and Co. - Key offerings
Becton Dickinson and Co. - Segment focus
SWOT

15.9 Capsa Healthcare LLC

Capsa Healthcare LLC - Overview
Capsa Healthcare LLC - Product / Service
Capsa Healthcare LLC - Key offerings
SWOT

15.10 MIDEA Group Co. Ltd.

MIDEA Group Co. Ltd. - Overview
MIDEA Group Co. Ltd. - Product / Service
MIDEA Group Co. Ltd. - Key news
MIDEA Group Co. Ltd. - Key offerings
SWOT

15.11 Omnicell Inc.

Omnicell Inc. - Overview
Omnicell Inc. - Product / Service
Omnicell Inc. - Key offerings
SWOT

15.12 Optel Group

Optel Group - Overview
Optel Group - Product / Service
Optel Group - Key offerings
SWOT

15.13 Oracle Corp.

Oracle Corp. - Overview
Oracle Corp. - Business segments
Oracle Corp. - Key news
Oracle Corp. - Key offerings
Oracle Corp. - Segment focus
SWOT

15.14 Pearson Medical Technologies LLC

Pearson Medical Technologies LLC - Overview
Pearson Medical Technologies LLC - Product / Service
Pearson Medical Technologies LLC - Key offerings
SWOT

15.15 Rxsafe LLC

Rxsafe LLC - Overview
Rxsafe LLC - Product / Service
Rxsafe LLC - Key offerings
SWOT

15.16 ScriptPro LLC

ScriptPro LLC - Overview
ScriptPro LLC - Product / Service
ScriptPro LLC - Key offerings
SWOT

15.17 Swisslog Healthcare AG

Swisslog Healthcare AG - Overview
Swisslog Healthcare AG - Product / Service
Swisslog Healthcare AG - Key offerings
SWOT

15.18 Yuyama USA Inc.

Yuyama USA Inc. - Overview
Yuyama USA Inc. - Product / Service
Yuyama USA Inc. - Key offerings
SWOT

16. Appendix

16.1 Scope of the report

Market definition
Objectives
Notes and caveats

16.2 Inclusions and exclusions checklist

Inclusions checklist
Exclusions checklist

16.3 Currency conversion rates for US$

16.4 Research methodology

16.5 Data procurement

Information sources

16.6 Data validation

16.7 Validation techniques employed for market sizing

16.8 Data synthesis

16.9 360 degree market analysis

16.10 List of abbreviations

Research Methodology

Technavio presents a detailed picture of the market by way of study, synthesis, and summation of data from multiple sources. The analysts have presented the various facets of the market with a particular focus on identifying the key industry influencers. The data thus presented is comprehensive, reliable, and the result of extensive research, both primary and secondary.

INFORMATION SOURCES

Primary sources

  • Manufacturers and suppliers
  • Channel partners
  • Industry experts
  • Strategic decision makers

Secondary sources

  • Industry journals and periodicals
  • Government data
  • Financial reports of key industry players
  • Historical data
  • Press releases

DATA ANALYSIS

Data Synthesis

  • Collation of data
  • Estimation of key figures
  • Analysis of derived insights

Data Validation

  • Triangulation with data models
  • Reference against proprietary databases
  • Corroboration with industry experts

REPORT WRITING

Qualitative

  • Market drivers
  • Market challenges
  • Market trends
  • Five forces analysis

Quantitative

  • Market size and forecast
  • Market segmentation
  • Geographical insights
  • Competitive landscape

Interested in this report?

Get your sample now to see our research methodology and insights!

Download Now

Frequently Asked Questions

Pharmacy Automation Systems market growth will increase by USD 3492.3 million during 2025-2029 .

The Pharmacy Automation Systems market is expected to grow at a CAGR of 9.2% during 2025-2029 .

Pharmacy Automation Systems market is segmented by Product type (Automated medication dispensing system, Automated storage and retrieval system, Automated packaging and labeling system, Others) End-user (Retail pharmacy, Hospital pharmacy, Others) Type (Semi automatic systems, Fully automatic systems)

Accu Chart Plus Healthcare Systems Inc., AmerisourceBergen Corp., ARxIUM Inc., Baxter International Inc., Becton Dickinson and Co., Capsa Healthcare LLC, McKesson Corp., MIDEA Group Co. Ltd., Omnicell Inc., Optel Group, Oracle Corp., Pearson Medical Technologies LLC, Rxsafe LLC, Scientific Industries Inc., ScriptPro LLC, Swisslog Healthcare AG, Yuyama USA Inc. are a few of the key vendors in the Pharmacy Automation Systems market.

North America will register the highest growth rate of 37.5% among the other regions. Therefore, the Pharmacy Automation Systems market in North America is expected to garner significant business opportunities for the vendors during the forecast period.

US, Canada, Mexico, Germany, UK, France, Italy, The Netherlands, Spain, Russia, China, Japan, India, South Korea, Australia, Indonesia, Thailand, Singapore, UAE, Brazil, South Africa, Saudi Arabia, Turkey

  • Heightened emphasis on medication error reduction and patient safety is the driving factor this market.

The Pharmacy Automation Systems market vendors should focus on grabbing business opportunities from the Product type segment as it accounted for the largest market share in the base year.