Robotic Pharmacy Prescription Dispensing Systems Market Size 2024-2028
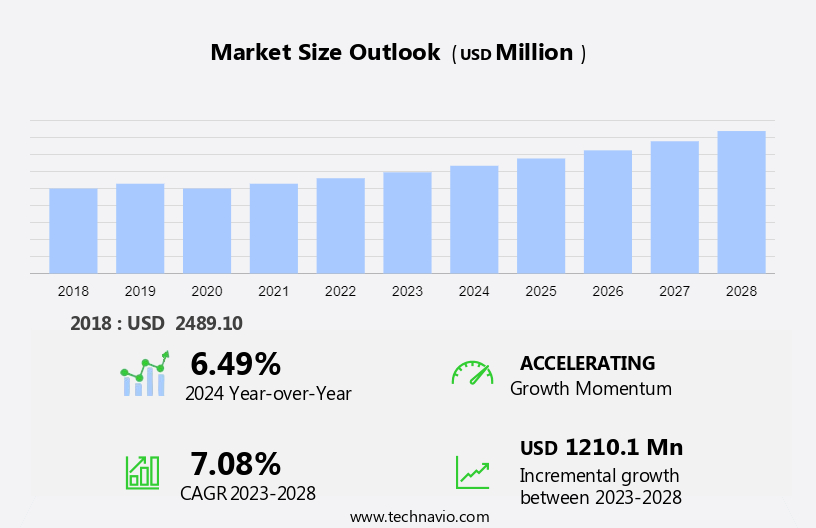
The robotic pharmacy prescription dispensing systems market size is forecast to increase by USD 1.21 billion, at a CAGR of 7.08% between 2023 and 2028.
- The market is driven by the increasing need for reductions in medication errors and improvement in customer support services. The integration of advanced robotics in pharmacy operations aims to minimize human intervention, thereby reducing the likelihood of errors in prescription dispensing. Furthermore, these systems enable efficient and accurate order fulfillment, ensuring timely delivery of medications to patients. However, budget constraints pose a significant challenge for small-scale pharmacies, limiting their adoption of these systems. The high initial investment and ongoing maintenance costs make it challenging for these entities to justify the investment.
- Additionally, the implementation of these systems requires extensive training and resources, further adding to the financial burden. Despite these challenges, the potential benefits, such as increased productivity, improved accuracy, and enhanced customer satisfaction, make it an attractive proposition for pharmacies seeking to optimize their operations and deliver superior patient care.
What will be the Size of the Robotic Pharmacy Prescription Dispensing Systems Market during the forecast period?
Explore in-depth regional segment analysis with market size data - historical 2018-2022 and forecasts 2024-2028 - in the full report.
Request Free Sample
The market continues to evolve, driven by advancements in technology and the growing demand for efficient, accurate, and safe medication management solutions. Integral components of these systems include error reduction systems, data analytics, order fulfillment systems, medication adherence, cloud computing, prescription tracking, drug dispensing carousels, automated pill counting, pharmaceutical logistics, inventory control, hospital pharmacies, prescription dispensing units, medication management systems, and training programs. Seamlessly integrated into these systems, error reduction systems employ advanced algorithms to minimize medication errors, while data analytics provide valuable insights for improving patient care and operational efficiency. Order fulfillment systems streamline the process of preparing and dispensing prescriptions, ensuring timely and accurate delivery to patients.
Medication adherence solutions help patients stick to their treatment plans, enhancing patient outcomes and reducing healthcare costs. Cloud computing enables secure, remote access to critical data, facilitating real-time collaboration and decision-making. Prescription tracking systems offer real-time visibility into the status of prescriptions, improving patient safety and regulatory compliance. Drug dispensing carousels and automated pill counting machines streamline the dispensing process, reducing the risk of errors and improving workflow efficiency. Pharmaceutical logistics and inventory control solutions optimize the supply chain, ensuring the timely delivery of medications and maintaining an adequate stock of essential drugs. In hospital pharmacies, prescription dispensing units and medication management systems enable efficient medication administration and improve patient safety.
Training programs equip pharmacy staff with the necessary skills to effectively utilize these advanced systems. Security systems, centralized dispensing systems, reporting tools, safety features, and human-machine interaction designs prioritize patient safety and data security. Health systems, regulatory compliance, and compliance management solutions ensure that these advanced systems meet the highest standards for patient care and data protection. Robotic pharmacy automation, medication reconciliation, pharmaceutical packaging, capsule filling machines, RFID tracking, prescription labels, drug handling, liquid filling machines, and integration services further enhance the capabilities of these systems. Point-of-care dispensing, reporting tools, and labeling systems enable healthcare providers to deliver medications directly to patients, improving patient outcomes and reducing the workload on pharmacy staff.
Pharmacy automation software, inventory management software, and barcode scanning technologies streamline pharmacy workflows, optimizing operations and reducing costs. Automated dispensing cabinets and retail pharmacies leverage these advanced technologies to offer patients convenient, accurate, and efficient prescription dispensing services. As the market continues to unfold, the integration of these advanced technologies into comprehensive pharmacy automation solutions will further enhance medication management, improve patient safety, and optimize operational efficiency.
How is this Robotic Pharmacy Prescription Dispensing Systems Industry segmented?
The robotic pharmacy prescription dispensing systems industry research report provides comprehensive data (region-wise segment analysis), with forecasts and estimates in "USD million" for the period 2024-2028, as well as historical data from 2018-2022 for the following segments.
- End-user
- Hospital pharmacies
- Retail pharmacies
- Geography
- North America
- US
- Europe
- Germany
- UK
- APAC
- China
- Japan
- Rest of World (ROW)
- North America
By End-user Insights
The hospital pharmacies segment is estimated to witness significant growth during the forecast period.
The market is experiencing significant growth, particularly in the hospital pharmacies segment. Regulatory authorities, healthcare professionals, and end-users are prioritizing accuracy, safety, and efficiency in pharmacy operations. This trend is driven by the increasing concern over medication errors and patient safety. Robotic systems offer solutions, reducing waiting times and improving financial performance by handling a larger volume of prescriptions than manual methods. Pharmacy workflow requirements and staffing definitions are evolving, leading to increased investment in automation solutions. Data analytics, order fulfillment systems, medication adherence, cloud computing, prescription tracking, and inventory control are integral components of these systems.
Centralized dispensing systems, medication safety, point-of-care dispensing, reporting tools, and safety features further enhance their functionality. Health systems, regulatory compliance, and patient safety are key considerations. Training programs, security systems, and compliance management ensure smooth implementation. Robotic pharmacy automation includes medication reconciliation, pharmaceutical packaging, and various filling machines. RFID tracking, prescription labels, drug handling, and liquid filling machines contribute to data security and accuracy. Human-machine interaction, patient safety, integration services, error prevention, and long-term care facilities are essential aspects of these systems. Outpatient pharmacies, retail pharmacies, and pharmacy automation software are also adopting these technologies.
Labeling systems, packaging automation, robotics integration, and barcode scanning streamline processes. Inventory management software ensures optimal stock levels and efficient supply chain management. As healthcare providers and pharmacies continue to prioritize patient safety and operational efficiency, the market for robotic pharmacy prescription dispensing systems is poised for continued growth.
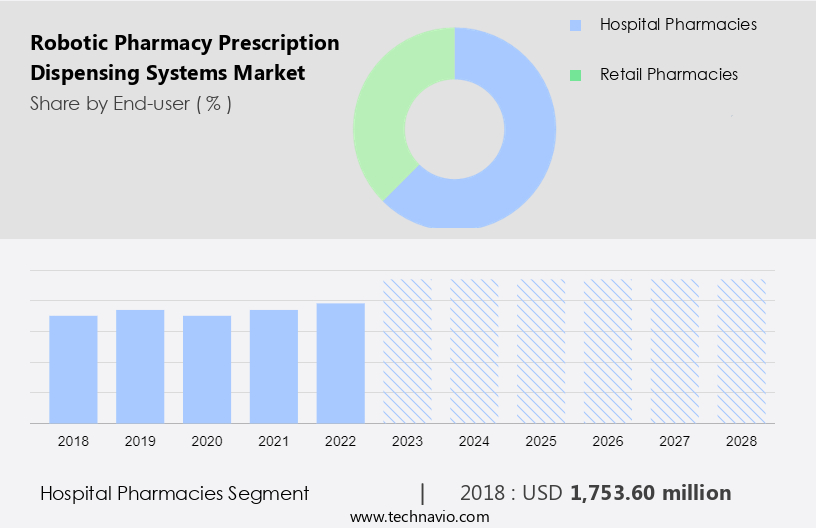
The Hospital pharmacies segment was valued at USD 1.75 billion in 2018 and showed a gradual increase during the forecast period.
Regional Analysis
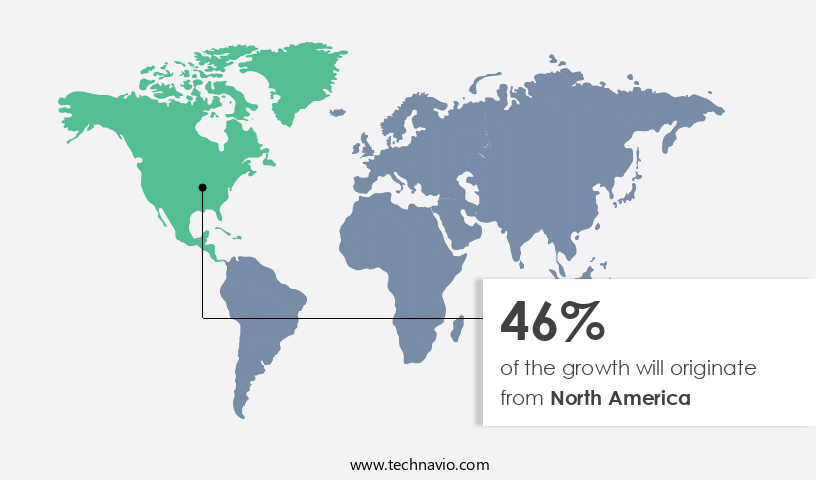
North America is estimated to contribute 46% to the growth of the global market during the forecast period.Technavio’s analysts have elaborately explained the regional trends and drivers that shape the market during the forecast period.
In the evolving healthcare landscape, robotic pharmacy prescription dispensing systems are gaining significant traction. These systems, which include medication management systems, automated pill counting, drug dispensing carousels, and prescription tracking, among others, are increasingly being adopted by pharmacies to enhance medication safety and streamline operations. In the US, where medication errors continue to pose a significant challenge, the implementation of such systems is seen as a crucial step towards improving patient safety and reducing operational costs. Hospitals, in particular, are leading the charge in this regard, as they seek to reduce manual processes and incorporate more technology-based solutions. The US government's push towards a paperless healthcare system, with the widespread adoption of electronic medical records (EMRs) and e-prescriptions, is also driving demand for these systems.
Cloud computing and data analytics are key components of these systems, enabling real-time inventory control, prescription tracking, and medication adherence. Centralized dispensing systems, medication safety features, and reporting tools are other essential elements that contribute to the overall effectiveness of these systems. Pharmaceutical logistics and supply chain management are also areas where robotic pharmacy prescription dispensing systems are making a significant impact. With the help of RFID tracking, prescription labels, and inventory management software, these systems enable efficient drug handling and ensure regulatory compliance. Training programs, security systems, and user interface design are crucial aspects of these systems, ensuring seamless integration into existing pharmacy workflows.
Pharmacy technicians and healthcare providers are also benefiting from these systems, as they enable error prevention and pharmacy automation software, labeling systems, and packaging automation. Robotic pharmacy prescription dispensing systems are also making their way into long-term care facilities, outpatient pharmacies, and retail pharmacies, further expanding their reach and impact. With the ongoing advancements in robotics integration, barcode scanning, and human-machine interaction, the future of pharmacy automation looks promising.
Market Dynamics
Our researchers analyzed the data with 2023 as the base year, along with the key drivers, trends, and challenges. A holistic analysis of drivers will help companies refine their marketing strategies to gain a competitive advantage.
What are the key market drivers leading to the rise in the adoption of Robotic Pharmacy Prescription Dispensing Systems Industry?
- The significant demand for reducing medication errors serves as the primary market driver.
- Pharmacy prescription dispensing systems have gained significant importance in the healthcare industry due to the increasing need for error reduction and workflow optimization. The deficit in quality staff in pharmacies has led to an increased adoption of automation systems. These systems include automated dispensing cabinets, pharmacy automation software, labeling systems, packaging automation, and robotics integration. These technologies facilitate barcode scanning, inventory management, and improve overall pharmacy operations. Medication errors can result in substantial costs to the US economy, with approximately 7,000 deaths reported annually according to the Institute of Medicine. To mitigate these risks, healthcare providers are turning to advanced pharmacy automation solutions.
- These systems not only reduce dispensing errors but also optimize space utilization and enable the delivery of more patient-centric services. Moreover, service contracts for these systems provide added benefits such as maintenance, training, and support, ensuring the smooth functioning of pharmacy operations. In conclusion, the adoption of pharmacy automation systems is a critical investment for retail pharmacies to enhance operational efficiency, improve patient safety, and reduce costs associated with medication errors. These systems offer a harmonious blend of technology and human expertise, enabling pharmacy technicians to focus on more complex tasks while the automation handles routine dispensing processes.
What are the market trends shaping the Robotic Pharmacy Prescription Dispensing Systems Industry?
- Customer support services are undergoing significant enhancement, reflecting the current market trend. This improvement aims to deliver more efficient and effective interactions between businesses and their clients.
- Robotic pharmacy prescription dispensing systems have gained significant traction in the healthcare industry due to their ability to reduce errors, enhance medication adherence, and streamline order fulfillment processes. companies offering these systems provide end-users with maintenance and post-purchase services to ensure system efficiency and competitiveness in the market. These services include 24/7 operational guidance and technical support, software and drug database updates, and customized solutions. Manufacturers engage with end-users through workshops and meetings to promote automation systems, gather feedback, and provide tailored offerings.
- Strategic partnerships, such as McKesson's collaboration with Health Mart, are also crucial in expanding market reach and increasing market share. Data analytics and cloud computing technologies integrated into these systems enable advanced prescription tracking and inventory control, further enhancing their value proposition.
What challenges does the Robotic Pharmacy Prescription Dispensing Systems Industry face during its growth?
- Small-scale pharmacies face significant growth challenges due to stringent budget constraints within the industry.
- Robotic pharmacy prescription dispensing systems have gained significant attention in the healthcare industry due to their ability to enhance medication safety and improve operational efficiency. Centralized dispensing systems, which utilize robotic automation, offer advanced security features and reporting tools that help ensure regulatory compliance and reduce medication errors. These systems can be integrated with medication reconciliation processes, pharmaceutical packaging, and capsule filling machines to streamline workflows. However, the high cost of these systems, with an approximate price of USD200,000, makes them a significant investment, particularly for small pharmacies.
- The additional expenses for servicing, consulting services, and system modifications can add to the overall expenditure. Pharmacies considering these systems must weigh the benefits against the costs and ensure a harmonious integration into their existing pharmacy automation infrastructure.
Exclusive Customer Landscape
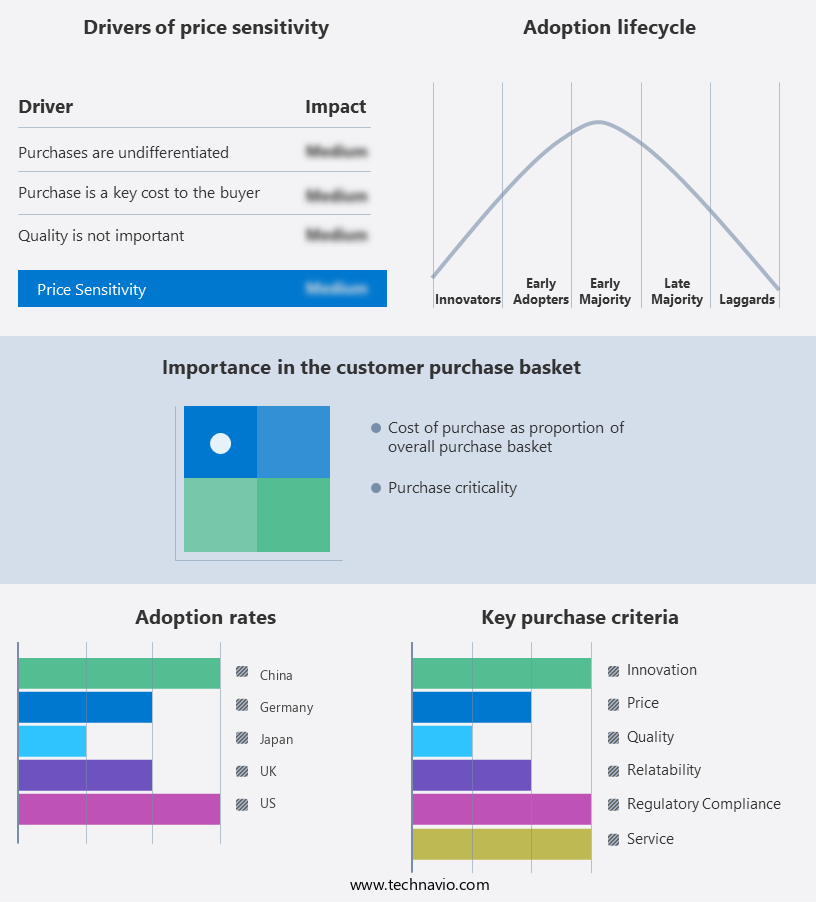
The robotic pharmacy prescription dispensing systems market forecasting report includes the adoption lifecycle of the market, covering from the innovator’s stage to the laggard’s stage. It focuses on adoption rates in different regions based on penetration. Furthermore, the robotic pharmacy prescription dispensing systems market report also includes key purchase criteria and drivers of price sensitivity to help companies evaluate and develop their market growth analysis strategies.
Customer Landscape
Key Companies & Market Insights
Companies are implementing various strategies, such as strategic alliances, robotic pharmacy prescription dispensing systems market forecast, partnerships, mergers and acquisitions, geographical expansion, and product/service launches, to enhance their presence in the industry.
Abacus Rx Inc. - This company specializes in advanced robotic pharmacy systems, integrating automated IV compounding, barcode validation, oral solid filling, manual filling, packing, inventory control, order control, reporting, inventory management, and automated dispensing cabinets, streamlining pharmacy operations and enhancing medication accuracy.
The industry research and growth report includes detailed analyses of the competitive landscape of the market and information about key companies, including:
- Abacus Rx Inc.
- Accu Chart Plus Health Care Systems
- ARxIUM Inc.
- Becton Dickinson and Co.
- Capsa Healthcare LLC
- Centred Solutions
- Clover 51 Ltd.
- Euclid Medical Products
- Gebr. Willach GmbH
- JVM Co. Ltd.
- KUKA AG
- Lamson Concepts Pty. Ltd.
- Manchac Technologies
- Medication Management Robotics
- NewIcon Oy
- Omnicell Inc.
- Oracle Corp.
- Parata Systems LLC
- QxRobotics
- ScriptPro LLC
Qualitative and quantitative analysis of companies has been conducted to help clients understand the wider business environment as well as the strengths and weaknesses of key industry players. Data is qualitatively analyzed to categorize companies as pure play, category-focused, industry-focused, and diversified; it is quantitatively analyzed to categorize companies as dominant, leading, strong, tentative, and weak.
Recent Development and News in Robotic Pharmacy Prescription Dispensing Systems Market
- In January 2024, Omnicell, a leading provider of medication management solutions, announced the FDA clearance and commercial launch of its new Generation V Medication Adherence Workstation, featuring advanced robotic prescription dispensing capabilities (Omnicell Press Release). This system significantly enhances medication error reduction and efficiency in pharmacy operations.
- In March 2024, 3A Logistics and Swisslog, two prominent automation solution providers, entered into a strategic partnership to integrate Swisslog's robotic systems with 3A Logistics' pharmacy automation solutions, expanding their combined offerings in the robotic pharmacy market (3A Logistics Press Release).
- In April 2025, Medline Industries, a global manufacturer and distributor of medical supplies, completed the acquisition of RxSafe, a leading provider of automated medication storage and dispensing systems, further expanding its portfolio of pharmacy automation solutions (Medline Industries Press Release).
- In May 2025, the FDA granted marketing authorization to BD (Becton, Dickinson and Company) for its new automated medication dispensing system, the Pyxis ES MedStation, featuring advanced robotics and AI capabilities, aiming to improve medication safety and efficiency in hospital pharmacies (BD Press Release).
Research Analyst Overview
- The robotic pharmacy prescription dispensing market is experiencing significant advancements, driven by the integration of IoT technology and cloud-based solutions. These systems offer API integrations, enabling seamless data exchange with electronic health records and other healthcare IT systems. Smart pharmacy solutions employ modular designs for customizable, scalable installations, while AI and machine learning facilitate predictive analytics and inventory optimization. Real-time tracking and remote monitoring ensure accurate, efficient dispensing, reducing waste and improving patient safety. Preventive maintenance and system integration enable seamless operation, while big data analytics and data visualization provide valuable insights for life cycle management.
- Mobile dispensing systems and remote diagnostics further enhance accessibility and convenience. Automated replenishment and high-throughput dispensing increase productivity, while computer vision and deep learning technologies improve accuracy and precision. Audit trails ensure regulatory compliance and maintain transparency, making these systems essential for modern pharmacy operations.
Dive into Technavio’s robust research methodology, blending expert interviews, extensive data synthesis, and validated models for unparalleled Robotic Pharmacy Prescription Dispensing Systems Market insights. See full methodology.
|
Market Scope |
|
|
Report Coverage |
Details |
|
Page number |
141 |
|
Base year |
2023 |
|
Historic period |
2018-2022 |
|
Forecast period |
2024-2028 |
|
Growth momentum & CAGR |
Accelerate at a CAGR of 7.08% |
|
Market growth 2024-2028 |
USD 1210.1 million |
|
Market structure |
Fragmented |
|
YoY growth 2023-2024(%) |
6.49 |
|
Key countries |
US, UK, Japan, China, and Germany |
|
Competitive landscape |
Leading Companies, Market Positioning of Companies, Competitive Strategies, and Industry Risks |
What are the Key Data Covered in this Robotic Pharmacy Prescription Dispensing Systems Market Research and Growth Report?
- CAGR of the Robotic Pharmacy Prescription Dispensing Systems industry during the forecast period
- Detailed information on factors that will drive the growth and forecasting between 2024 and 2028
- Precise estimation of the size of the market and its contribution of the industry in focus to the parent market
- Accurate predictions about upcoming growth and trends and changes in consumer behaviour
- Growth of the market across North America, Europe, APAC, Middle East and Africa, and South America
- Thorough analysis of the market’s competitive landscape and detailed information about companies
- Comprehensive analysis of factors that will challenge the robotic pharmacy prescription dispensing systems market growth of industry companies
We can help! Our analysts can customize this robotic pharmacy prescription dispensing systems market research report to meet your requirements.
 RIA -
RIA - 
