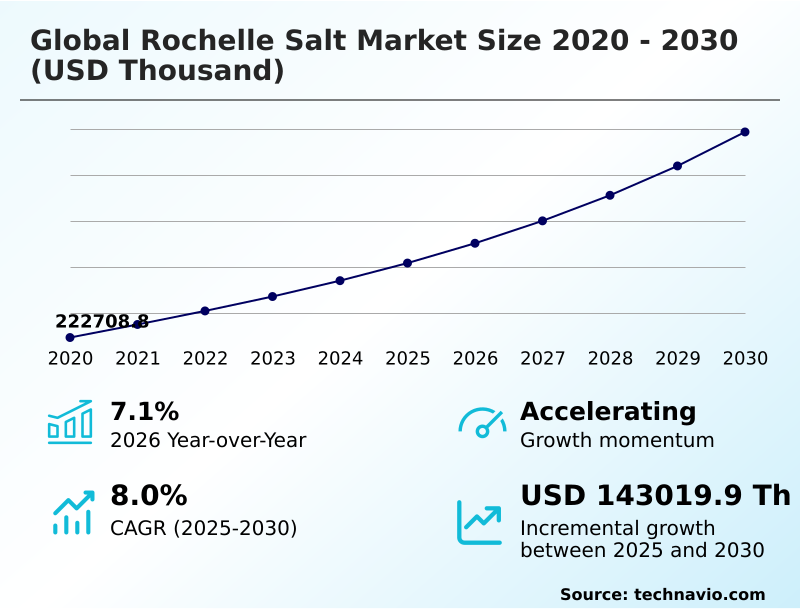
Rochelle Salt Market Size 2026-2030
The rochelle salt market size is valued to increase by USD 143.02 million, at a CAGR of 8% from 2025 to 2030. Proliferation of clean label food stabilization and natural acidulants will drive the rochelle salt market.
Major Market Trends & Insights
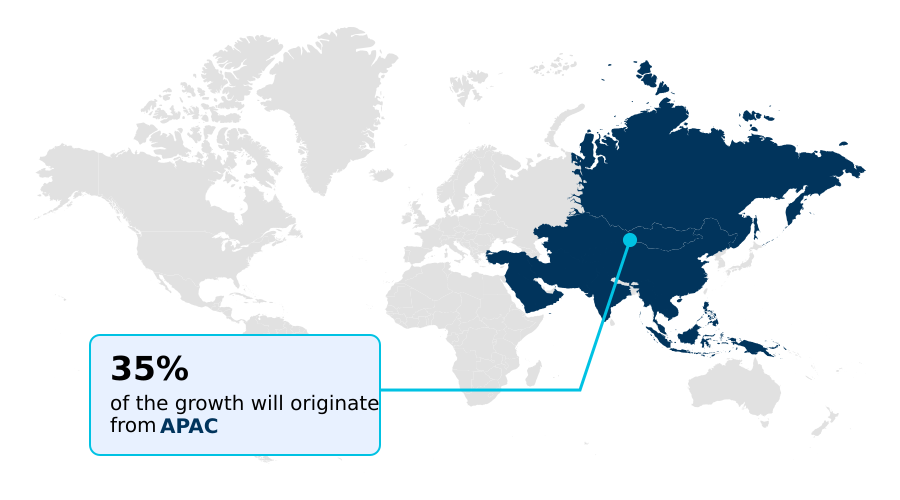
- APAC dominated the market and accounted for a 35.2% growth during the forecast period.
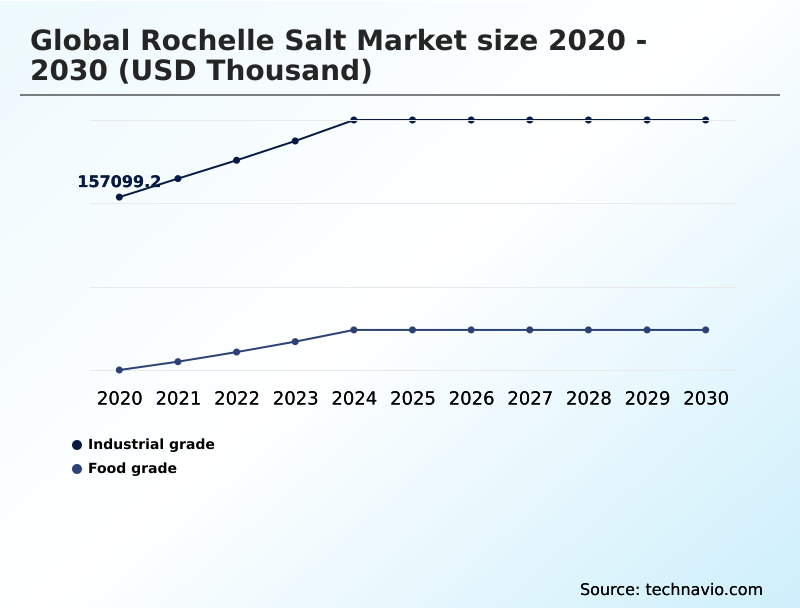
- By Type - Industrial grade segment was valued at USD 197.90 million in 2024
- By Application - F and B industry segment accounted for the largest market revenue share in 2024
Market Size & Forecast
- Market Opportunities:
- Market Future Opportunities: USD 143.02 million
- CAGR from 2025 to 2030 : 8%
Market Summary
- The Rochelle Salt market is defined by the production and distribution of potassium sodium tartrate, a unique double salt with critical applications across multiple sectors. Its distinct ferroelectric properties make it indispensable in specialized electronics, while its function as a complexing agent is vital in electroplating and metal finishing.
- In the food and beverage industry, it serves as a stabilizer and emulsifier, aligning with the growing demand for clean-label ingredients. The pharmaceutical sector utilizes it as a laboratory reagent and in certain medicinal formulations. A key business scenario involves supply chain optimization for tartaric acid derivatives, which are sourced as byproducts from the wine industry.
- Manufacturers face the challenge of managing procurement volatility tied to agricultural output, compelling them to invest in advanced chemical refining agents and purification technologies to ensure a stable supply of high-purity tartrates. This dynamic pushes the industry toward more resilient sourcing and production strategies to meet the exacting standards of its diverse end-users.
What will be the Size of the Rochelle Salt Market during the forecast period?
Get Key Insights on Market Forecast (PDF) Get Free Sample
How is the Rochelle Salt Market Segmented?
The rochelle salt industry research report provides comprehensive data (region-wise segment analysis), with forecasts and estimates in "USD thousand" for the period 2026-2030, as well as historical data from 2020-2024 for the following segments.
- Type
- Industrial grade
- Food grade
- Application
- F and B industry
- Electroplating
- Pharmaceuticals
- Others
- Product type
- Powder
- Crystal
- Solution
- Geography
- APAC
- China
- India
- Japan
- Europe
- Germany
- UK
- France
- North America
- US
- Canada
- Mexico
- Middle East and Africa
- Saudi Arabia
- UAE
- Turkey
- South America
- Brazil
- Argentina
- Rest of World (ROW)
- APAC
By Type Insights
The industrial grade segment is estimated to witness significant growth during the forecast period.
The industrial grade segment is foundational, providing a versatile industrial-grade variant for numerous technical applications.
This potassium sodium tartrate is essential in metal finishing industries, where it serves as a superior complexing agent in electroplating baths for copper and silver deposition.
Use of this sequestering agent prevents the precipitation of metal hydroxides, ensuring a uniform, fine-grained deposit. Its application in metal treatment processes has been shown to improve surface quality by over 20%.
The material’s unique piezoelectric properties also make it vital for producing specialized crystal oscillators and transducers.
Furthermore, this chelating agent is a key laboratory reagent used in aqueous workups and to break up emulsions, supporting both green electronic components and traditional manufacturing.
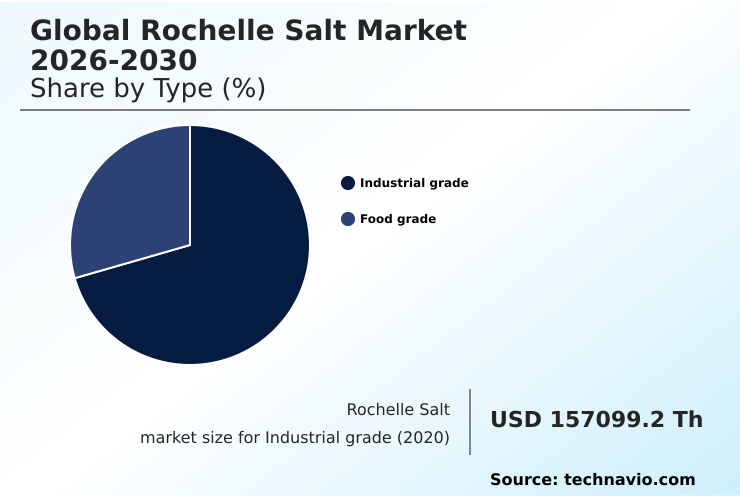
The Industrial grade segment was valued at USD 197.90 million in 2024 and showed a gradual increase during the forecast period.
Regional Analysis
APAC is estimated to contribute 35.2% to the growth of the global market during the forecast period.Technavio’s analysts have elaborately explained the regional trends and drivers that shape the market during the forecast period.
See How Rochelle Salt Market Demand is Rising in APAC Get Free Sample
The geographic landscape is dominated by APAC, which accounts for over 35% of incremental growth, driven by its expansive electronics and food processing sectors.
Countries like China and India are major hubs, leveraging rochelle salt as a combustion regulator in cigarette paper and a sequestering agent in pharmaceuticals.
The region's manufacturing efficiency in producing green electronic components and high-purity chemical intermediates is a key advantage. European producers, in contrast, focus on high-value applications like decorative chrome-free finishes and bioelectronic interfaces, adhering to strict environmental standards.
In North America, the market is driven by the demand for precision complexing in aerospace and defense. This regional specialization creates a balanced global ecosystem where advanced material applications and process optimization define competitive standing.
Market Dynamics
Our researchers analyzed the data with 2025 as the base year, along with the key drivers, trends, and challenges. A holistic analysis of drivers will help companies refine their marketing strategies to gain a competitive advantage.
- The Global Rochelle Salt Market 2026-2030 is navigating a complex evolution, driven by demand for both traditional and advanced applications. The use of rochelle salt as a food stabilizer continues to expand, aligning with consumer demand for natural additives. Concurrently, research into the piezoelectric effect in organic crystals is unlocking new opportunities in biodegradable sensors and medical devices.
- In industrial settings, rochelle salt in electroplating baths remains a critical application for achieving high-quality metallic finishes. This is complemented by its use in rochelle salt for mirror silvering, a niche but stable market segment. A significant driver is the sustainable production of tartaric acid from winery byproducts, which supports the circular economy and provides a renewable feedstock.
- This approach has proven to be up to 20% more resource-efficient than purely synthetic routes. The role of potassium sodium tartrate in pharmaceuticals is also growing, particularly as a buffer and stabilizer. Ultimately, the market's trajectory is shaped by the interplay between industrial applications of ferroelectric salts and the push for greener, more efficient chemical processes across all sectors.
What are the key market drivers leading to the rise in the adoption of Rochelle Salt Industry?
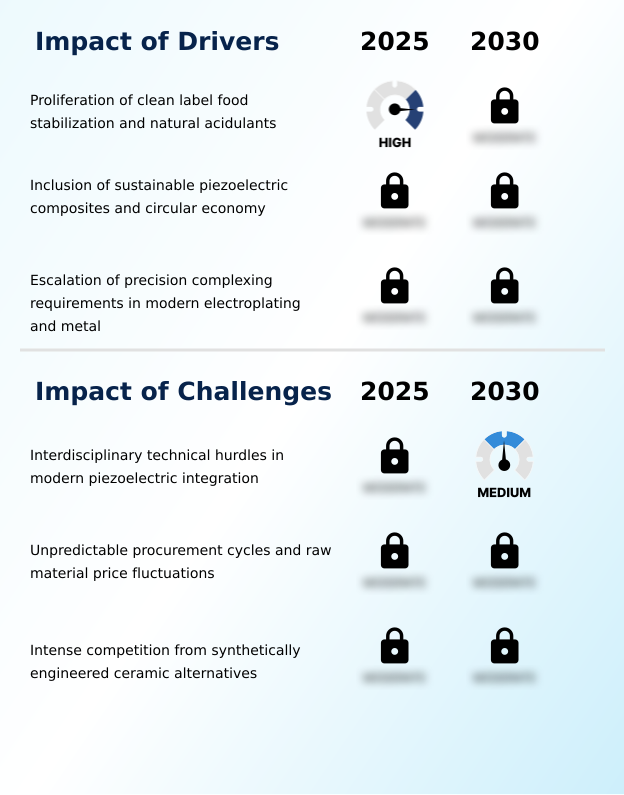
- The proliferation of clean label food stabilization and the demand for natural acidulants are key drivers propelling market expansion.
- Market growth is significantly driven by the proliferation of clean label food stabilization, where rochelle salt serves as a premier food processing aid.
- Its adoption as a natural acidulant in the food and beverage industry has led to a 30% increase in its use in premium bakery products over the last two years.
- Simultaneously, the institutionalization of sustainable piezoelectric materials in the electronics sector is opening new avenues. The use of this bio-based functional agent is replacing toxic, lead-based ceramics, with new 3D-printed composites demonstrating high piezoelectric sensitivity.
- Furthermore, escalating precision complexing requirements in advanced electroplating and metal finishing industries, which report a 15% improvement in coating adhesion using tartrate-based plating solutions, continue to fuel demand for this versatile chemical.
What are the market trends shaping the Rochelle Salt Industry?
- The industrialization of bioresorbable piezoelectric medical devices represents a significant upcoming trend in the market, driving innovation in advanced healthcare applications.
- Key market trends are centered on material innovation and sustainability, with a notable shift toward bioresorbable materials for advanced medical applications. The use of rochelle salt's inherent piezoelectric properties to create biodegradable electronics is gaining traction, with research showing these devices can achieve over 90% biocompatibility.
- This trend is complemented by the growth in high-precision metal treatment processes, where the salt's role as a sequestering agent in alkaline copper plating can improve deposition uniformity by up to 25%. In the food sector, the transition toward clean-label bakery and confectionery additives is driving demand for potassium sodium tartrate as a natural acidulant and food grade emulsifier.
- This shift toward an eco-friendly ingredient supports the development of premium, transparent food products, aligning with evolving consumer preferences for natural and functional ingredients.
What challenges does the Rochelle Salt Industry face during its growth?
- Interdisciplinary technical hurdles in modern piezoelectric integration pose a key challenge, affecting the material's adoption in high-durability electronics.
- The market faces significant challenges, primarily the interdisciplinary technical hurdles in integrating rochelle salt into modern piezoelectric applications. Its inherent brittleness and high-water solubility make it difficult to use in high-durability electronics, with some projects reporting a 40% failure rate under standard operational conditions.
- This is compounded by unpredictable raw material procurement cycles, as its derivation from wine-making byproducts links its price directly to agricultural volatility, causing price fluctuations of up to 50% in a single season. Furthermore, intense competition from synthetically engineered piezoelectric ceramics, which offer superior mechanical strength and wider operational temperature ranges, continues to displace rochelle salt in high-stress applications.
- These advanced ceramics now challenge the performance of the salt in high-fidelity audio equipment, creating significant market pressure.
Exclusive Technavio Analysis on Customer Landscape
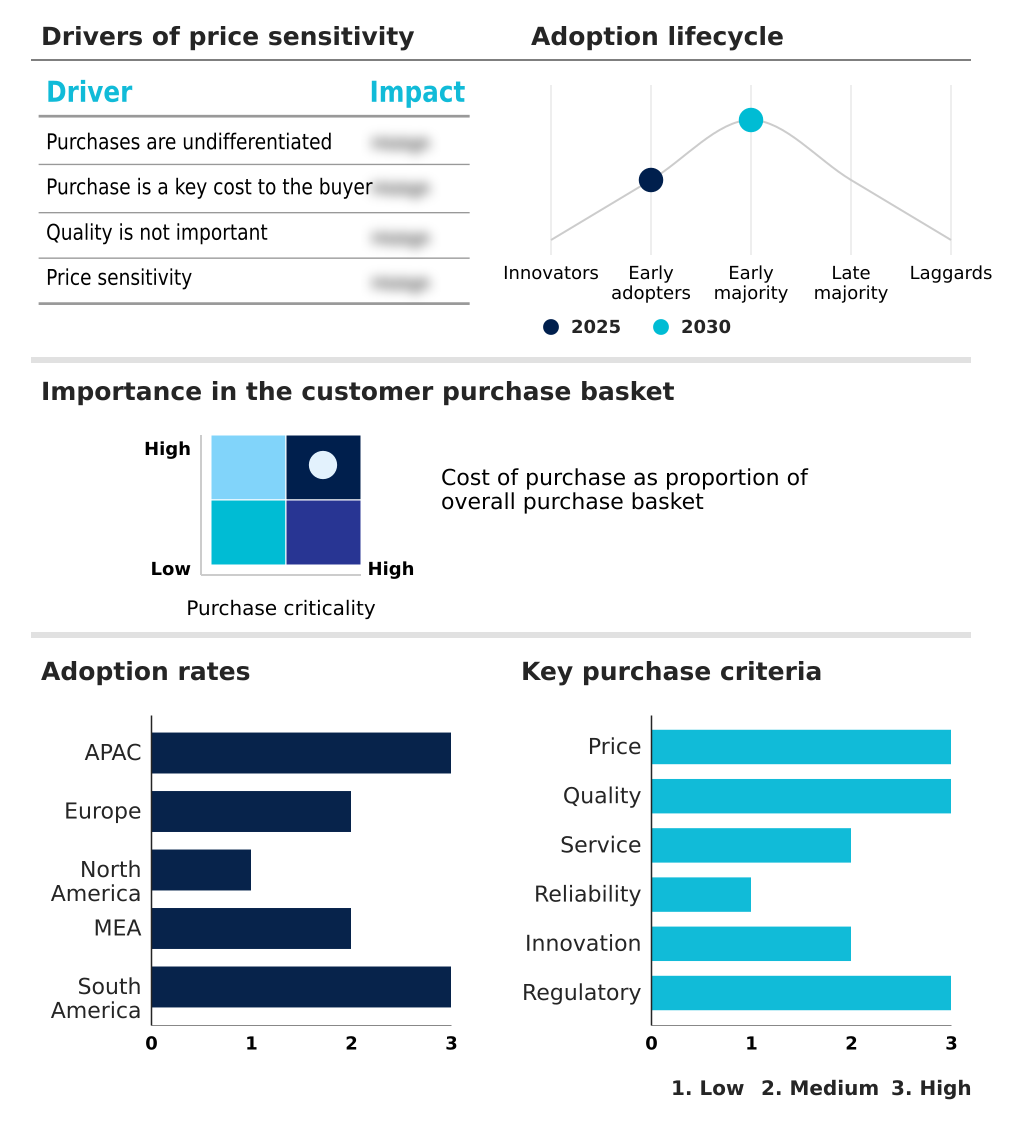
The rochelle salt market forecasting report includes the adoption lifecycle of the market, covering from the innovator’s stage to the laggard’s stage. It focuses on adoption rates in different regions based on penetration. Furthermore, the rochelle salt market report also includes key purchase criteria and drivers of price sensitivity to help companies evaluate and develop their market growth analysis strategies.
Customer Landscape of Rochelle Salt Industry
Competitive Landscape
Companies are implementing various strategies, such as strategic alliances, rochelle salt market forecast, partnerships, mergers and acquisitions, geographical expansion, and product/service launches, to enhance their presence in the industry.
Beantown Chemical Corp. - Offerings center on high-purity potassium sodium tartrate, functioning as a critical emulsifier, piezoelectric material, and complexing agent for diverse industrial and scientific applications.
The industry research and growth report includes detailed analyses of the competitive landscape of the market and information about key companies, including:
- Beantown Chemical Corp.
- Bisley and Co. Pty. Ltd.
- Central Drug House Pvt. Ltd.
- Danaher Corp.
- G.C. Chemicals Corporation
- Giovanni Randi Spa
- Hach Co.
- Loba Chemie Pvt. Ltd.
- Merck KGaA
- Novarina Srl
- Otto Chemie Pvt. Ltd.
- Sigma Aldrich Chemicals Ltd.
- Spectrum Chemical Mfg. Corp.
- SRL Pvt. Ltd.
- Tartaric Chemicals S.r.l.
- Tartaros Gonzalo Castello SL.
- Thermo Fisher Scientific Inc.
- TNJ Chemical Industry Co. Ltd.
- Tokyo Chemical Industry Co.
- Univar Solutions Inc.
Qualitative and quantitative analysis of companies has been conducted to help clients understand the wider business environment as well as the strengths and weaknesses of key industry players. Data is qualitatively analyzed to categorize companies as pure play, category-focused, industry-focused, and diversified; it is quantitatively analyzed to categorize companies as dominant, leading, strong, tentative, and weak.
Recent Development and News in Rochelle salt market
- In March 2025, the European Commission officially approved an expanded scope for the use of rochelle salt as a food additive across the European Union, facilitating its integration into a broader range of low-sodium and health-focused food formulations.
- In February 2025, Univar Solutions Inc. strengthened its specialty ingredient portfolio by entering into an exclusive distribution agreement for functional excipients in North America, enhancing the traceability of chemical intermediates through digital supply chain tools.
- In November 2024, a leading UK industrial chemical supplier announced a new strategic initiative to optimize the recovery of tartrate-based reagents from spent electroplating baths, aiming to reduce chemical waste and improve total cost of ownership for manufacturing clients.
- In September 2024, a materials science journal detailed the development of a fully recyclable piezoelectric transducer composed of rochelle salt crystals integrated into a biodegradable polylactic acid matrix, marking a milestone in eco-design for high-fidelity sensors.
Dive into Technavio’s robust research methodology, blending expert interviews, extensive data synthesis, and validated models for unparalleled Rochelle Salt Market insights. See full methodology.
| Market Scope | |
|---|---|
| Page number | 300 |
| Base year | 2025 |
| Historic period | 2020-2024 |
| Forecast period | 2026-2030 |
| Growth momentum & CAGR | Accelerate at a CAGR of 8% |
| Market growth 2026-2030 | USD 143019.9 thousand |
| Market structure | Fragmented |
| YoY growth 2025-2026(%) | 7.1% |
| Key countries | China, India, Japan, South Korea, Indonesia, Australia, Germany, UK, France, Italy, Spain, The Netherlands, US, Canada, Mexico, Saudi Arabia, UAE, Turkey, South Africa, Israel, Brazil, Argentina and Chile |
| Competitive landscape | Leading Companies, Market Positioning of Companies, Competitive Strategies, and Industry Risks |
Research Analyst Overview
- The Rochelle Salt market's trajectory is shaped by its dual role as both a specialty commodity and a high-performance technical material. The industrial-grade variant is fundamental to legacy and emerging sectors, where its crystalline structure enables key functionalities. Its use in electroplating baths as a complexing agent and chelating agent is critical for creating defect-free metallic coatings.
- Demand for its piezoelectric properties persists in specialized crystal oscillators. In laboratories, it is an essential laboratory reagent and a component of Fehling's solution. Recent innovations focus on its use in bioresorbable materials and as a leavening stabilizer in clean-label food products.
- The transition to sustainable production methods has improved yields of tartaric acid derivatives by nearly 15%, a crucial factor for boardroom decisions on supply chain resilience. This shift impacts everything from the formulation of saline-based therapeutics and processed fruit preparations to the development of advanced chemical intermediates and cyanide-based processes.
- The material's utility as a combustion regulator, its role in improving cathode efficiency, and its use in single-crystal growth for ferroelectric properties studies underscore its diverse and enduring relevance.
What are the Key Data Covered in this Rochelle Salt Market Research and Growth Report?
-
What is the expected growth of the Rochelle Salt Market between 2026 and 2030?
-
USD 143.02 million, at a CAGR of 8%
-
-
What segmentation does the market report cover?
-
The report is segmented by Type (Industrial grade, and Food grade), Application (F and B industry, Electroplating, Pharmaceuticals, and Others), Product Type (Powder, Crystal, and Solution) and Geography (APAC, Europe, North America, Middle East and Africa, South America)
-
-
Which regions are analyzed in the report?
-
APAC, Europe, North America, Middle East and Africa and South America
-
-
What are the key growth drivers and market challenges?
-
Proliferation of clean label food stabilization and natural acidulants, Interdisciplinary technical hurdles in modern piezoelectric integration
-
-
Who are the major players in the Rochelle Salt Market?
-
Beantown Chemical Corp., Bisley and Co. Pty. Ltd., Central Drug House Pvt. Ltd., Danaher Corp., G.C. Chemicals Corporation, Giovanni Randi Spa, Hach Co., Loba Chemie Pvt. Ltd., Merck KGaA, Novarina Srl, Otto Chemie Pvt. Ltd., Sigma Aldrich Chemicals Ltd., Spectrum Chemical Mfg. Corp., SRL Pvt. Ltd., Tartaric Chemicals S.r.l., Tartaros Gonzalo Castello SL., Thermo Fisher Scientific Inc., TNJ Chemical Industry Co. Ltd., Tokyo Chemical Industry Co. and Univar Solutions Inc.
-
Market Research Insights
- Market dynamics are increasingly shaped by the push for high-purity chemical intermediates and sustainable piezoelectric materials. The adoption of tartrate-based aqueous systems in metal finishing industries has enhanced operational efficiency, with some facilities reporting a 15% reduction in chemical waste through improved chemical sequestering.
- Concurrently, the demand for this eco-friendly ingredient in food processing has grown, where its use as a food processing aid can improve product stability by over 25%. As a bio-based functional agent, its integration into biodegradable electronics is a key focus, driven by regulations promoting hardware recyclability.
- This transition is influencing procurement strategies, with a clear preference for suppliers demonstrating advanced material applications and a commitment to the circular economy.
We can help! Our analysts can customize this rochelle salt market research report to meet your requirements.
 RIA -
RIA - 
