Rose Hip Market Analysis, Size, and Forecast 2025-2029: North America (US, Canada, and Mexico), Europe (Germany, UK, and France), APAC (China, Japan, and India), South America (Brazil, Argentina, and Colombia), Middle East and Africa (Saudi Arabia, UAE, and South Africa), and Rest of World (ROW)

Rose Hip Market Analysis, Size, and Forecast 2025-2029:
North America (US, Canada, and Mexico), Europe (Germany, UK, and France), APAC (China, Japan, and India), South America (Brazil, Argentina, and Colombia), Middle East and Africa (Saudi Arabia, UAE, and South Africa), and Rest of World (ROW)

Published: Dec 2025 299 Pages SKU: IRTNTR81143

Market Overview at a Glance

$126.3 Mn
Market Opportunity
7.7%
CAGR 2024 - 2029
34.7%
North America Growth
$188.9 Mn
Conventional segment 2023

Rose Hip Market Size 2025-2029

The rose hip market size is valued to increase by USD 126.3 million, at a CAGR of 7.7% from 2024 to 2029. Escalating consumer preference for natural and organic ingredients will drive the rose hip market.

Major Market Trends & Insights

  • North America dominated the market and accounted for a 34.7% growth during the forecast period.
  • By Source - Conventional segment was valued at USD 188.9 million in 2023
  • By Form Factor - Oil segment accounted for the largest market revenue share in 2023

Market Size & Forecast

  • Market Opportunities: USD 175.1 million
  • Market Future Opportunities: USD 126.3 million
  • CAGR from 2024 to 2029 : 7.7%

Market Summary

What will be the Size of the Rose Hip Market during the forecast period?

Get Key Insights on Market Forecast (PDF) Request Free Sample

How is the Rose Hip Market Segmented?

The rose hip industry research report provides comprehensive data (region-wise segment analysis), with forecasts and estimates in "USD million" for the period 2025-2029, as well as historical data from 2019-2023 for the following segments.

  • Source
    • Conventional
    • Organic
  • Form factor
    • Oil
    • Powder
    • Capsules
    • Tea
    • Others
  • Application
    • Pharmaceutical
    • Cosmetics and personal care
    • Food and beverages
    • Dietary and nutraceuticals
  • Geography
    • North America
      • US
      • Canada
      • Mexico
    • Europe
      • Germany
      • UK
      • France
    • APAC
      • China
      • Japan
      • India
    • South America
      • Brazil
      • Argentina
      • Colombia
    • Middle East and Africa
      • Saudi Arabia
      • UAE
      • South Africa
    • Rest of World (ROW)

By Source Insights

The conventional segment is estimated to witness significant growth during the forecast period.

Request Free Sample

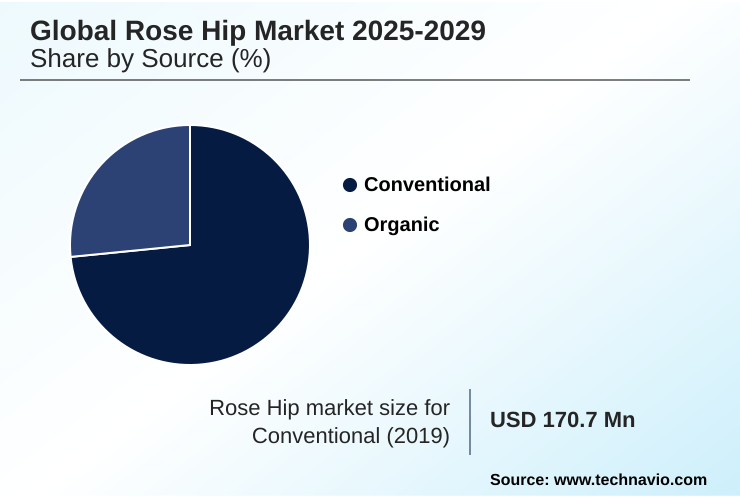
The Conventional segment was valued at USD 188.9 million in 2023 and showed a gradual increase during the forecast period.

Request Free Sample

Regional Analysis

North America is estimated to contribute 34.7% to the growth of the global market during the forecast period.Technavio’s analysts have elaborately explained the regional trends and drivers that shape the market during the forecast period.

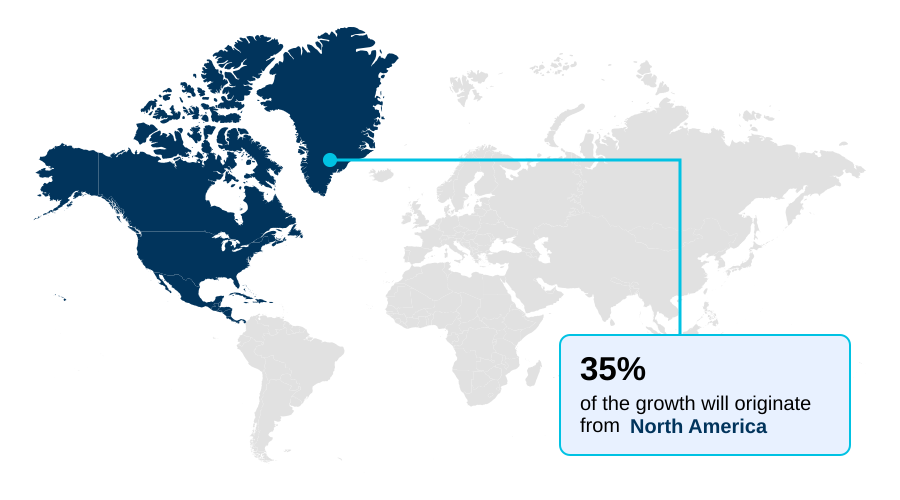
See How Rose Hip Market Demand is Rising in North America Request Free Sample

Market Dynamics

Our researchers analyzed the data with 2024 as the base year, along with the key drivers, trends, and challenges. A holistic analysis of drivers will help companies refine their marketing strategies to gain a competitive advantage.

What are the key market drivers leading to the rise in the adoption of Rose Hip Industry?

What are the market trends shaping the Rose Hip Industry?

What challenges does the Rose Hip Industry face during its growth?

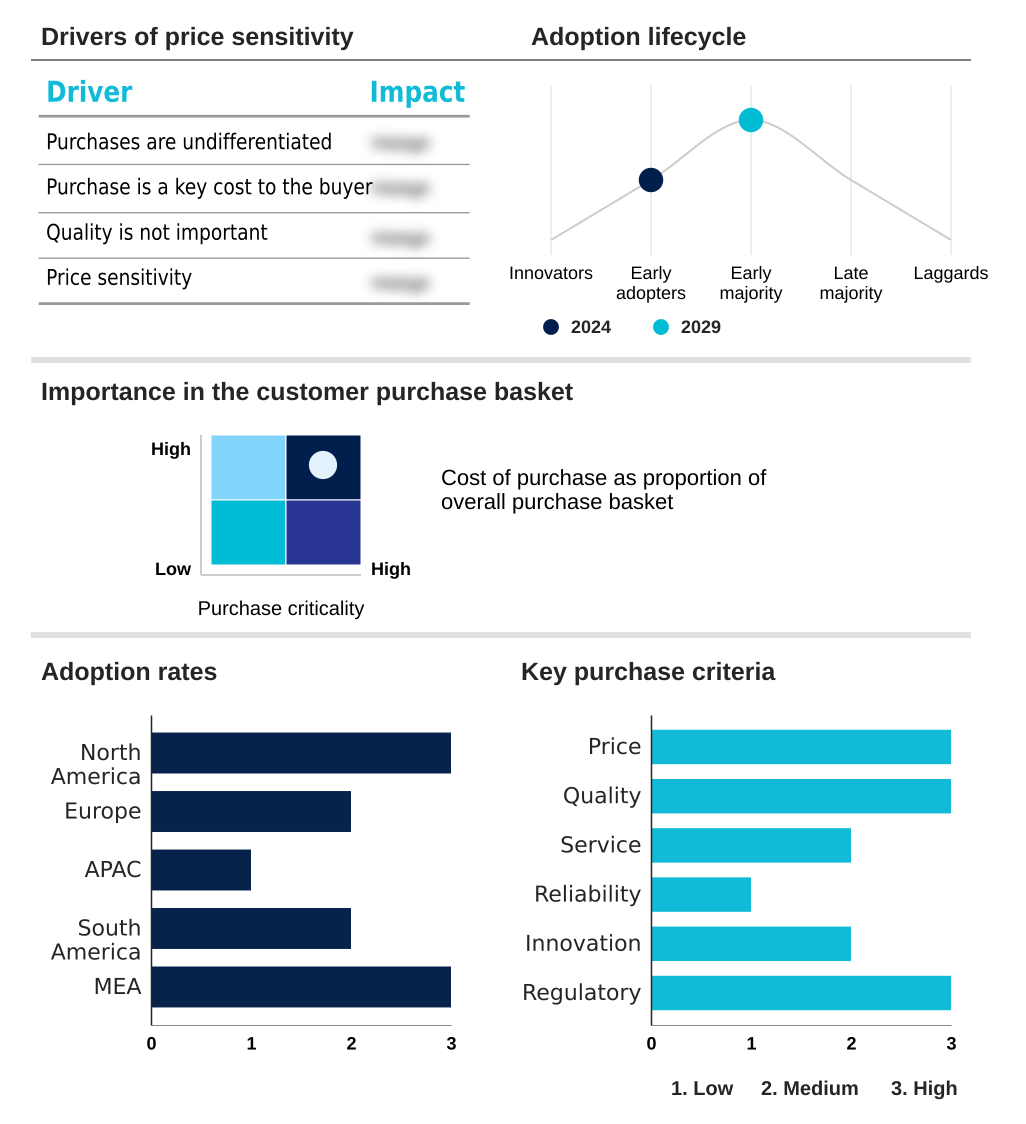
Exclusive Technavio Analysis on Customer Landscape

The rose hip market forecasting report includes the adoption lifecycle of the market, covering from the innovator’s stage to the laggard’s stage. It focuses on adoption rates in different regions based on penetration. Furthermore, the rose hip market report also includes key purchase criteria and drivers of price sensitivity to help companies evaluate and develop their market growth analysis strategies.

Customer Landscape of Rose Hip Industry

Competitive Landscape

Companies are implementing various strategies, such as strategic alliances, rose hip market forecast, partnerships, mergers and acquisitions, geographical expansion, and product/service launches, to enhance their presence in the industry.

A.G.Industries -

The industry research and growth report includes detailed analyses of the competitive landscape of the market and information about key companies, including:

  • A.G.Industries
  • Afrigetics CC
  • Agroprodex Internacional S.A.
  • Aromaaz International
  • Blue Sky Botanics Ltd.
  • BOCSCI Inc.
  • BONTOUX SAS
  • Dohler GmbH
  • Ernesto Ventos SA
  • Hilton Herbs Ltd.
  • Lebermuth Inc.
  • Morre Tec Industries Inc.
  • Oregons Wild Harvest Inc.
  • Ransom Naturals Ltd.
  • Rosehip Farm Pty Ltd.
  • Spectrum Chemical Mfg. Corp.
  • Sri Venkatesh Aromas LLC
  • The Rosehip Co.
  • Undersun Biomedtech Corp.

Qualitative and quantitative analysis of companies has been conducted to help clients understand the wider business environment as well as the strengths and weaknesses of key industry players. Data is qualitatively analyzed to categorize companies as pure play, category-focused, industry-focused, and diversified; it is quantitatively analyzed to categorize companies as dominant, leading, strong, tentative, and weak.

Recent Development and News in Rose hip market

Dive into Technavio’s robust research methodology, blending expert interviews, extensive data synthesis, and validated models for unparalleled Rose Hip Market insights. See full methodology.

Market Scope
Page number 299
Base year 2024
Historic period 2019-2023
Forecast period 2025-2029
Growth momentum & CAGR Accelerate at a CAGR of 7.7%
Market growth 2025-2029 USD 126.3 million
Market structure Fragmented
YoY growth 2024-2025(%) 7.4%
Key countries US, Canada, Mexico, Germany, UK, France, Italy, Spain, The Netherlands, China, Japan, India, South Korea, Australia, Indonesia, Brazil, Argentina, Colombia, Saudi Arabia, UAE, South Africa, Israel and Turkey
Competitive landscape Leading Companies, Market Positioning of Companies, Competitive Strategies, and Industry Risks

Request Free Sample

Research Analyst Overview

What are the Key Data Covered in this Rose Hip Market Research and Growth Report?

  • What is the expected growth of the Rose Hip Market between 2025 and 2029?

    • USD 126.3 million, at a CAGR of 7.7%

  • What segmentation does the market report cover?

    • The report is segmented by Source (Conventional, and Organic), Form Factor (Oil, Powder, Capsules, Tea, and Others), Application (Pharmaceutical, Cosmetics and personal care, Food and beverages, and Dietary and nutraceuticals ) and Geography (North America, Europe, APAC, South America, Middle East and Africa)

  • Which regions are analyzed in the report?

    • North America, Europe, APAC, South America and Middle East and Africa

  • What are the key growth drivers and market challenges?

    • Escalating consumer preference for natural and organic ingredients, Navigating supply chain volatility and processing hurdles

  • Who are the major players in the Rose Hip Market?

    • A.G.Industries, Afrigetics CC, Agroprodex Internacional S.A., Aromaaz International, Blue Sky Botanics Ltd., BOCSCI Inc., BONTOUX SAS, Dohler GmbH, Ernesto Ventos SA, Hilton Herbs Ltd., Lebermuth Inc., Morre Tec Industries Inc., Oregons Wild Harvest Inc., Ransom Naturals Ltd., Rosehip Farm Pty Ltd., Spectrum Chemical Mfg. Corp., Sri Venkatesh Aromas LLC, The Rosehip Co. and Undersun Biomedtech Corp.

Market Research Insights

We can help! Our analysts can customize this rose hip market research report to meet your requirements.

Get in touch

1. Executive Summary

1.1 Market overview

Executive Summary - Chart on Market Overview
Executive Summary - Data Table on Market Overview
Executive Summary - Chart on Global Market Characteristics
Executive Summary - Chart on Market by Geography
Executive Summary - Chart on Market Segmentation by Source
Executive Summary - Chart on Market Segmentation by Form Factor
Executive Summary - Chart on Market Segmentation by Application
Executive Summary - Chart on Incremental Growth
Executive Summary - Data Table on Incremental Growth
Executive Summary - Chart on Company Market Positioning

2. Technavio Analysis

2.1 Analysis of price sensitivity, lifecycle, customer purchase basket, adoption rates, and purchase criteria

2.2 Criticality of inputs and Factors of differentiation

Chart on Overview on criticality of inputs and factors of differentiation

2.3 Factors of disruption

Chart on Overview on factors of disruption

2.4 Impact of drivers and challenges

Chart on Impact of drivers and challenges in 2024 and 2029

3. Market Landscape

3.1 Market ecosystem

Chart on Parent Market
Data Table on - Parent Market

3.2 Market characteristics

Chart on Market characteristics analysis

3.3 Value chain analysis

Chart on Value chain analysis

4. Market Sizing

4.1 Market definition

Data Table on Offerings of companies included in the market definition

4.2 Market segment analysis

Market segments

4.3 Market size 2024

4.4 Market outlook: Forecast for 2024-2029

Chart on Global - Market size and forecast 2024-2029 ($ million)
Data Table on Global - Market size and forecast 2024-2029 ($ million)
Chart on Global Market: Year-over-year growth 2024-2029 (%)
Data Table on Global Market: Year-over-year growth 2024-2029 (%)

5. Historic Market Size

5.1 Global Rose Hip Market 2019 - 2023

Historic Market Size - Data Table on Global Rose Hip Market 2019 - 2023 ($ million)

5.2 Source segment analysis 2019 - 2023

Historic Market Size - Source Segment 2019 - 2023 ($ million)

5.3 Form Factor segment analysis 2019 - 2023

Historic Market Size - Form Factor Segment 2019 - 2023 ($ million)

5.4 Application segment analysis 2019 - 2023

Historic Market Size - Application Segment 2019 - 2023 ($ million)

5.5 Geography segment analysis 2019 - 2023

Historic Market Size - Geography Segment 2019 - 2023 ($ million)

5.6 Country segment analysis 2019 - 2023

Historic Market Size - Country Segment 2019 - 2023 ($ million)

6. Qualitative Analysis

6.1 Impact of AI in global rose hip market

7. Five Forces Analysis

7.1 Five forces summary

Five forces analysis - Comparison between 2024 and 2029

7.2 Bargaining power of buyers

Bargaining power of buyers - Impact of key factors 2024 and 2029

7.3 Bargaining power of suppliers

Bargaining power of suppliers - Impact of key factors in 2024 and 2029

7.4 Threat of new entrants

Threat of new entrants - Impact of key factors in 2024 and 2029

7.5 Threat of substitutes

Threat of substitutes - Impact of key factors in 2024 and 2029

7.6 Threat of rivalry

Threat of rivalry - Impact of key factors in 2024 and 2029

7.7 Market condition

Chart on Market condition - Five forces 2024 and 2029

8. Market Segmentation by Source

8.1 Market segments

Chart on Source - Market share 2024-2029 (%)
Data Table on Source - Market share 2024-2029 (%)

8.2 Comparison by Source

Chart on Comparison by Source
Data Table on Comparison by Source

8.3 Conventional - Market size and forecast 2024-2029

Chart on Conventional - Market size and forecast 2024-2029 ($ million)
Data Table on Conventional - Market size and forecast 2024-2029 ($ million)
Chart on Conventional - Year-over-year growth 2024-2029 (%)
Data Table on Conventional - Year-over-year growth 2024-2029 (%)

8.4 Organic - Market size and forecast 2024-2029

Chart on Organic - Market size and forecast 2024-2029 ($ million)
Data Table on Organic - Market size and forecast 2024-2029 ($ million)
Chart on Organic - Year-over-year growth 2024-2029 (%)
Data Table on Organic - Year-over-year growth 2024-2029 (%)

8.5 Market opportunity by Source

Market opportunity by Source ($ million)
Data Table on Market opportunity by Source ($ million)

9. Market Segmentation by Form Factor

9.1 Market segments

Chart on Form Factor - Market share 2024-2029 (%)
Data Table on Form Factor - Market share 2024-2029 (%)

9.2 Comparison by Form Factor

Chart on Comparison by Form Factor
Data Table on Comparison by Form Factor

9.3 Oil - Market size and forecast 2024-2029

Chart on Oil - Market size and forecast 2024-2029 ($ million)
Data Table on Oil - Market size and forecast 2024-2029 ($ million)
Chart on Oil - Year-over-year growth 2024-2029 (%)
Data Table on Oil - Year-over-year growth 2024-2029 (%)

9.4 Powder - Market size and forecast 2024-2029

Chart on Powder - Market size and forecast 2024-2029 ($ million)
Data Table on Powder - Market size and forecast 2024-2029 ($ million)
Chart on Powder - Year-over-year growth 2024-2029 (%)
Data Table on Powder - Year-over-year growth 2024-2029 (%)

9.5 Capsules - Market size and forecast 2024-2029

Chart on Capsules - Market size and forecast 2024-2029 ($ million)
Data Table on Capsules - Market size and forecast 2024-2029 ($ million)
Chart on Capsules - Year-over-year growth 2024-2029 (%)
Data Table on Capsules - Year-over-year growth 2024-2029 (%)

9.6 Tea - Market size and forecast 2024-2029

Chart on Tea - Market size and forecast 2024-2029 ($ million)
Data Table on Tea - Market size and forecast 2024-2029 ($ million)
Chart on Tea - Year-over-year growth 2024-2029 (%)
Data Table on Tea - Year-over-year growth 2024-2029 (%)

9.7 Others - Market size and forecast 2024-2029

Chart on Others - Market size and forecast 2024-2029 ($ million)
Data Table on Others - Market size and forecast 2024-2029 ($ million)
Chart on Others - Year-over-year growth 2024-2029 (%)
Data Table on Others - Year-over-year growth 2024-2029 (%)

9.8 Market opportunity by Form Factor

Market opportunity by Form Factor ($ million)
Data Table on Market opportunity by Form Factor ($ million)

10. Market Segmentation by Application

10.1 Market segments

Chart on Application - Market share 2024-2029 (%)
Data Table on Application - Market share 2024-2029 (%)

10.2 Comparison by Application

Chart on Comparison by Application
Data Table on Comparison by Application

10.3 Pharmaceutical - Market size and forecast 2024-2029

Chart on Pharmaceutical - Market size and forecast 2024-2029 ($ million)
Data Table on Pharmaceutical - Market size and forecast 2024-2029 ($ million)
Chart on Pharmaceutical - Year-over-year growth 2024-2029 (%)
Data Table on Pharmaceutical - Year-over-year growth 2024-2029 (%)

10.4 Cosmetics and personal care - Market size and forecast 2024-2029

Chart on Cosmetics and personal care - Market size and forecast 2024-2029 ($ million)
Data Table on Cosmetics and personal care - Market size and forecast 2024-2029 ($ million)
Chart on Cosmetics and personal care - Year-over-year growth 2024-2029 (%)
Data Table on Cosmetics and personal care - Year-over-year growth 2024-2029 (%)

10.5 Food and beverages - Market size and forecast 2024-2029

Chart on Food and beverages - Market size and forecast 2024-2029 ($ million)
Data Table on Food and beverages - Market size and forecast 2024-2029 ($ million)
Chart on Food and beverages - Year-over-year growth 2024-2029 (%)
Data Table on Food and beverages - Year-over-year growth 2024-2029 (%)

10.6 Dietary and nutraceuticals - Market size and forecast 2024-2029

Chart on Dietary and nutraceuticals - Market size and forecast 2024-2029 ($ million)
Data Table on Dietary and nutraceuticals - Market size and forecast 2024-2029 ($ million)
Chart on Dietary and nutraceuticals - Year-over-year growth 2024-2029 (%)
Data Table on Dietary and nutraceuticals - Year-over-year growth 2024-2029 (%)

10.7 Market opportunity by Application

Market opportunity by Application ($ million)
Data Table on Market opportunity by Application ($ million)

11. Customer Landscape

11.1 Customer landscape overview

Analysis of price sensitivity, lifecycle, customer purchase basket, adoption rates, and purchase criteria

12. Geographic Landscape

12.1 Geographic segmentation

Chart on Market share by geography 2024-2029 (%)
Data Table on Market share by geography 2024-2029 (%)

12.2 Geographic comparison

Chart on Geographic comparison
Data Table on Geographic comparison

12.3 North America - Market size and forecast 2024-2029

Chart on North America - Market size and forecast 2024-2029 ($ million)
Data Table on North America - Market size and forecast 2024-2029 ($ million)
Chart on North America - Year-over-year growth 2024-2029 (%)
Data Table on North America - Year-over-year growth 2024-2029 (%)
Chart on Regional Comparison - North America
Data Table on Regional Comparison - North America

12.3.1 US - Market size and forecast 2024-2029

Chart on US - Market size and forecast 2024-2029 ($ million)
Data Table on US - Market size and forecast 2024-2029 ($ million)
Chart on US - Year-over-year growth 2024-2029 (%)
Data Table on US - Year-over-year growth 2024-2029 (%)

12.3.2 Canada - Market size and forecast 2024-2029

Chart on Canada - Market size and forecast 2024-2029 ($ million)
Data Table on Canada - Market size and forecast 2024-2029 ($ million)
Chart on Canada - Year-over-year growth 2024-2029 (%)
Data Table on Canada - Year-over-year growth 2024-2029 (%)

12.3.3 Mexico - Market size and forecast 2024-2029

Chart on Mexico - Market size and forecast 2024-2029 ($ million)
Data Table on Mexico - Market size and forecast 2024-2029 ($ million)
Chart on Mexico - Year-over-year growth 2024-2029 (%)
Data Table on Mexico - Year-over-year growth 2024-2029 (%)

12.4 Europe - Market size and forecast 2024-2029

Chart on Europe - Market size and forecast 2024-2029 ($ million)
Data Table on Europe - Market size and forecast 2024-2029 ($ million)
Chart on Europe - Year-over-year growth 2024-2029 (%)
Data Table on Europe - Year-over-year growth 2024-2029 (%)
Chart on Regional Comparison - Europe
Data Table on Regional Comparison - Europe

12.4.1 Germany - Market size and forecast 2024-2029

Chart on Germany - Market size and forecast 2024-2029 ($ million)
Data Table on Germany - Market size and forecast 2024-2029 ($ million)
Chart on Germany - Year-over-year growth 2024-2029 (%)
Data Table on Germany - Year-over-year growth 2024-2029 (%)

12.4.2 UK - Market size and forecast 2024-2029

Chart on UK - Market size and forecast 2024-2029 ($ million)
Data Table on UK - Market size and forecast 2024-2029 ($ million)
Chart on UK - Year-over-year growth 2024-2029 (%)
Data Table on UK - Year-over-year growth 2024-2029 (%)

12.4.3 France - Market size and forecast 2024-2029

Chart on France - Market size and forecast 2024-2029 ($ million)
Data Table on France - Market size and forecast 2024-2029 ($ million)
Chart on France - Year-over-year growth 2024-2029 (%)
Data Table on France - Year-over-year growth 2024-2029 (%)

12.4.4 Italy - Market size and forecast 2024-2029

Chart on Italy - Market size and forecast 2024-2029 ($ million)
Data Table on Italy - Market size and forecast 2024-2029 ($ million)
Chart on Italy - Year-over-year growth 2024-2029 (%)
Data Table on Italy - Year-over-year growth 2024-2029 (%)

12.4.5 Spain - Market size and forecast 2024-2029

Chart on Spain - Market size and forecast 2024-2029 ($ million)
Data Table on Spain - Market size and forecast 2024-2029 ($ million)
Chart on Spain - Year-over-year growth 2024-2029 (%)
Data Table on Spain - Year-over-year growth 2024-2029 (%)

12.4.6 The Netherlands - Market size and forecast 2024-2029

Chart on The Netherlands - Market size and forecast 2024-2029 ($ million)
Data Table on The Netherlands - Market size and forecast 2024-2029 ($ million)
Chart on The Netherlands - Year-over-year growth 2024-2029 (%)
Data Table on The Netherlands - Year-over-year growth 2024-2029 (%)

12.5 APAC - Market size and forecast 2024-2029

Chart on APAC - Market size and forecast 2024-2029 ($ million)
Data Table on APAC - Market size and forecast 2024-2029 ($ million)
Chart on APAC - Year-over-year growth 2024-2029 (%)
Data Table on APAC - Year-over-year growth 2024-2029 (%)
Chart on Regional Comparison - APAC
Data Table on Regional Comparison - APAC

12.5.1 China - Market size and forecast 2024-2029

Chart on China - Market size and forecast 2024-2029 ($ million)
Data Table on China - Market size and forecast 2024-2029 ($ million)
Chart on China - Year-over-year growth 2024-2029 (%)
Data Table on China - Year-over-year growth 2024-2029 (%)

12.5.2 Japan - Market size and forecast 2024-2029

Chart on Japan - Market size and forecast 2024-2029 ($ million)
Data Table on Japan - Market size and forecast 2024-2029 ($ million)
Chart on Japan - Year-over-year growth 2024-2029 (%)
Data Table on Japan - Year-over-year growth 2024-2029 (%)

12.5.3 India - Market size and forecast 2024-2029

Chart on India - Market size and forecast 2024-2029 ($ million)
Data Table on India - Market size and forecast 2024-2029 ($ million)
Chart on India - Year-over-year growth 2024-2029 (%)
Data Table on India - Year-over-year growth 2024-2029 (%)

12.5.4 South Korea - Market size and forecast 2024-2029

Chart on South Korea - Market size and forecast 2024-2029 ($ million)
Data Table on South Korea - Market size and forecast 2024-2029 ($ million)
Chart on South Korea - Year-over-year growth 2024-2029 (%)
Data Table on South Korea - Year-over-year growth 2024-2029 (%)

12.5.5 Australia - Market size and forecast 2024-2029

Chart on Australia - Market size and forecast 2024-2029 ($ million)
Data Table on Australia - Market size and forecast 2024-2029 ($ million)
Chart on Australia - Year-over-year growth 2024-2029 (%)
Data Table on Australia - Year-over-year growth 2024-2029 (%)

12.5.6 Indonesia - Market size and forecast 2024-2029

Chart on Indonesia - Market size and forecast 2024-2029 ($ million)
Data Table on Indonesia - Market size and forecast 2024-2029 ($ million)
Chart on Indonesia - Year-over-year growth 2024-2029 (%)
Data Table on Indonesia - Year-over-year growth 2024-2029 (%)

12.6 South America - Market size and forecast 2024-2029

Chart on South America - Market size and forecast 2024-2029 ($ million)
Data Table on South America - Market size and forecast 2024-2029 ($ million)
Chart on South America - Year-over-year growth 2024-2029 (%)
Data Table on South America - Year-over-year growth 2024-2029 (%)
Chart on Regional Comparison - South America
Data Table on Regional Comparison - South America

12.6.1 Brazil - Market size and forecast 2024-2029

Chart on Brazil - Market size and forecast 2024-2029 ($ million)
Data Table on Brazil - Market size and forecast 2024-2029 ($ million)
Chart on Brazil - Year-over-year growth 2024-2029 (%)
Data Table on Brazil - Year-over-year growth 2024-2029 (%)

12.6.2 Argentina - Market size and forecast 2024-2029

Chart on Argentina - Market size and forecast 2024-2029 ($ million)
Data Table on Argentina - Market size and forecast 2024-2029 ($ million)
Chart on Argentina - Year-over-year growth 2024-2029 (%)
Data Table on Argentina - Year-over-year growth 2024-2029 (%)

12.6.3 Colombia - Market size and forecast 2024-2029

Chart on Colombia - Market size and forecast 2024-2029 ($ million)
Data Table on Colombia - Market size and forecast 2024-2029 ($ million)
Chart on Colombia - Year-over-year growth 2024-2029 (%)
Data Table on Colombia - Year-over-year growth 2024-2029 (%)

12.7 Middle East and Africa - Market size and forecast 2024-2029

Chart on Middle East and Africa - Market size and forecast 2024-2029 ($ million)
Data Table on Middle East and Africa - Market size and forecast 2024-2029 ($ million)
Chart on Middle East and Africa - Year-over-year growth 2024-2029 (%)
Data Table on Middle East and Africa - Year-over-year growth 2024-2029 (%)
Chart on Regional Comparison - Middle East and Africa
Data Table on Regional Comparison - Middle East and Africa

12.7.1 Saudi Arabia - Market size and forecast 2024-2029

Chart on Saudi Arabia - Market size and forecast 2024-2029 ($ million)
Data Table on Saudi Arabia - Market size and forecast 2024-2029 ($ million)
Chart on Saudi Arabia - Year-over-year growth 2024-2029 (%)
Data Table on Saudi Arabia - Year-over-year growth 2024-2029 (%)

12.7.2 UAE - Market size and forecast 2024-2029

Chart on UAE - Market size and forecast 2024-2029 ($ million)
Data Table on UAE - Market size and forecast 2024-2029 ($ million)
Chart on UAE - Year-over-year growth 2024-2029 (%)
Data Table on UAE - Year-over-year growth 2024-2029 (%)

12.7.3 South Africa - Market size and forecast 2024-2029

Chart on South Africa - Market size and forecast 2024-2029 ($ million)
Data Table on South Africa - Market size and forecast 2024-2029 ($ million)
Chart on South Africa - Year-over-year growth 2024-2029 (%)
Data Table on South Africa - Year-over-year growth 2024-2029 (%)

12.7.4 Israel - Market size and forecast 2024-2029

Chart on Israel - Market size and forecast 2024-2029 ($ million)
Data Table on Israel - Market size and forecast 2024-2029 ($ million)
Chart on Israel - Year-over-year growth 2024-2029 (%)
Data Table on Israel - Year-over-year growth 2024-2029 (%)

12.7.5 Turkey - Market size and forecast 2024-2029

Chart on Turkey - Market size and forecast 2024-2029 ($ million)
Data Table on Turkey - Market size and forecast 2024-2029 ($ million)
Chart on Turkey - Year-over-year growth 2024-2029 (%)
Data Table on Turkey - Year-over-year growth 2024-2029 (%)

12.8 Market opportunity by geography

Market opportunity by geography ($ million)
Data Tables on Market opportunity by geography ($ million)

13. Drivers, Challenges, and Opportunity

13.1 Market drivers

Escalating consumer preference for natural and organic ingredients
Expanding application in functional foods and dietary supplements
Surging popularity within cosmetics and personal care sector

13.2 Market challenges

Navigating supply chain volatility and processing hurdles
Confronting impacts of climate change on cultivation
Adapting to evolving regulatory landscapes and quality standardization

13.3 Impact of drivers and challenges

Impact of drivers and challenges in 2024 and 2029

13.4 Market opportunities

Intensified focus on sustainable and ethically sourced rose hip
Emergence of rose hip in pet nutrition and animal supplements
Innovation through upcycling of rose hip by-products

14. Competitive Landscape

14.1 Overview

14.2

Overview on criticality of inputs and factors of differentiation

14.3 Landscape disruption

Overview on factors of disruption

14.4 Industry risks

Impact of key risks on business

15. Competitive Analysis

15.1 Companies profiled

Companies covered

15.2 Company ranking index

15.3 Market positioning of companies

Matrix on companies position and classification

15.4 A.G.Industries

A.G.Industries - Overview
A.G.Industries - Product / Service
A.G.Industries - Key offerings
SWOT

15.5 Afrigetics CC

Afrigetics CC - Overview
Afrigetics CC - Product / Service
Afrigetics CC - Key offerings
SWOT

15.6 Agroprodex Internacional S.A.

Agroprodex Internacional S.A. - Overview
Agroprodex Internacional S.A. - Product / Service
Agroprodex Internacional S.A. - Key offerings
SWOT

15.7 Aromaaz International

Aromaaz International - Overview
Aromaaz International - Product / Service
Aromaaz International - Key offerings
SWOT

15.8 Blue Sky Botanics Ltd.

Blue Sky Botanics Ltd. - Overview
Blue Sky Botanics Ltd. - Product / Service
Blue Sky Botanics Ltd. - Key offerings
SWOT

15.9 BOCSCI Inc.

BOCSCI Inc. - Overview
BOCSCI Inc. - Product / Service
BOCSCI Inc. - Key offerings
SWOT

15.10 BONTOUX SAS

BONTOUX SAS - Overview
BONTOUX SAS - Product / Service
BONTOUX SAS - Key offerings
SWOT

15.11 Dohler GmbH

Dohler GmbH - Overview
Dohler GmbH - Product / Service
Dohler GmbH - Key offerings
SWOT

15.12 Ernesto Ventos SA

Ernesto Ventos SA - Overview
Ernesto Ventos SA - Product / Service
Ernesto Ventos SA - Key offerings
SWOT

15.13 Hilton Herbs Ltd.

Hilton Herbs Ltd. - Overview
Hilton Herbs Ltd. - Product / Service
Hilton Herbs Ltd. - Key offerings
SWOT

15.14 Lebermuth Inc.

Lebermuth Inc. - Overview
Lebermuth Inc. - Product / Service
Lebermuth Inc. - Key offerings
SWOT

15.15 Morre Tec Industries Inc.

Morre Tec Industries Inc. - Overview
Morre Tec Industries Inc. - Product / Service
Morre Tec Industries Inc. - Key offerings
SWOT

15.16 Oregons Wild Harvest Inc.

Oregons Wild Harvest Inc. - Overview
Oregons Wild Harvest Inc. - Product / Service
Oregons Wild Harvest Inc. - Key offerings
SWOT

15.17 Ransom Naturals Ltd.

Ransom Naturals Ltd. - Overview
Ransom Naturals Ltd. - Product / Service
Ransom Naturals Ltd. - Key offerings
SWOT

15.18 Rosehip Farm Pty Ltd.

Rosehip Farm Pty Ltd. - Overview
Rosehip Farm Pty Ltd. - Product / Service
Rosehip Farm Pty Ltd. - Key offerings
SWOT

16. Appendix

16.1 Scope of the report

Market definition
Objectives
Notes and caveats

16.2 Inclusions and exclusions checklist

Inclusions checklist
Exclusions checklist

16.3 Currency conversion rates for US$

16.4 Research methodology

16.5 Data procurement

Information sources

16.6 Data validation

16.7 Validation techniques employed for market sizing

16.8 Data synthesis

16.9 360 degree market analysis

16.10 List of abbreviations

Research Methodology

Technavio presents a detailed picture of the market by way of study, synthesis, and summation of data from multiple sources. The analysts have presented the various facets of the market with a particular focus on identifying the key industry influencers. The data thus presented is comprehensive, reliable, and the result of extensive research, both primary and secondary.

INFORMATION SOURCES

Primary sources

  • Manufacturers and suppliers
  • Channel partners
  • Industry experts
  • Strategic decision makers

Secondary sources

  • Industry journals and periodicals
  • Government data
  • Financial reports of key industry players
  • Historical data
  • Press releases

DATA ANALYSIS

Data Synthesis

  • Collation of data
  • Estimation of key figures
  • Analysis of derived insights

Data Validation

  • Triangulation with data models
  • Reference against proprietary databases
  • Corroboration with industry experts

REPORT WRITING

Qualitative

  • Market drivers
  • Market challenges
  • Market trends
  • Five forces analysis

Quantitative

  • Market size and forecast
  • Market segmentation
  • Geographical insights
  • Competitive landscape

Interested in this report?

Get your sample now to see our research methodology and insights!

Download Now

Frequently Asked Questions

Rose Hip market growth will increase by USD 126.3 million during 2025-2029.

The Rose Hip market is expected to grow at a CAGR of 7.7% during 2025-2029.

Rose Hip market is segmented by Source (Conventional, Organic) Form factor (Oil, Powder, Capsules, Tea, Others) Application (Pharmaceutical, Cosmetics and personal care, Food and beverages, Dietary and nutraceuticals)

A.G.Industries, Afrigetics CC, Agroprodex Internacional S.A., Aromaaz International, Blue Sky Botanics Ltd., BOCSCI Inc., BONTOUX SAS, Dohler GmbH, Ernesto Ventos SA, Hilton Herbs Ltd., Lebermuth Inc., Morre Tec Industries Inc., Oregons Wild Harvest Inc., Ransom Naturals Ltd., Rosehip Farm Pty Ltd., Spectrum Chemical Mfg. Corp., Sri Venkatesh Aromas LLC, The Rosehip Co., Undersun Biomedtech Corp. are a few of the key vendors in the Rose Hip market.

North America will register the highest growth rate of 34.7% among the other regions. Therefore, the Rose Hip market in North America is expected to garner significant business opportunities for the vendors during the forecast period.

US, Canada, Mexico, Germany, UK, France, Italy, Spain, The Netherlands, China, Japan, India, South Korea, Australia, Indonesia, Brazil, Argentina, Colombia, Saudi Arabia, UAE, South Africa, Israel, Turkey

  • Escalating consumer preference for natural and organic ingredients is the driving factor this market.

The Rose Hip market vendors should focus on grabbing business opportunities from the Source segment as it accounted for the largest market share in the base year.