Stone Fruit Market Analysis APAC, Europe, North America, Middle East and Africa, South America - China, US, Spain, Italy, India, France, South Korea, Germany, Brazil, Canada - Size and Forecast 2025-2029

Stone Fruit Market Analysis APAC, Europe, North America, Middle East and Africa, South America - China, US, Spain, Italy, India, France, South Korea, Germany, Brazil, Canada - Size and Forecast 2025-2029

Published: Jan 2025 204 Pages SKU: IRTNTR76858

Market Overview at a Glance

$20.02 B
Market Opportunity
4%
CAGR
3.6
YoY growth 2024-2025(%)

Stone Fruit Market Size 2025-2029

The stone fruit market size is forecast to increase by USD 20.02 billion, at a CAGR of 4% between 2024 and 2029.

  • The market is experiencing significant growth in Europe, driven by the increasing production and consumption of peaches and nectarines. This trend is further fueled by the growing awareness and promotion of the health benefits associated with consuming these fruits. However, the market faces a notable challenge in its high dependence on weather conditions. Unfavorable weather can lead to crop losses and supply chain disruptions, posing a significant risk to market stability. To capitalize on the market's opportunities, companies must focus on implementing robust supply chain strategies and invest in research and development to improve crop resilience against weather-related risks.
  • Additionally, targeting health-conscious consumers through effective marketing campaigns can help boost demand for stone fruits. Overall, the market presents a dynamic and challenging landscape, requiring strategic planning and agility to navigate weather risks and capitalize on the growing consumer interest in these nutritious fruits.

What will be the Size of the Stone Fruit Market during the forecast period?

Stone Fruit Market Size

Explore in-depth regional segment analysis with market size data - historical 2019-2023 and forecasts 2025-2029 - in the full report.  
Request Free Sample

The market continues to evolve, shaped by dynamic market dynamics and various sectors. Quality control and soil health are paramount in ensuring optimal yield and product quality. Irrigation systems and precision agriculture are revolutionizing farming practices, enhancing water usage efficiency and reducing environmental impact. Export markets and food processing sectors are leveraging advanced technology for traceability systems, cold storage, and food safety. Innovations in packaging, from sustainable materials to extended shelf life, are addressing food waste concerns. Processing efficiency, acidity levels, and consumer preferences for dried and canned fruit are driving market growth. Sustainability certifications and environmental sustainability are increasingly important, influencing pricing strategies and brand loyalty.

Soil fertility and nutrient management are crucial for maintaining optimal growing conditions. Post-harvest handling, including texture analysis and ripening processes, is essential for preserving fruit quality. Energy consumption and supply chain management are areas of focus for reducing carbon footprint and enhancing distribution channels. Farm labor, transportation logistics, and international trade are significant factors in the market's intricacies. Disease control and water conservation are essential for sustainable farming practices. Government regulations and agricultural subsidies play a role in market dynamics, while pest management and harvesting techniques ensure a consistent supply. In the realm of stone fruit production, the interplay of these factors creates a complex and ever-changing landscape, with ongoing unfolding and evolving patterns shaping the market.

How is this Stone Fruit Industry segmented?

The stone fruit industry research report provides comprehensive data (region-wise segment analysis), with forecasts and estimates in "USD billion" for the period 2025-2029, as well as historical data from 2019-2023 for the following segments.

  • Distribution Channel
    • Offline
    • Online
  • Type
    • Peaches and nectarines
    • Plums
    • Mangoes
    • Cherries
    • Others
  • Geography
    • North America
      • US
      • Canada
    • Europe
      • France
      • Germany
      • Italy
      • Spain
    • APAC
      • China
      • India
      • South Korea
    • South America
      • Brazil
    • Rest of World (ROW)

By Distribution Channel Insights

The offline segment is estimated to witness significant growth during the forecast period.

The market dynamics and trends encompass various aspects, including distribution channels, consumer preferences, and sustainable farming practices. Offline distribution, primarily through hygienic supermarkets, department stores, and convenience stores, remains a significant segment. Major players, such as Tesco Plc and Walmart Inc., dominate this sector, offering a wide array of stone fruits under their brands. The growing number of retailers entering the market is anticipated to boost offline sales. Environmental sustainability is a critical factor influencing the stone fruit industry. Irrigation systems ensure optimal water usage, while precision agriculture and soil fertility management enhance yield. Traceability systems and food safety measures ensure consumer confidence.

Frozen stone fruits, with extended shelf life, are gaining popularity due to their convenience and reduced food waste. Brand loyalty is a crucial pricing strategy for market players. Cold storage facilities enable year-round availability, while processing efficiency and acidity levels maintain product quality. Consumer preferences for organic, dried, and canned fruits are driving innovation in packaging materials and sustainability certifications. Export markets, particularly in Europe and Asia, are expanding, necessitating efficient supply chain management and transportation logistics. Government regulations and agricultural subsidies impact production costs and market prices. Disease control, water conservation, and farm labor are essential concerns for environmental sustainability and ethical business practices.

Processing techniques, such as texture analysis and ripening processes, ensure consistent product quality. High-density planting and harvesting techniques optimize yield, while post-harvest handling and fruit preserves maintain freshness. Sustainability certifications, such as USDA Organic and Fair Trade, are increasingly important for market differentiation. Innovations in food processing, including cold pasteurization and high-pressure processing, ensure food safety and extended shelf life. Data analytics and yield optimization technologies help farmers improve crop rotation, nutrient management, and pest management. The carbon footprint of the stone fruit industry is under scrutiny, with a focus on reducing energy consumption and improving efficiency. The market is a dynamic and evolving landscape, shaped by consumer preferences, sustainable farming practices, and technological advancements.

Stone Fruit Market Size

Request Free Sample

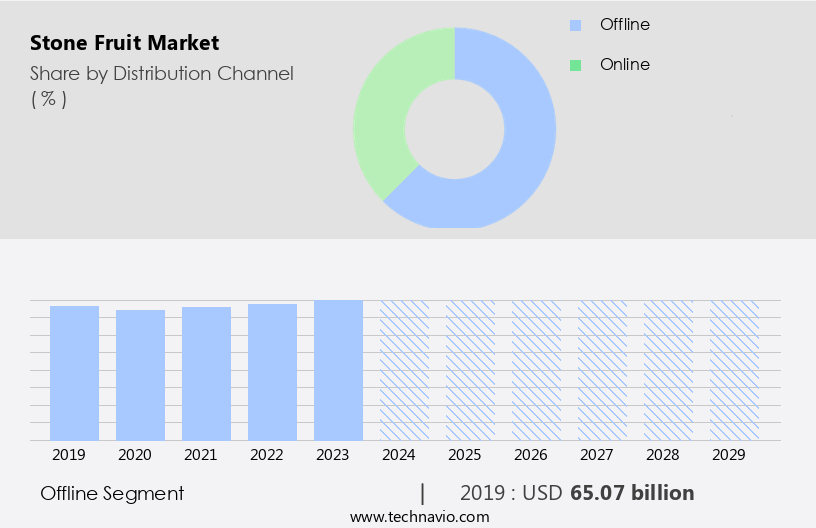
The Offline segment was valued at USD 65.07 billion in 2019 and showed a gradual increase during the forecast period.

Regional Analysis

APAC is estimated to contribute 40% to the growth of the global market during the forecast period. Technavio's analysts have elaborately explained the regional trends and drivers that shape the market during the forecast period.

Stone Fruit Market Share by Geography

 Request Free Sample

The market in the APAC region is experiencing significant growth due to increasing health consciousness, shifting dietary preferences, and a growing appreciation for exotic fruits. China, a major player in this market, leads as the world's largest producer and exporter, accounting for over 90% of the global market share. The Chinese fruit industry primarily focuses on the Bing variety, renowned for its large size and sweet taste. Irrigation systems and precision agriculture are crucial in ensuring optimal yield and soil health. Shelf life and traceability systems are essential for maintaining food safety and brand loyalty. Waste reduction strategies and energy-efficient cold storage are key to minimizing environmental impact and reducing costs.

Food processing techniques, including freezing, texture analysis, and fruit preserves, help extend the shelf life and enhance the overall consumer experience. Sustainability certifications, water conservation, and disease control are essential components of the supply chain management process. Consumer preferences for organic farming, canned fruit, and dried fruit continue to influence market trends. Processing efficiency, acidity levels, and post-harvest handling are critical factors in ensuring product quality and meeting food safety regulations. The market is also impacted by factors such as government regulations, water usage, transportation logistics, and international trade, all of which influence pricing strategies and distribution channels.

Market Dynamics

Our researchers analyzed the data with 2024 as the base year, along with the key drivers, trends, and challenges. A holistic analysis of drivers will help companies refine their marketing strategies to gain a competitive advantage.

Nestled within the expansive horticultural industry lies the vibrant and thriving market. This market showcases a diverse range of succulent fruits, including peaches, nectarines, plums, cherries, and apricots. Each stone fruit variety boasts unique flavors, textures, and colors, captivating consumers worldwide. Orchardists meticulously cultivate these fruits, employing sustainable farming practices to ensure optimal ripeness and sweetness. The market caters to various segments, including fresh produce retailers, food processors, and exporters. Consumers crave stone fruits for their nutritional benefits, with each fruit rich in vitamins, minerals, and fiber. Stone fruits are versatile, used in a myriad of culinary applications, from baking to preserving, and are also popular for their health-promoting properties. The market continues to grow, fueled by increasing consumer demand for natural, healthy, and delicious food options.

What are the key market drivers leading to the rise in the adoption of Stone Fruit Industry?

  • The significant increase in peach and nectarine production and consumption levels in Europe serves as the primary market driver. 
  • The European market, specifically for peaches and nectarines, experienced significant growth in 2023, reaching a value of USD 4.7 billion, marking a 5.2% increase from the previous year. This expansion can be attributed to the high per capita consumption of these fruits in the European Union (EU). Italy, Greece, and Spain were the leading consumers, collectively accounting for 75% of the total consumption, with volumes of 1.1 million tons, 900,000 tons, and 700,000 tons, respectively. Key market drivers include the implementation of advanced technologies such as irrigation systems, traceability systems, and cold storage facilities, ensuring longer shelf life and reducing food waste.
  • Pricing strategies, waste reduction, and energy consumption efficiency are also essential factors influencing market growth. Furthermore, environmental sustainability and texture analysis are becoming increasingly important in supply chain management. The market for frozen fruit is also gaining traction due to its extended shelf life and convenience. These factors collectively contribute to the growth and development of the European market.

What are the market trends shaping the Stone Fruit Industry?

  • The consumption of berries is gaining increasing recognition due to their numerous health benefits, making them a popular trend in the market. Awareness and promotion of these benefits are driving demand for berries in various industries, including food and beverage, cosmetics, and pharmaceuticals.
  • The market is driven by the numerous health advantages linked to the consumption of berries and the rising consumer awareness of these benefits. Antioxidants, which are abundant in berries, play a crucial role in neutralizing free radicals, unstable molecules generated during metabolism. The food and beverage industry is witnessing a surge in demand for antioxidants due to their extensive use in energy drinks, bars, and powders. Consequently, berries are gaining significant traction in the food and beverage, as well as the personal care industries. Some of the key health benefits of berries include their antioxidant properties, which help regulate free radicals, and their potential role in improving cardiovascular health, cognitive function, and eye health.
  • Quality control measures, such as soil health, nutrient management, and precision agriculture, are essential to maintaining the optimal growing conditions for stone fruits and ensuring their nutritional value and food safety. Packaging innovation plays a vital role in preserving the fruit's freshness and extending its shelf life, while processing efficiency and acidity levels are crucial factors in food processing. Ultimately, consumer preferences for dried and canned fruits continue to fuel market growth.

What challenges does the Stone Fruit Industry face during its growth?

  • The industry's growth is significantly influenced by the high dependence on unfavorable weather conditions, posing a substantial challenge. 
  • Stone fruit production is susceptible to the impact of adverse weather conditions, which can negatively influence yield and quality. Natural calamities such as heavy rain, floods, tropical storms, and droughts pose significant risks to the market. These events can lead to the destruction of irrigation systems and loss of harvest, ultimately affecting the volume and quality of the crop yield. Climatic conditions are changing globally, with severe droughts and floods becoming more frequent in various regions. To mitigate these risks, stone fruit farmers employ various strategies such as yield optimization, post-harvest handling, and disease control. Sustainability certifications, including organic farming and water conservation practices, are increasingly important in the industry.
  • Data analytics is used to optimize water usage and improve farm labor efficiency. Fruit preserves provide an alternative revenue stream during off-seasons. Distribution channels and retail sales are crucial for market growth, requiring effective supply chain management and marketing strategies.

Exclusive Customer Landscape

The stone fruit market forecasting report includes the adoption lifecycle of the market, covering from the innovator's stage to the laggard's stage. It focuses on adoption rates in different regions based on penetration. Furthermore, the stone fruit market report also includes key purchase criteria and drivers of price sensitivity to help companies evaluate and develop their market growth analysis strategies.

Stone Fruit Market Share by Geography

 Customer Landscape

Key Companies & Market Insights

Companies are implementing various strategies, such as strategic alliances, stone fruit market forecast, partnerships, mergers and acquisitions, geographical expansion, and product/service launches, to enhance their presence in the industry.

Dole plc - The company specializes in providing a selection of premium stone fruits, including peaches and nectarines, available in their raw or packaged forms. 

The industry research and growth report includes detailed analyses of the competitive landscape of the market and information about key companies, including:

  • Dole plc
  • Driscolls Inc.
  • Family Tree Farms
  • Fruit World Co.
  • Gargiulo Produce
  • Giumarra Vineyards
  • Hortifrut SA
  • Mount Adams Fruit
  • Naturipe Farms LLC
  • Oneonta Starr Ranch Growers
  • Pacific Trellis Fruit
  • Prima Wawona
  • PSB PRODUCCION VEGETAL SL
  • Sahyadri Farms Post Harvest Care Ltd.
  • Salix Fruits
  • SAT Plus Berries
  • Stemilt Growers LLC
  • Sun World International LLC
  • Titan Farms LLC.

Qualitative and quantitative analysis of companies has been conducted to help clients understand the wider business environment as well as the strengths and weaknesses of key industry players. Data is qualitatively analyzed to categorize companies as pure play, category-focused, industry-focused, and diversified; it is quantitatively analyzed to categorize companies as dominant, leading, strong, tentative, and weak.

Recent Development and News in Stone Fruit Market

  • In January 2024, SunWorld International, a leading stone fruit breeder and marketer, announced the successful launch of its new peach variety, 'SunSweet Red Haven,' at the annual Fresh Produce and Flower Association of New Zealand (FPANZ) conference (SunWorld International Press Release, 2024). This variety, known for its exceptional sweetness and firmness, was expected to revolutionize the global peach market.
  • In March 2024, Dole Food Company, a major player in the stone fruit industry, entered into a strategic partnership with Blue River Technology, a leading precision agriculture technology provider. This collaboration aimed to improve Dole's farming practices and increase the yield and quality of its stone fruit crops using Blue River's precision agriculture solutions (Dole Food Company Press Release, 2024).
  • In April 2025, The Hershey Company, a renowned confectionery manufacturer, acquired a minority stake in SunMaid Growers of California, a significant player in the dried the market. The investment was aimed at expanding Hershey's presence in the healthy snacks segment and strengthening its relationship with SunMaid (The Hershey Company Press Release, 2025).
  • In May 2025, the European Union (EU) approved the use of methyl bromide as a quarantine and pre-shipment fumigant for stone fruits imported from non-EU countries. This decision was expected to boost the global stone fruit trade, as many countries, including the United States, heavily relied on methyl bromide for controlling pests and diseases during the shipping process (European Commission Press Release, 2025).

Research Analyst Overview

  • In the dynamic market, soil testing plays a crucial role in optimizing orchard management and ensuring high yield per hectare. Crop insurance mitigates financial risk for farmers, while adherence to grading standards maintains brand positioning and consumer trust. Trade agreements and tariff barriers impact pricing models, necessitating market research and sales forecasting. Pest-resistant varieties and pruning techniques minimize supply chain risks, as do logistics optimization and weather pattern analysis. Fruit maturity, sensory evaluation, and consumer demographics guide marketing strategies and new product launches.
  • Disease resistance and fertilizer application are essential for tree health, while quality assurance and risk management ensure a competitive advantage. Global competition, investment opportunities, and pollinator health are ongoing concerns for industry players. Circular economy initiatives, sustainable packaging, and waste management are increasingly important for long-term success.

Dive into Technavio's robust research methodology, blending expert interviews, extensive data synthesis, and validated models for unparalleled Stone Fruit Market insights. See full methodology.

Market Scope

Report Coverage

Details

Page number

204

Base year

2024

Historic period

2019-2023

Forecast period

2025-2029

Growth momentum & CAGR

Accelerate at a CAGR of 4%

Market growth 2025-2029

USD 20.02 billion

Market structure

Fragmented

YoY growth 2024-2025(%)

3.6

Key countries

China, US, Spain, Italy, India, France, South Korea, Germany, Brazil, and Canada

Competitive landscape

Leading Companies, Market Positioning of Companies, Competitive Strategies, and Industry Risks

Request Free Sample

What are the Key Data Covered in this Stone Fruit Market Research and Growth Report?

  • CAGR of the Stone Fruit industry during the forecast period
  • Detailed information on factors that will drive the growth and forecasting between 2025 and 2029
  • Precise estimation of the size of the market and its contribution of the industry in focus to the parent market
  • Accurate predictions about upcoming growth and trends and changes in consumer behaviour
  • Growth of the market across APAC, Europe, North America, Middle East and Africa, and South America
  • Thorough analysis of the market's competitive landscape and detailed information about companies
  • Comprehensive analysis of factors that will challenge the stone fruit market growth of industry companies

We can help! Our analysts can customize this stone fruit market research report to meet your requirements.

Get in touch

1 Executive Summary

  • 1.1 Market overview
    • Executive Summary - Chart on Market Overview
    • Executive Summary - Data Table on Market Overview
    • Executive Summary - Chart on Global Market Characteristics
    • Executive Summary - Chart on Market by Geography
    • Executive Summary - Chart on Market Segmentation by Distribution Channel
    • Executive Summary - Chart on Market Segmentation by Type
    • Executive Summary - Chart on Incremental Growth
    • Executive Summary - Data Table on Incremental Growth
    • Executive Summary - Chart on Company Market Positioning

2 Technavio Analysis

  • 2.1 Analysis of price sensitivity, lifecycle, customer purchase basket, adoption rates, and purchase criteria
    • Analysis of price sensitivity, lifecycle, customer purchase basket, adoption rates, and purchase criteria
  • 2.2 Criticality of inputs and Factors of differentiation
    • Overview on criticality of inputs and factors of differentiation
  • 2.3 Factors of disruption
    • Overview on factors of disruption
  • 2.4 Impact of drivers and challenges
    • Impact of drivers and challenges in 2024 and 2029

3 Market Landscape

  • 3.1 Market ecosystem
    • Parent Market
    • Data Table on - Parent Market
  • 3.2 Market characteristics
    • Market characteristics analysis
  • 3.3 Value chain analysis
    • Value chain analysis

4 Market Sizing

  • 4.1 Market definition
    • Offerings of companies included in the market definition
  • 4.2 Market segment analysis
    • Market segments
  • 4.3 Market size 2024
    • 4.4 Market outlook: Forecast for 2024-2029
      • Chart on Global - Market size and forecast 2024-2029 ($ million)
      • Data Table on Global - Market size and forecast 2024-2029 ($ million)
      • Chart on Global Market: Year-over-year growth 2024-2029 (%)
      • Data Table on Global Market: Year-over-year growth 2024-2029 (%)

    5 Historic Market Size

    • 5.1 Global Stone Fruit Market 2019 - 2023
      • Historic Market Size - Data Table on Global Stone Fruit Market 2019 - 2023 ($ million)
    • 5.2 Distribution Channel segment analysis 2019 - 2023
      • Historic Market Size - Distribution Channel Segment 2019 - 2023 ($ million)
    • 5.3 Type segment analysis 2019 - 2023
      • Historic Market Size - Type Segment 2019 - 2023 ($ million)
    • 5.4 Geography segment analysis 2019 - 2023
      • Historic Market Size - Geography Segment 2019 - 2023 ($ million)
    • 5.5 Country segment analysis 2019 - 2023
      • Historic Market Size - Country Segment 2019 - 2023 ($ million)

    6 Qualitative Analysis

    • 6.1 The AI impact on Global Stone Fruit Market

      7 Five Forces Analysis

      • 7.1 Five forces summary
        • Five forces analysis - Comparison between 2024 and 2029
      • 7.2 Bargaining power of buyers
        • Bargaining power of buyers - Impact of key factors 2024 and 2029
      • 7.3 Bargaining power of suppliers
        • Bargaining power of suppliers - Impact of key factors in 2024 and 2029
      • 7.4 Threat of new entrants
        • Threat of new entrants - Impact of key factors in 2024 and 2029
      • 7.5 Threat of substitutes
        • Threat of substitutes - Impact of key factors in 2024 and 2029
      • 7.6 Threat of rivalry
        • Threat of rivalry - Impact of key factors in 2024 and 2029
      • 7.7 Market condition
        • Chart on Market condition - Five forces 2024 and 2029

      8 Market Segmentation by Distribution Channel

      • 8.1 Market segments
        • Chart on Distribution Channel - Market share 2024-2029 (%)
        • Data Table on Distribution Channel - Market share 2024-2029 (%)
      • 8.2 Comparison by Distribution Channel
        • Chart on Comparison by Distribution Channel
        • Data Table on Comparison by Distribution Channel
      • 8.3 Offline - Market size and forecast 2024-2029
        • Chart on Offline - Market size and forecast 2024-2029 ($ million)
        • Data Table on Offline - Market size and forecast 2024-2029 ($ million)
        • Chart on Offline - Year-over-year growth 2024-2029 (%)
        • Data Table on Offline - Year-over-year growth 2024-2029 (%)
      • 8.4 Online - Market size and forecast 2024-2029
        • Chart on Online - Market size and forecast 2024-2029 ($ million)
        • Data Table on Online - Market size and forecast 2024-2029 ($ million)
        • Chart on Online - Year-over-year growth 2024-2029 (%)
        • Data Table on Online - Year-over-year growth 2024-2029 (%)
      • 8.5 Market opportunity by Distribution Channel
        • Market opportunity by Distribution Channel ($ million)
        • Data Table on Market opportunity by Distribution Channel ($ million)

      9 Market Segmentation by Type

      • 9.1 Market segments
        • Chart on Type - Market share 2024-2029 (%)
        • Data Table on Type - Market share 2024-2029 (%)
      • 9.2 Comparison by Type
        • Chart on Comparison by Type
        • Data Table on Comparison by Type
      • 9.3 Peaches and nectarines - Market size and forecast 2024-2029
        • Chart on Peaches and nectarines - Market size and forecast 2024-2029 ($ million)
        • Data Table on Peaches and nectarines - Market size and forecast 2024-2029 ($ million)
        • Chart on Peaches and nectarines - Year-over-year growth 2024-2029 (%)
        • Data Table on Peaches and nectarines - Year-over-year growth 2024-2029 (%)
      • 9.4 Plums - Market size and forecast 2024-2029
        • Chart on Plums - Market size and forecast 2024-2029 ($ million)
        • Data Table on Plums - Market size and forecast 2024-2029 ($ million)
        • Chart on Plums - Year-over-year growth 2024-2029 (%)
        • Data Table on Plums - Year-over-year growth 2024-2029 (%)
      • 9.5 Mangoes - Market size and forecast 2024-2029
        • Chart on Mangoes - Market size and forecast 2024-2029 ($ million)
        • Data Table on Mangoes - Market size and forecast 2024-2029 ($ million)
        • Chart on Mangoes - Year-over-year growth 2024-2029 (%)
        • Data Table on Mangoes - Year-over-year growth 2024-2029 (%)
      • 9.6 Cherries - Market size and forecast 2024-2029
        • Chart on Cherries - Market size and forecast 2024-2029 ($ million)
        • Data Table on Cherries - Market size and forecast 2024-2029 ($ million)
        • Chart on Cherries - Year-over-year growth 2024-2029 (%)
        • Data Table on Cherries - Year-over-year growth 2024-2029 (%)
      • 9.7 Others - Market size and forecast 2024-2029
        • Chart on Others - Market size and forecast 2024-2029 ($ million)
        • Data Table on Others - Market size and forecast 2024-2029 ($ million)
        • Chart on Others - Year-over-year growth 2024-2029 (%)
        • Data Table on Others - Year-over-year growth 2024-2029 (%)
      • 9.8 Market opportunity by Type
        • Market opportunity by Type ($ million)
        • Data Table on Market opportunity by Type ($ million)

      10 Customer Landscape

      • 10.1 Customer landscape overview
        • Analysis of price sensitivity, lifecycle, customer purchase basket, adoption rates, and purchase criteria

      11 Geographic Landscape

      • 11.1 Geographic segmentation
        • Chart on Market share by geography 2024-2029 (%)
        • Data Table on Market share by geography 2024-2029 (%)
      • 11.2 Geographic comparison
        • Chart on Geographic comparison
        • Data Table on Geographic comparison
      • 11.3 APAC - Market size and forecast 2024-2029
        • Chart on APAC - Market size and forecast 2024-2029 ($ million)
        • Data Table on APAC - Market size and forecast 2024-2029 ($ million)
        • Chart on APAC - Year-over-year growth 2024-2029 (%)
        • Data Table on APAC - Year-over-year growth 2024-2029 (%)
      • 11.4 Europe - Market size and forecast 2024-2029
        • Chart on Europe - Market size and forecast 2024-2029 ($ million)
        • Data Table on Europe - Market size and forecast 2024-2029 ($ million)
        • Chart on Europe - Year-over-year growth 2024-2029 (%)
        • Data Table on Europe - Year-over-year growth 2024-2029 (%)
      • 11.5 North America - Market size and forecast 2024-2029
        • Chart on North America - Market size and forecast 2024-2029 ($ million)
        • Data Table on North America - Market size and forecast 2024-2029 ($ million)
        • Chart on North America - Year-over-year growth 2024-2029 (%)
        • Data Table on North America - Year-over-year growth 2024-2029 (%)
      • 11.6 Middle East and Africa - Market size and forecast 2024-2029
        • Chart on Middle East and Africa - Market size and forecast 2024-2029 ($ million)
        • Data Table on Middle East and Africa - Market size and forecast 2024-2029 ($ million)
        • Chart on Middle East and Africa - Year-over-year growth 2024-2029 (%)
        • Data Table on Middle East and Africa - Year-over-year growth 2024-2029 (%)
      • 11.7 South America - Market size and forecast 2024-2029
        • Chart on South America - Market size and forecast 2024-2029 ($ million)
        • Data Table on South America - Market size and forecast 2024-2029 ($ million)
        • Chart on South America - Year-over-year growth 2024-2029 (%)
        • Data Table on South America - Year-over-year growth 2024-2029 (%)
      • 11.8 China - Market size and forecast 2024-2029
        • Chart on China - Market size and forecast 2024-2029 ($ million)
        • Data Table on China - Market size and forecast 2024-2029 ($ million)
        • Chart on China - Year-over-year growth 2024-2029 (%)
        • Data Table on China - Year-over-year growth 2024-2029 (%)
      • 11.9 US - Market size and forecast 2024-2029
        • Chart on US - Market size and forecast 2024-2029 ($ million)
        • Data Table on US - Market size and forecast 2024-2029 ($ million)
        • Chart on US - Year-over-year growth 2024-2029 (%)
        • Data Table on US - Year-over-year growth 2024-2029 (%)
      • 11.10 Spain - Market size and forecast 2024-2029
        • Chart on Spain - Market size and forecast 2024-2029 ($ million)
        • Data Table on Spain - Market size and forecast 2024-2029 ($ million)
        • Chart on Spain - Year-over-year growth 2024-2029 (%)
        • Data Table on Spain - Year-over-year growth 2024-2029 (%)
      • 11.11 Italy - Market size and forecast 2024-2029
        • Chart on Italy - Market size and forecast 2024-2029 ($ million)
        • Data Table on Italy - Market size and forecast 2024-2029 ($ million)
        • Chart on Italy - Year-over-year growth 2024-2029 (%)
        • Data Table on Italy - Year-over-year growth 2024-2029 (%)
      • 11.12 India - Market size and forecast 2024-2029
        • Chart on India - Market size and forecast 2024-2029 ($ million)
        • Data Table on India - Market size and forecast 2024-2029 ($ million)
        • Chart on India - Year-over-year growth 2024-2029 (%)
        • Data Table on India - Year-over-year growth 2024-2029 (%)
      • 11.13 France - Market size and forecast 2024-2029
        • Chart on France - Market size and forecast 2024-2029 ($ million)
        • Data Table on France - Market size and forecast 2024-2029 ($ million)
        • Chart on France - Year-over-year growth 2024-2029 (%)
        • Data Table on France - Year-over-year growth 2024-2029 (%)
      • 11.14 South Korea - Market size and forecast 2024-2029
        • Chart on South Korea - Market size and forecast 2024-2029 ($ million)
        • Data Table on South Korea - Market size and forecast 2024-2029 ($ million)
        • Chart on South Korea - Year-over-year growth 2024-2029 (%)
        • Data Table on South Korea - Year-over-year growth 2024-2029 (%)
      • 11.15 Germany - Market size and forecast 2024-2029
        • Chart on Germany - Market size and forecast 2024-2029 ($ million)
        • Data Table on Germany - Market size and forecast 2024-2029 ($ million)
        • Chart on Germany - Year-over-year growth 2024-2029 (%)
        • Data Table on Germany - Year-over-year growth 2024-2029 (%)
      • 11.16 Brazil - Market size and forecast 2024-2029
        • Chart on Brazil - Market size and forecast 2024-2029 ($ million)
        • Data Table on Brazil - Market size and forecast 2024-2029 ($ million)
        • Chart on Brazil - Year-over-year growth 2024-2029 (%)
        • Data Table on Brazil - Year-over-year growth 2024-2029 (%)
      • 11.17 Canada - Market size and forecast 2024-2029
        • Chart on Canada - Market size and forecast 2024-2029 ($ million)
        • Data Table on Canada - Market size and forecast 2024-2029 ($ million)
        • Chart on Canada - Year-over-year growth 2024-2029 (%)
        • Data Table on Canada - Year-over-year growth 2024-2029 (%)
      • 11.18 Market opportunity by geography
        • Market opportunity by geography ($ million)
        • Data Tables on Market opportunity by geography ($ million)

      12 Drivers, Challenges, and Opportunity/Restraints

      • 12.1 Market drivers
        • 12.2 Market challenges
          • 12.3 Impact of drivers and challenges
            • Impact of drivers and challenges in 2024 and 2029
          • 12.4 Market opportunities/restraints

            13 Competitive Landscape

            • 13.1 Overview
              • 13.2 Competitive Landscape
                • Overview on criticality of inputs and factors of differentiation
              • 13.3 Landscape disruption
                • Overview on factors of disruption
              • 13.4 Industry risks
                • Impact of key risks on business

              14 Competitive Analysis

              • 14.1 Companies profiled
                • Companies covered
              • 14.2 Company ranking index
                • Company ranking index
              • 14.3 Market positioning of companies
                • Matrix on companies position and classification
              • 14.4 Dole plc
                • Dole plc - Overview
                • Dole plc - Business segments
                • Dole plc - Key offerings
                • Dole plc - Segment focus
                • SWOT
              • 14.5 Family Tree Farms
                • Family Tree Farms - Overview
                • Family Tree Farms - Product / Service
                • Family Tree Farms - Key offerings
                • SWOT
              • 14.6 Fruit World Co.
                • Fruit World Co. - Overview
                • Fruit World Co. - Product / Service
                • Fruit World Co. - Key offerings
                • SWOT
              • 14.7 Gargiulo Produce
                • Gargiulo Produce - Overview
                • Gargiulo Produce - Product / Service
                • Gargiulo Produce - Key offerings
                • SWOT
              • 14.8 Giumarra Vineyards
                • Giumarra Vineyards - Overview
                • Giumarra Vineyards - Product / Service
                • Giumarra Vineyards - Key offerings
                • SWOT
              • 14.9 Hortifrut SA
                • Hortifrut SA - Overview
                • Hortifrut SA - Business segments
                • Hortifrut SA - Key offerings
                • Hortifrut SA - Segment focus
                • SWOT
              • 14.10 Naturipe Farms LLC
                • Naturipe Farms LLC - Overview
                • Naturipe Farms LLC - Product / Service
                • Naturipe Farms LLC - Key offerings
                • SWOT
              • 14.11 Oneonta Starr Ranch Growers
                • Oneonta Starr Ranch Growers - Overview
                • Oneonta Starr Ranch Growers - Product / Service
                • Oneonta Starr Ranch Growers - Key offerings
                • SWOT
              • 14.12 Pacific Trellis Fruit
                • Pacific Trellis Fruit - Overview
                • Pacific Trellis Fruit - Product / Service
                • Pacific Trellis Fruit - Key offerings
                • SWOT
              • 14.13 PSB PRODUCCION VEGETAL SL
                • PSB PRODUCCION VEGETAL SL - Overview
                • PSB PRODUCCION VEGETAL SL - Product / Service
                • PSB PRODUCCION VEGETAL SL - Key offerings
                • SWOT
              • 14.14 Salix Fruits
                • Salix Fruits - Overview
                • Salix Fruits - Product / Service
                • Salix Fruits - Key offerings
                • SWOT
              • 14.15 SAT Plus Berries
                • SAT Plus Berries - Overview
                • SAT Plus Berries - Product / Service
                • SAT Plus Berries - Key offerings
                • SWOT
              • 14.16 Stemilt Growers LLC
                • Stemilt Growers LLC - Overview
                • Stemilt Growers LLC - Product / Service
                • Stemilt Growers LLC - Key offerings
                • SWOT
              • 14.17 Sun World International LLC
                • Sun World International LLC - Overview
                • Sun World International LLC - Product / Service
                • Sun World International LLC - Key offerings
                • SWOT
              • 14.18 Titan Farms LLC.
                • Titan Farms LLC. - Overview
                • Titan Farms LLC. - Product / Service
                • Titan Farms LLC. - Key offerings
                • SWOT

              15 Appendix

              • 15.1 Scope of the report
                • 15.2 Inclusions and exclusions checklist
                  • Inclusions checklist
                  • Exclusions checklist
                • 15.3 Currency conversion rates for US$
                  • Currency conversion rates for US$
                • 15.4 Research methodology
                  • Research methodology
                • 15.5 Data procurement
                  • Information sources
                • 15.6 Data validation
                  • Data validation
                • 15.7 Validation techniques employed for market sizing
                  • Validation techniques employed for market sizing
                • 15.8 Data synthesis
                  • Data synthesis
                • 15.9 360 degree market analysis
                  • 360 degree market analysis
                • 15.10 List of abbreviations
                  • List of abbreviations

                Research Methodology

                Technavio presents a detailed picture of the market by way of study, synthesis, and summation of data from multiple sources. The analysts have presented the various facets of the market with a particular focus on identifying the key industry influencers. The data thus presented is comprehensive, reliable, and the result of extensive research, both primary and secondary.

                INFORMATION SOURCES

                Primary sources

                • Manufacturers and suppliers
                • Channel partners
                • Industry experts
                • Strategic decision makers

                Secondary sources

                • Industry journals and periodicals
                • Government data
                • Financial reports of key industry players
                • Historical data
                • Press releases

                DATA ANALYSIS

                Data Synthesis

                • Collation of data
                • Estimation of key figures
                • Analysis of derived insights

                Data Validation

                • Triangulation with data models
                • Reference against proprietary databases
                • Corroboration with industry experts

                REPORT WRITING

                Qualitative

                • Market drivers
                • Market challenges
                • Market trends
                • Five forces analysis

                Quantitative

                • Market size and forecast
                • Market segmentation
                • Geographical insights
                • Competitive landscape

                Interested in this report?

                Get your sample now to see our research methodology and insights!

                Download Now

                Frequently Asked Questions

                Stone Fruit market growth will increase by $ 20.02 bn during 2025-2029 .

                The Stone Fruit market is expected to grow at a CAGR of 4% during 2025-2029 .

                Stone Fruit market is segmented by Distribution Channel( Offline, Online) Type( Peaches and nectarines, Plums, Mangoes, Cherries, Others)

                Dole plc, Driscolls Inc., Family Tree Farms, Fruit World Co., Gargiulo Produce, Giumarra Vineyards, Hortifrut SA, Mount Adams Fruit, Naturipe Farms LLC, Oneonta Starr Ranch Growers, Pacific Trellis Fruit, Prima Wawona, PSB PRODUCCION VEGETAL SL, Sahyadri Farms Post Harvest Care Ltd., Salix Fruits, SAT Plus Berries, Stemilt Growers LLC, Sun World International LLC, Titan Farms LLC. are a few of the key vendors in the Stone Fruit market.

                APAC will register the highest growth rate of 40% among the other regions. Therefore, the Stone Fruit market in APAC is expected to garner significant business opportunities for the vendors during the forecast period.

                China, US, Spain, Italy, India, France, South Korea, Germany, Brazil, Canada

                • Rising production and consumption of peaches and nectarines in EuropeThe size of the peach and nectarine market in the European Union (EU) rose sharply to $4.7 billion in 2023 is the driving factor this market.
                • a 5.2% growth over that in 2022. This was attributed to the high per capita consumption of peaches and nectarines in the region. For instance is the driving factor this market.
                • in 2023 is the driving factor this market.
                • the countries with the highest volumes of peach and nectarine consumption were Italy (1.1 million tons) is the driving factor this market.
                • Greece (900 is the driving factor this market.
                • 000 tons) is the driving factor this market.
                • and Spain (700 is the driving factor this market.
                • 000 tons) is the driving factor this market.
                • which together accounted for 75% share of the total consumption in the EU. Further is the driving factor this market.
                • in 2023 is the driving factor this market.
                • the highest levels of per capita consumption of peaches and nectarines were registered in Greece is the driving factor this market.
                • i.e. is the driving factor this market.
                • 78 kilograms (kg) per person is the driving factor this market.
                • followed by Italy with 17 kg per person is the driving factor this market.
                • Spain with 14 kg per person is the driving factor this market.
                • and Portugal with 7 kg per person is the driving factor this market.
                • while the global average per capita consumption of peaches and nectarines was estimated at 7.8 kg per person. In value terms is the driving factor this market.
                • Italy ($1.5 billion) is the driving factor this market.
                • Spain ($1 billion) is the driving factor this market.
                • and Greece ($800 million) were the countries with the highest market value for peaches and nectarines in 2023 and together accounted for a 69% share of the total market.In 2023 is the driving factor this market.
                • the most notable rate of growth in terms of peach and nectarine production in major producing countries in Europe was witnessed in Greece is the driving factor this market.
                • while peach and nectarine production in other leading countries in the region experienced mixed trends in production figures. Furthermore is the driving factor this market.
                • in 2023 is the driving factor this market.
                • the annual growth rate of peach and nectarine per capita consumption in Greece increased by 15.5%. The remaining major peach and nectarine-consuming countries in Europe recorded the following average annual rates of per capita consumption growth: Italy (6.8% per year) and Spain (4.5% per year). The countries with the highest volumes of peach and nectarine production in 2023 were Spain (1.4 million tons) is the driving factor this market.
                • Italy (1 million tons) is the driving factor this market.
                • and Greece (950 is the driving factor this market.
                • 000 tons) is the driving factor this market.
                • which together accounted for 93% of total production. Thus is the driving factor this market.
                • the trends in regional consumption is the driving factor this market.
                • imports is the driving factor this market.
                • and exports will further drive the growth of the global stone fruit market during the forecast period. is the driving factor this market.

                The Stone Fruit market vendors should focus on grabbing business opportunities from the Offline segment as it accounted for the largest market share in the base year.