Rugged Equipment Market Analysis North America, Europe, APAC, South America, Middle East and Africa - US, Canada, China, Germany, UK - Size and Forecast 2024-2028

Rugged Equipment Market Analysis North America, Europe, APAC, South America, Middle East and Africa - US, Canada, China, Germany, UK - Size and Forecast 2024-2028

Published: Oct 2023 174 Pages SKU: IRTNTR45736

Market Overview at a Glance

$13.49 B
Market Opportunity
5.93%
CAGR
5.25
YoY growth 2023-2024(%)

Rugged Equipment Market Size 2024-2028

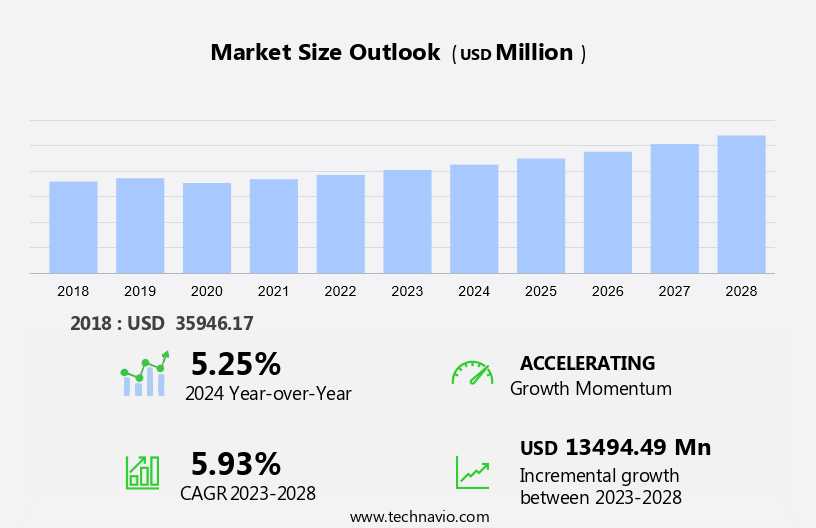
The rugged equipment market size is forecast to increase by USD 13.49 billion at a CAGR of 5.93% between 2023 and 2028.

  • The market is witnessing significant growth due to the increasing demand from industrial end-users. The integration of Internet of Things (IoT) technology in rugged devices is another key trend driving market growth. However, the high initial cost of procurement compared to non-rugged devices remains a challenge for market expansion. The market growth is attributed to the increasing need for reliable and durable equipment in harsh environments, particularly in industries such as oil and gas, mining, and construction. The adoption of IoT in rugged equipment enables real-time monitoring and data collection, leading to improved operational efficiency and productivity. Despite the challenges, the market is expected to continue growing due to the increasing demand for rugged devices in various industries and the benefits they offer over non-rugged alternatives.

What will be the Size of the Rugged Equipment Market During the Forecast Period?

Rugged Equipment Market Size

 Request Free Sample

  • The market encompasses a diverse range of products engineered to withstand harsh environments and demanding industries. Key market dynamics include technological advancements and research and development In the areas of durability, designs, and innovative solutions. The market is driven by the need for overall efficiency and productivity in sectors such as defense, construction, and manufacturing. Manufacturing techniques have evolved to incorporate smart technologies, sustainable materials, and the Internet of Things (IoT), resulting in featuring connectivity, real-time monitoring, predictive maintenance, and data-driven insights. Rugged communication systems, rugged computers, rugged displays, and other equipment cater to the unique requirements of industries where reliability and durability are paramount.
  • The defense and military sector continues to be a significant contributor to the market, with a focus on rugged equipment for real-time situational awareness and mission-critical applications. Smart sensors and connectivity features enable seamless integration and enable industries to optimize their operations, enhancing their competitive edge.

How is this Rugged Equipment Industry segmented and which is the largest segment?

The report provides comprehensive data (region-wise segment analysis), with forecasts and estimates in "USD million" for the period 2024-2028, as well as historical data from 2018-2022 for the following segments.
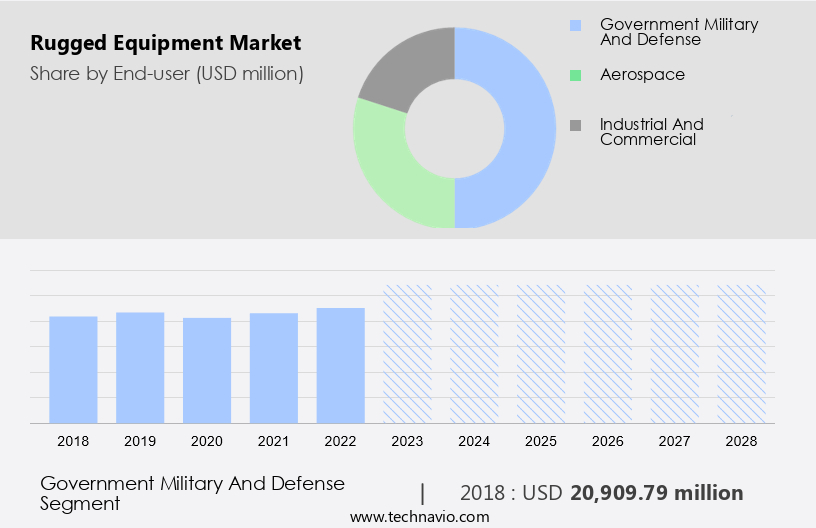
  • End-user
    • Government military and defense
    • Aerospace
    • Industrial and commercial
  • Product
    • Communication equipment
    • Computer system
    • Display
  • Geography
    • North America
      • Canada
      • US
    • Europe
      • Germany
      • UK
    • APAC
      • China
    • South America
    • Middle East and Africa

By End-user Insights

  • The government military and defense segment is estimated to witness significant growth during the forecast period.

The market experiences steady growth due to increasing demand from defense, construction, and manufacturing industries. Technological advancements and research & development in durability designs, innovative solutions, and overall efficiency are key driving factors. Manufacturing techniques employing smart technologies, sustainable materials, and productivity enhancements contribute to the market's expansion. The Internet of Things, smart sensors, connectivity features, real-time monitoring radio, predictive maintenance, and data-driven insights are integral to rugged communication solutions. In military applications, rugged computers, displays, and communication equipment are essential for demanding environments, ensuring tactical durability, longevity assurance, and extreme condition performance. Infrastructure development and military modernization initiatives fuel market adoption, while budgetary constraints and regional insights may impact growth. Advanced technologies, such as ruggedization techniques, outdoor durability, and design, continue to shape the market landscape.

Rugged Equipment Market Size

Get a glance at the market report of share of various segments Request Free Sample

The Government military and defense segment was valued at USD 20.91 billion in 2018 and showed a gradual increase during the forecast period.

Regional Analysis

  • North America is estimated to contribute 35% to the growth of the global market during the forecast period.

Technavio's analysts have elaborately explained the regional trends and drivers that shape the market during the forecast period.

Rugged Equipment Market Share by Geography

For more insights on the market size of various regions, Request Free Sample

The market In the US is experiencing significant growth due to increased defense spending, driven primarily by the country's military modernization efforts. In 2022, the US military budget accounted for approximately 40% of global military expenditures, amounting to a substantial investment. This growth is influenced by the demand for durable solutions in military applications, as well as infrastructure development projects In the defense sector. In South America, geopolitical tensions in countries like Uruguay, Brazil, and Nicaragua due to the presence of armed groups have also contributed to the demand in the region. Technological advancements, such as smart technologies, sustainable materials, and the Internet of Things, are driving innovation in designs, providing overall efficiency and productivity improvements.

Manufacturing techniques, including ruggedization and military-grade specifications, ensure tactical durability and longevity assurance. Key factors include extreme conditions, real-time monitoring, predictive maintenance, and data-driven insights. The market is expected to continue growing, with trends toward rugged communication, smart sensors, connectivity features, and smart technologies shaping the future of solutions.

Market Dynamics

Our researchers analyzed the data with 2023 as the base year, along with the key drivers, trends, and challenges. A holistic analysis of drivers will help companies refine their marketing strategies to gain a competitive advantage.

What are the key market drivers leading to the rise In the adoption of Rugged Equipment Industry?

Growth of industrial end-users is the key driver of the market.

  • The market is experiencing significant growth due to its increasing adoption in demanding industries such as defense, construction, and manufacturing. Technological advancements, research and development, and innovative solutions are driving the market, with a focus on durability, designs, and overall efficiency. companies are implementing manufacturing techniques that incorporate smart technologies, sustainable materials, and connectivity features to enhance productivity. In the defense sector, the need in military applications is increasing due to military modernization and infrastructure development. Rugged communication, smart sensors, real-time monitoring, predictive maintenance, and data-driven insights are essential features in military and defense applications.
  • In the construction and development industry, rugged equipment is essential for outdoor durability and design. Impact-resistant appliances, waterproof devices, vibration-resistant tools, and heavy-duty electronics are critical for construction sites and outdoor adventures. The market's growth is, however, restrained by budgetary constraints and the high cost of rugged equipment. Despite these challenges, the market is expected to grow steadily during the forecast period, with a focus on ruggedization techniques and extreme conditions. The market is witnessing significant growth due to its increasing adoption in various industries. The market's growth is driven by technological advancements, research and development, and the need for rugged equipment in harsh environments.
  • Despite the challenges, the market is expected to grow steadily during the forecast period, with a focus on innovation and cost reduction.

What are the market trends shaping the Rugged Equipment Industry?

Incorporation of internet of things in rugged equipment is the upcoming market trend.

  • Rugged equipment, utilized extensively in defense, construction, and manufacturing industries, is witnessing significant technological advancements due to the integration of the Internet of Things (IoT) and smart technologies. The forecast period for this market is marked by the adoption of innovative solutions that enhance overall efficiency, durability, and productivity. Rugged equipment, engineered to withstand extreme conditions, is designed with military-grade specifications, ensuring tactical durability and longevity assurance. IoT plays a pivotal role in this market, enabling real-time monitoring, predictive maintenance, and data-driven insights. Smart sensors and connectivity features are integral to rugged communication systems, enabling seamless interaction between humans and machines.
  • These technological advancements are driving factors for the market, particularly in defense and emergency services, military applications, and infrastructure development. However, budgetary constraints and regional insights may act as restraining factors. Manufacturing techniques continue to evolve, with a focus on sustainable materials and ruggedization techniques, ensuring outdoor durability and design. The market is further fueled by the increasing preference for rugged solutions in demanding industries, including military and defense, construction and development, and outdoor adventures. Smart technologies, such as impact-resistant appliances, waterproof devices, and vibration-resistant tools, are essential for heavy-duty electronics used In these industries. The integration of these technologies is transforming the market, enabling improved operational environments and productivity in harsh conditions.

What challenges does the Rugged Equipment Industry face during its growth?

High initial cost of procurement compared with non-rugged devices is a key challenge affecting the industry growth.

  • Rugged equipment engineered to withstand harsh environments and demanding industries is a significant investment for enterprises and businesses. Although the initial procurement cost is higher than commercial equipment, the total cost of ownership (TCO) is often lower. In contrast, consumer-grade products may appear more attractive due to their lower upfront cost. However, the TCO analysis reveals that rugged equipment, with its durability, designs, and innovative solutions, offers overall efficiency and productivity gains. Technological advancements, such as smart technologies, the Internet of Things, smart sensors, connectivity features, real-time monitoring, predictive maintenance, and data-driven insights, contribute to the lower TCO. Rugged communication solutions, including rugged computers, displays, and military-grade specifications, ensure tactical durability and longevity assurance in extreme conditions.
  • The defense sector, infrastructure development, military modernization, and construction and development industries are key driving factors for the market. Budgetary constraints and regional insights may act as restraining factors. Regardless, the adoption of rugged solutions is on the rise due to their ability to perform optimally in harsh operational environments, making them essential for industries requiring ruggedization techniques, such as military applications, outdoor adventures, and heavy-duty electronics.

Exclusive Customer Landscape

The rugged equipment market forecasting report includes the adoption lifecycle of the market, covering from the innovator's stage to the laggard's stage. It focuses on adoption rates in different regions based on penetration. Furthermore, the rugged equipment market report also includes key purchase criteria and drivers of price sensitivity to help companies evaluate and develop their market growth analysis strategies.
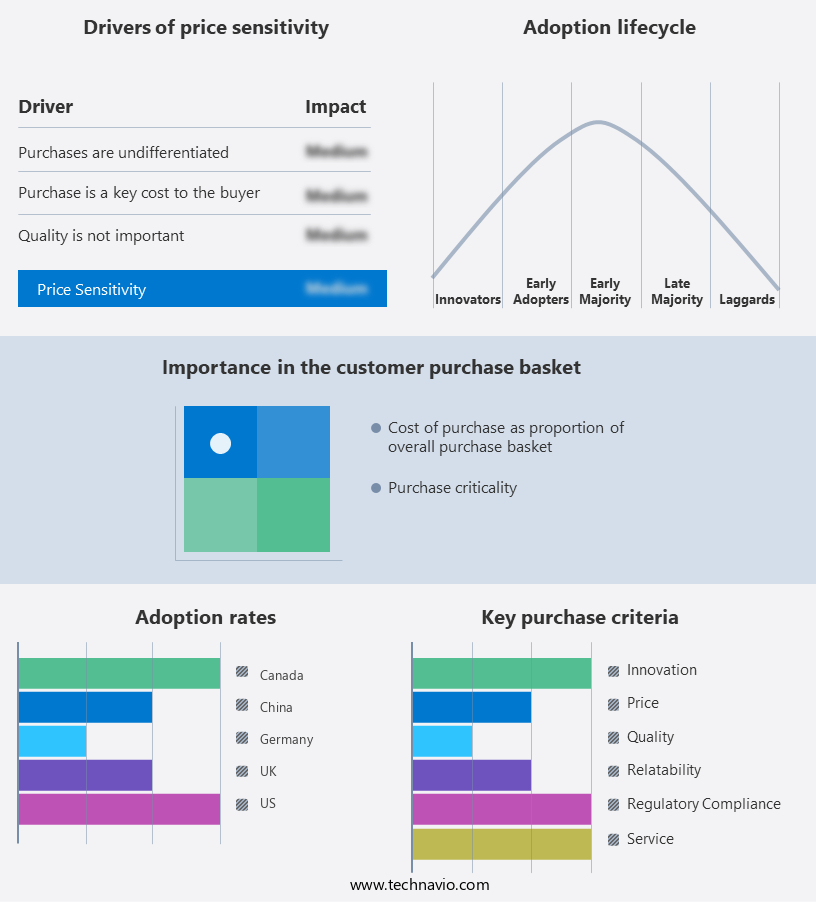
Rugged Equipment Market Share by Geography

 Customer Landscape

Key Companies & Market Insights

Companies are implementing various strategies, such as strategic alliances, rugged equipment market forecast, partnerships, mergers and acquisitions, geographical expansion, and product/service launches, to enhance their presence In the industry.

The industry research and growth report includes detailed analyses of the competitive landscape of the market and information about key companies, including:

  • AMETEK Inc.
  • Curtiss Wright Corp.
  • Dell Technologies Inc.
  • Ecrin Systems
  • Extreme Engineering Solutions Inc.
  • General Dynamics Corp.
  • Getac Technology Corp.
  • Honeywell International Inc.
  • Kontron AG
  • L3Harris Technologies Inc.
  • Leonardo DRS Inc.
  • Panasonic Holdings Corp.
  • Raytheon Technologies Corp.
  • Siemens AG
  • Trimble Inc.
  • Zebra Technologies Corp.
  • MilDef Group AB
  • Sparton Rugged Electronics
  • Systel Inc.
  • Winmate Inc.

Qualitative and quantitative analysis of companies has been conducted to help clients understand the wider business environment as well as the strengths and weaknesses of key industry players. Data is qualitatively analyzed to categorize companies as pure play, category-focused, industry-focused, and diversified; it is quantitatively analyzed to categorize companies as dominant, leading, strong, tentative, and weak.

Research Analyst Overview

The market encompasses a range of products engineered to withstand demanding environments and operational conditions. These solutions cater to various industries, including defense, construction, and manufacturing, where durability and overall efficiency are paramount. Technological advancements have significantly influenced the rugged equipment landscape, leading to the development of innovative designs and smart technologies. Manufacturers have embraced manufacturing techniques that ensure tactical durability and longevity assurance. Rugged communication equipment, for instance, is designed to operate in extreme conditions, providing real-time monitoring, predictive maintenance, and data-driven insights. The integration of the Internet of Things (IoT), smart sensors, and connectivity features has enabled these devices to deliver valuable information in real-time, enhancing productivity and operational efficiency.

Rugged displays, computers, and other heavy-duty electronics are essential components of rugged equipment. Military-grade specifications and advanced technologies are employed to create impact-resistant appliances and waterproof devices. Vibration-resistant tools are also a crucial part of the market, catering to industries where equipment is subjected to harsh conditions. The adoption of rugged solutions is driven by several factors. In the defense sector, military applications require equipment that can withstand the rigors of military modernization and the demands of operational environments. Infrastructure development projects also necessitate rugged equipment to ensure the longevity of structures and installations. However, budgetary constraints and regional insights can act as restraining factors In the market.

Defense sectors and military applications often face significant budgetary pressures, which may limit the adoption of advanced technologies and rugged equipment. Regional differences in infrastructure development and industrial requirements can also impact the demand for rugged equipment. The market is characterized by a continuous quest for innovation and durability. Manufacturers are investing in research and development to create rugged solutions that cater to the needs of various industries, from defense and military to construction and development. The integration of smart technologies, sustainable materials, and ruggedization techniques is transforming the rugged equipment landscape, ensuring that these solutions remain essential tools for businesses operating in demanding environments.

Market Scope

Report Coverage

Details

Page number

174

Base year

2023

Historic period

2018-2022

Forecast period

2024-2028

Growth momentum & CAGR

Accelerate at a CAGR of 5.93%

Market growth 2024-2028

USD 13.49 Billion

Market structure

Fragmented

YoY growth 2023-2024(%)

5.25

Key countries

US, Canada, China, Germany, and UK

Competitive landscape

Leading Companies, Market Positioning of Companies, Competitive Strategies, and Industry Risks

Request Free Sample

What are the Key Data Covered in this Rugged Equipment Market Research and Growth Report?

  • CAGR of the Rugged Equipment industry during the forecast period
  • Detailed information on factors that will drive the growth and forecasting between 2024 and 2028
  • Precise estimation of the size of the market and its contribution of the industry in focus to the parent market
  • Accurate predictions about upcoming growth and trends and changes in consumer behaviour
  • Growth of the market across North America, Europe, APAC, South America, and Middle East and Africa
  • Thorough analysis of the market's competitive landscape and detailed information about companies
  • Comprehensive analysis of factors that will challenge the rugged equipment market growth of industry companies

We can help! Our analysts can customize this rugged equipment market research report to meet your requirements.

Get in touch

1 Executive Summary

  • 1.1 Market overview
    • Exhibit 01: Executive Summary – Chart on Market Overview
    • Exhibit 02: Executive Summary – Data Table on Market Overview
    • Exhibit 03: Executive Summary – Chart on Global Market Characteristics
    • Exhibit 04: Executive Summary – Chart on Market by Geography
    • Exhibit 05: Executive Summary – Chart on Market Segmentation by End-user
    • Exhibit 06: Executive Summary – Chart on Market Segmentation by Product
    • Exhibit 07: Executive Summary – Chart on Incremental Growth
    • Exhibit 08: Executive Summary – Data Table on Incremental Growth
    • Exhibit 09: Executive Summary – Chart on Vendor Market Positioning

2 Market Landscape

  • 2.1 Market ecosystem
    • Exhibit 10: Parent market
    • Exhibit 11: Market Characteristics

3 Market Sizing

  • 3.1 Market definition
    • Exhibit 12: Offerings of vendors included in the market definition
  • 3.2 Market segment analysis
    • Exhibit 13: Market segments
  • 3.3 Market size 2023
    • 3.4 Market outlook: Forecast for 2023-2028
      • Exhibit 14: Chart on Global - Market size and forecast 2023-2028 ($ million)
      • Exhibit 15: Data Table on Global - Market size and forecast 2023-2028 ($ million)
      • Exhibit 16: Chart on Global Market: Year-over-year growth 2023-2028 (%)
      • Exhibit 17: Data Table on Global Market: Year-over-year growth 2023-2028 (%)

    4 Historic Market Size

    • 4.1 Global rugged equipment market 2018 - 2022
      • Exhibit 18: Historic Market Size – Data Table on global rugged equipment market 2018 - 2022 ($ million)
    • 4.2 End-user Segment Analysis 2018 - 2022
      • Exhibit 19: Historic Market Size – End-user Segment 2018 - 2022 ($ million)
    • 4.3 Product Segment Analysis 2018 - 2022
      • Exhibit 20: Historic Market Size – Product Segment 2018 - 2022 ($ million)
    • 4.4 Geography Segment Analysis 2018 - 2022
      • Exhibit 21: Historic Market Size – Geography Segment 2018 - 2022 ($ million)
    • 4.5 Country Segment Analysis 2018 - 2022
      • Exhibit 22: Historic Market Size – Country Segment 2018 - 2022 ($ million)

    5 Five Forces Analysis

    • 5.1 Five forces summary
      • Exhibit 23: Five forces analysis - Comparison between 2023 and 2028
    • 5.2 Bargaining power of buyers
      • Exhibit 24: Chart on Bargaining power of buyers – Impact of key factors 2023 and 2028
    • 5.3 Bargaining power of suppliers
      • Exhibit 25: Bargaining power of suppliers – Impact of key factors in 2023 and 2028
    • 5.4 Threat of new entrants
      • Exhibit 26: Threat of new entrants – Impact of key factors in 2023 and 2028
    • 5.5 Threat of substitutes
      • Exhibit 27: Threat of substitutes – Impact of key factors in 2023 and 2028
    • 5.6 Threat of rivalry
      • Exhibit 28: Threat of rivalry – Impact of key factors in 2023 and 2028
    • 5.7 Market condition
      • Exhibit 29: Chart on Market condition - Five forces 2023 and 2028

    6 Market Segmentation by End-user

    • 6.1 Market segments
      • Exhibit 30: Chart on End-user - Market share 2023-2028 (%)
      • Exhibit 31: Data Table on End-user - Market share 2023-2028 (%)
    • 6.2 Comparison by End-user
      • Exhibit 32: Chart on Comparison by End-user
      • Exhibit 33: Data Table on Comparison by End-user
    • 6.3 Government military and defense - Market size and forecast 2023-2028
      • Exhibit 34: Chart on Government military and defense - Market size and forecast 2023-2028 ($ million)
      • Exhibit 35: Data Table on Government military and defense - Market size and forecast 2023-2028 ($ million)
      • Exhibit 36: Chart on Government military and defense - Year-over-year growth 2023-2028 (%)
      • Exhibit 37: Data Table on Government military and defense - Year-over-year growth 2023-2028 (%)
    • 6.4 Aerospace - Market size and forecast 2023-2028
      • Exhibit 38: Chart on Aerospace - Market size and forecast 2023-2028 ($ million)
      • Exhibit 39: Data Table on Aerospace - Market size and forecast 2023-2028 ($ million)
      • Exhibit 40: Chart on Aerospace - Year-over-year growth 2023-2028 (%)
      • Exhibit 41: Data Table on Aerospace - Year-over-year growth 2023-2028 (%)
    • 6.5 Industrial and commercial - Market size and forecast 2023-2028
      • Exhibit 42: Chart on Industrial and commercial - Market size and forecast 2023-2028 ($ million)
      • Exhibit 43: Data Table on Industrial and commercial - Market size and forecast 2023-2028 ($ million)
      • Exhibit 44: Chart on Industrial and commercial - Year-over-year growth 2023-2028 (%)
      • Exhibit 45: Data Table on Industrial and commercial - Year-over-year growth 2023-2028 (%)
    • 6.6 Market opportunity by End-user
      • Exhibit 46: Market opportunity by End-user ($ million)
      • Exhibit 47: Data Table on Market opportunity by End-user ($ million)

    7 Market Segmentation by Product

    • 7.1 Market segments
      • Exhibit 48: Chart on Product - Market share 2023-2028 (%)
      • Exhibit 49: Data Table on Product - Market share 2023-2028 (%)
    • 7.2 Comparison by Product
      • Exhibit 50: Chart on Comparison by Product
      • Exhibit 51: Data Table on Comparison by Product
    • 7.3 Communication equipment - Market size and forecast 2023-2028
      • Exhibit 52: Chart on Communication equipment - Market size and forecast 2023-2028 ($ million)
      • Exhibit 53: Data Table on Communication equipment - Market size and forecast 2023-2028 ($ million)
      • Exhibit 54: Chart on Communication equipment - Year-over-year growth 2023-2028 (%)
      • Exhibit 55: Data Table on Communication equipment - Year-over-year growth 2023-2028 (%)
    • 7.4 Computer system - Market size and forecast 2023-2028
      • Exhibit 56: Chart on Computer system - Market size and forecast 2023-2028 ($ million)
      • Exhibit 57: Data Table on Computer system - Market size and forecast 2023-2028 ($ million)
      • Exhibit 58: Chart on Computer system - Year-over-year growth 2023-2028 (%)
      • Exhibit 59: Data Table on Computer system - Year-over-year growth 2023-2028 (%)
    • 7.5 Display - Market size and forecast 2023-2028
      • Exhibit 60: Chart on Display - Market size and forecast 2023-2028 ($ million)
      • Exhibit 61: Data Table on Display - Market size and forecast 2023-2028 ($ million)
      • Exhibit 62: Chart on Display - Year-over-year growth 2023-2028 (%)
      • Exhibit 63: Data Table on Display - Year-over-year growth 2023-2028 (%)
    • 7.6 Market opportunity by Product
      • Exhibit 64: Market opportunity by Product ($ million)
      • Exhibit 65: Data Table on Market opportunity by Product ($ million)

    8 Customer Landscape

    • 8.1 Customer landscape overview
      • Exhibit 66: Analysis of price sensitivity, lifecycle, customer purchase basket, adoption rates, and purchase criteria

    9 Geographic Landscape

    • 9.1 Geographic segmentation
      • Exhibit 67: Chart on Market share by geography 2023-2028 (%)
      • Exhibit 68: Data Table on Market share by geography 2023-2028 (%)
    • 9.2 Geographic comparison
      • Exhibit 69: Chart on Geographic comparison
      • Exhibit 70: Data Table on Geographic comparison
    • 9.3 North America - Market size and forecast 2023-2028
      • Exhibit 71: Chart on North America - Market size and forecast 2023-2028 ($ million)
      • Exhibit 72: Data Table on North America - Market size and forecast 2023-2028 ($ million)
      • Exhibit 73: Chart on North America - Year-over-year growth 2023-2028 (%)
      • Exhibit 74: Data Table on North America - Year-over-year growth 2023-2028 (%)
    • 9.4 Europe - Market size and forecast 2023-2028
      • Exhibit 75: Chart on Europe - Market size and forecast 2023-2028 ($ million)
      • Exhibit 76: Data Table on Europe - Market size and forecast 2023-2028 ($ million)
      • Exhibit 77: Chart on Europe - Year-over-year growth 2023-2028 (%)
      • Exhibit 78: Data Table on Europe - Year-over-year growth 2023-2028 (%)
    • 9.5 APAC - Market size and forecast 2023-2028
      • Exhibit 79: Chart on APAC - Market size and forecast 2023-2028 ($ million)
      • Exhibit 80: Data Table on APAC - Market size and forecast 2023-2028 ($ million)
      • Exhibit 81: Chart on APAC - Year-over-year growth 2023-2028 (%)
      • Exhibit 82: Data Table on APAC - Year-over-year growth 2023-2028 (%)
    • 9.6 South America - Market size and forecast 2023-2028
      • Exhibit 83: Chart on South America - Market size and forecast 2023-2028 ($ million)
      • Exhibit 84: Data Table on South America - Market size and forecast 2023-2028 ($ million)
      • Exhibit 85: Chart on South America - Year-over-year growth 2023-2028 (%)
      • Exhibit 86: Data Table on South America - Year-over-year growth 2023-2028 (%)
    • 9.7 Middle East and Africa - Market size and forecast 2023-2028
      • Exhibit 87: Chart on Middle East and Africa - Market size and forecast 2023-2028 ($ million)
      • Exhibit 88: Data Table on Middle East and Africa - Market size and forecast 2023-2028 ($ million)
      • Exhibit 89: Chart on Middle East and Africa - Year-over-year growth 2023-2028 (%)
      • Exhibit 90: Data Table on Middle East and Africa - Year-over-year growth 2023-2028 (%)
    • 9.8 US - Market size and forecast 2023-2028
      • Exhibit 91: Chart on US - Market size and forecast 2023-2028 ($ million)
      • Exhibit 92: Data Table on US - Market size and forecast 2023-2028 ($ million)
      • Exhibit 93: Chart on US - Year-over-year growth 2023-2028 (%)
      • Exhibit 94: Data Table on US - Year-over-year growth 2023-2028 (%)
    • 9.9 China - Market size and forecast 2023-2028
      • Exhibit 95: Chart on China - Market size and forecast 2023-2028 ($ million)
      • Exhibit 96: Data Table on China - Market size and forecast 2023-2028 ($ million)
      • Exhibit 97: Chart on China - Year-over-year growth 2023-2028 (%)
      • Exhibit 98: Data Table on China - Year-over-year growth 2023-2028 (%)
    • 9.10 Germany - Market size and forecast 2023-2028
      • Exhibit 99: Chart on Germany - Market size and forecast 2023-2028 ($ million)
      • Exhibit 100: Data Table on Germany - Market size and forecast 2023-2028 ($ million)
      • Exhibit 101: Chart on Germany - Year-over-year growth 2023-2028 (%)
      • Exhibit 102: Data Table on Germany - Year-over-year growth 2023-2028 (%)
    • 9.11 UK - Market size and forecast 2023-2028
      • Exhibit 103: Chart on UK - Market size and forecast 2023-2028 ($ million)
      • Exhibit 104: Data Table on UK - Market size and forecast 2023-2028 ($ million)
      • Exhibit 105: Chart on UK - Year-over-year growth 2023-2028 (%)
      • Exhibit 106: Data Table on UK - Year-over-year growth 2023-2028 (%)
    • 9.12 Canada - Market size and forecast 2023-2028
      • Exhibit 107: Chart on Canada - Market size and forecast 2023-2028 ($ million)
      • Exhibit 108: Data Table on Canada - Market size and forecast 2023-2028 ($ million)
      • Exhibit 109: Chart on Canada - Year-over-year growth 2023-2028 (%)
      • Exhibit 110: Data Table on Canada - Year-over-year growth 2023-2028 (%)
    • 9.13 Market opportunity by geography
      • Exhibit 111: Market opportunity by geography ($ million)
      • Exhibit 112: Data Tables on Market opportunity by geography ($ million)

    10 Drivers, Challenges, and Trends

    • 10.1 Market drivers
      • 10.2 Market challenges
        • 10.3 Impact of drivers and challenges
          • Exhibit 113: Impact of drivers and challenges in 2023 and 2028
        • 10.4 Market trends

          11 Vendor Landscape

          • 11.1 Overview
            • 11.2 Vendor landscape
              • Exhibit 114: Overview on Criticality of inputs and Factors of differentiation
            • 11.3 Landscape disruption
              • Exhibit 115: Overview on factors of disruption
            • 11.4 Industry risks
              • Exhibit 116: Impact of key risks on business

            12 Vendor Analysis

            • 12.1 Vendors covered
              • Exhibit 117: Vendors covered
            • 12.2 Market positioning of vendors
              • Exhibit 118: Matrix on vendor position and classification
            • 12.3 AMETEK Inc.
              • Exhibit 119: AMETEK Inc. - Overview
              • Exhibit 120: AMETEK Inc. - Business segments
              • Exhibit 121: AMETEK Inc. - Key offerings
              • Exhibit 122: AMETEK Inc. - Segment focus
            • 12.4 Curtiss Wright Corp.
              • Exhibit 123: Curtiss Wright Corp. - Overview
              • Exhibit 124: Curtiss Wright Corp. - Business segments
              • Exhibit 125: Curtiss Wright Corp. - Key news
              • Exhibit 126: Curtiss Wright Corp. - Key offerings
              • Exhibit 127: Curtiss Wright Corp. - Segment focus
            • 12.5 Ecrin Systems
              • Exhibit 128: Ecrin Systems - Overview
              • Exhibit 129: Ecrin Systems - Product / Service
              • Exhibit 130: Ecrin Systems - Key offerings
            • 12.6 Extreme Engineering Solutions Inc.
              • Exhibit 131: Extreme Engineering Solutions Inc. - Overview
              • Exhibit 132: Extreme Engineering Solutions Inc. - Product / Service
              • Exhibit 133: Extreme Engineering Solutions Inc. - Key offerings
            • 12.7 General Dynamics Corp.
              • Exhibit 134: General Dynamics Corp. - Overview
              • Exhibit 135: General Dynamics Corp. - Business segments
              • Exhibit 136: General Dynamics Corp. - Key news
              • Exhibit 137: General Dynamics Corp. - Key offerings
              • Exhibit 138: General Dynamics Corp. - Segment focus
            • 12.8 Getac Technology Corp.
              • Exhibit 139: Getac Technology Corp. - Overview
              • Exhibit 140: Getac Technology Corp. - Key offerings
            • 12.9 Honeywell International Inc.
              • Exhibit 141: Honeywell International Inc. - Overview
              • Exhibit 142: Honeywell International Inc. - Business segments
              • Exhibit 143: Honeywell International Inc. - Key news
              • Exhibit 144: Honeywell International Inc. - Key offerings
              • Exhibit 145: Honeywell International Inc. - Segment focus
            • 12.10 Kontron AG
              • Exhibit 146: Kontron AG - Overview
              • Exhibit 147: Kontron AG - Business segments
              • Exhibit 148: Kontron AG - Key offerings
              • Exhibit 149: Kontron AG - Segment focus
            • 12.11 L3Harris Technologies Inc.
              • Exhibit 150: L3Harris Technologies Inc. - Overview
              • Exhibit 151: L3Harris Technologies Inc. - Business segments
              • Exhibit 152: L3Harris Technologies Inc. - Key news
              • Exhibit 153: L3Harris Technologies Inc. - Key offerings
              • Exhibit 154: L3Harris Technologies Inc. - Segment focus
            • 12.12 Leonardo DRS Inc.
              • Exhibit 155: Leonardo DRS Inc. - Overview
              • Exhibit 156: Leonardo DRS Inc. - Product / Service
              • Exhibit 157: Leonardo DRS Inc. - Key offerings
            • 12.13 Raytheon Technologies Corp.
              • Exhibit 158: Raytheon Technologies Corp. - Overview
              • Exhibit 159: Raytheon Technologies Corp. - Business segments
              • Exhibit 160: Raytheon Technologies Corp. - Key news
              • Exhibit 161: Raytheon Technologies Corp. - Key offerings
              • Exhibit 162: Raytheon Technologies Corp. - Segment focus
            • 12.14 Siemens AG
              • Exhibit 163: Siemens AG - Overview
              • Exhibit 164: Siemens AG - Business segments
              • Exhibit 165: Siemens AG - Key news
              • Exhibit 166: Siemens AG - Key offerings
              • Exhibit 167: Siemens AG - Segment focus
            • 12.15 Sparton Rugged Electronics
              • Exhibit 168: Sparton Rugged Electronics - Overview
              • Exhibit 169: Sparton Rugged Electronics - Product / Service
              • Exhibit 170: Sparton Rugged Electronics - Key offerings
            • 12.16 Systel Inc.
              • Exhibit 171: Systel Inc. - Overview
              • Exhibit 172: Systel Inc. - Product / Service
              • Exhibit 173: Systel Inc. - Key offerings
            • 12.17 Trimble Inc.
              • Exhibit 174: Trimble Inc. - Overview
              • Exhibit 175: Trimble Inc. - Business segments
              • Exhibit 176: Trimble Inc. - Key offerings
              • Exhibit 177: Trimble Inc. - Segment focus

            13 Appendix

            • 13.1 Scope of the report
              • 13.2 Inclusions and exclusions checklist
                • Exhibit 178: Inclusions checklist
                • Exhibit 179: Exclusions checklist
              • 13.3 Currency conversion rates for US$
                • Exhibit 180: Currency conversion rates for US$
              • 13.4 Research methodology
                • Exhibit 181: Research methodology
                • Exhibit 182: Validation techniques employed for market sizing
                • Exhibit 183: Information sources
              • 13.5 List of abbreviations
                • Exhibit 184: List of abbreviations

              Research Methodology

              Technavio presents a detailed picture of the market by way of study, synthesis, and summation of data from multiple sources. The analysts have presented the various facets of the market with a particular focus on identifying the key industry influencers. The data thus presented is comprehensive, reliable, and the result of extensive research, both primary and secondary.

              INFORMATION SOURCES

              Primary sources

              • Manufacturers and suppliers
              • Channel partners
              • Industry experts
              • Strategic decision makers

              Secondary sources

              • Industry journals and periodicals
              • Government data
              • Financial reports of key industry players
              • Historical data
              • Press releases

              DATA ANALYSIS

              Data Synthesis

              • Collation of data
              • Estimation of key figures
              • Analysis of derived insights

              Data Validation

              • Triangulation with data models
              • Reference against proprietary databases
              • Corroboration with industry experts

              REPORT WRITING

              Qualitative

              • Market drivers
              • Market challenges
              • Market trends
              • Five forces analysis

              Quantitative

              • Market size and forecast
              • Market segmentation
              • Geographical insights
              • Competitive landscape

              Interested in this report?

              Get your sample now to see our research methodology and insights!

              Download Now

              Frequently Asked Questions

              Rugged Equipment market growth will increase by $ 13494.49 mn during 2024-2028 .

              The Rugged Equipment market is expected to grow at a CAGR of 5.93% during 2024-2028 .

              Rugged Equipment market is segmented by End-user( Government military and defense, Aerospace, Industrial and commercial) Product( Communication equipment, Computer system, Display)

              AMETEK Inc., Curtiss Wright Corp., Dell Technologies Inc., Ecrin Systems, Extreme Engineering Solutions Inc., General Dynamics Corp., Getac Technology Corp., Honeywell International Inc., Kontron AG, L3Harris Technologies Inc., Leonardo DRS Inc., Panasonic Holdings Corp., Raytheon Technologies Corp., Siemens AG, Trimble Inc., Zebra Technologies Corp., MilDef Group AB, Sparton Rugged Electronics, Systel Inc., Winmate Inc. are a few of the key vendors in the Rugged Equipment market.

              North America will register the highest growth rate of 35% among the other regions. Therefore, the Rugged Equipment market in North America is expected to garner significant business opportunities for the vendors during the forecast period.

              US, Canada, China, Germany, UK

              • Growth of industrial end-usersRugged equipment is finding its applications across several industries is the driving factor this market.
              • such as the oil and gas industry is the driving factor this market.
              • mining industry is the driving factor this market.
              • and aviation industry. The growth in these end-user industries will be a key driver of market growth. Vendors are developing rugged equipment that can withstand harsh environments is the driving factor this market.
              • including explosions is the driving factor this market.
              • which is a common phenomenon is the driving factor this market.
              • especially in the oil and gas industry and mining industry. The oil price dynamics continued to remain uncertain and volatile. The market witnessed a cyclic trend throughout the year. The oil and gas industry has clearly learned to live with the low-price environment is the driving factor this market.
              • which is now in recovery mode. With a tight capital spending program and a much strict cost discipline is the driving factor this market.
              • many companies are not just surviving but expanding production. With these signs of development is the driving factor this market.
              • the market for rugged equipment will witness increased applications in the oil and gas industry. Vendors such as Taiwan-based WinMate offer rugged displays specifically designed for operations in the oil and gas industries. The mining industry is another key end-user of rugged equipment. The growth in the industrial end-user industry will propel the demand for rugged equipment and is the driving factor this market.
              • in turn is the driving factor this market.
              • will drive the global rugged equipment market growth during the forecast period. is the driving factor this market.

              The Rugged Equipment market vendors should focus on grabbing business opportunities from the Government military and defense segment as it accounted for the largest market share in the base year.