Land Based Defense Equipment Market Size 2024-2028
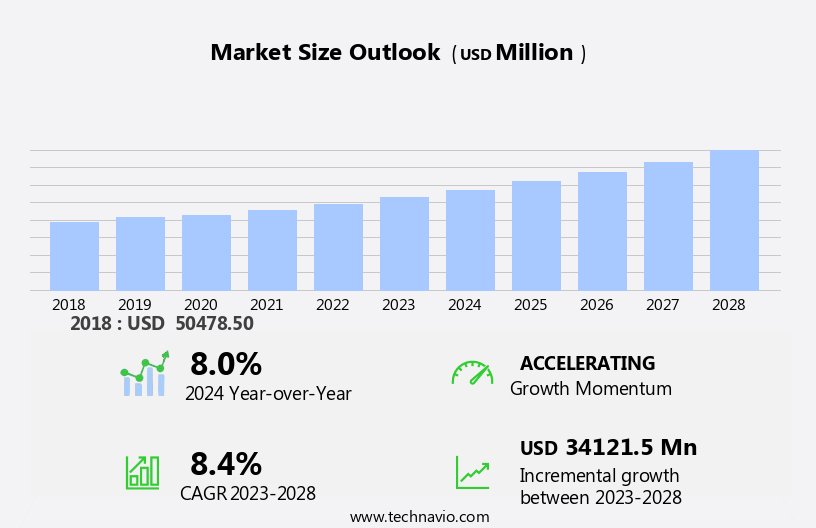
The land based defense equipment market size is forecast to increase by USD 34.12 billion at a CAGR of 8.4% between 2023 and 2028.
- The market is experiencing significant growth, driven by several key trends and challenges. One notable trend is the introduction of military hybrid vehicles, which offer enhanced capabilities and improved fuel efficiency. Another trend is the increasing adoption of robotic combat vehicles, which provide greater precision and reduced risk to human soldiers. However, the market also faces challenges, including the rising threat of cyber security on land-based defense systems, which can compromise critical data and operational capabilities. As the defense industry continues to evolve, staying abreast of these trends and addressing these challenges will be essential for market success. The market analysis report provides a comprehensive examination of these factors and more, offering valuable insights for industry stakeholders.
What will be the Size of the Land Based Defense Equipment Market During the Forecast Period?
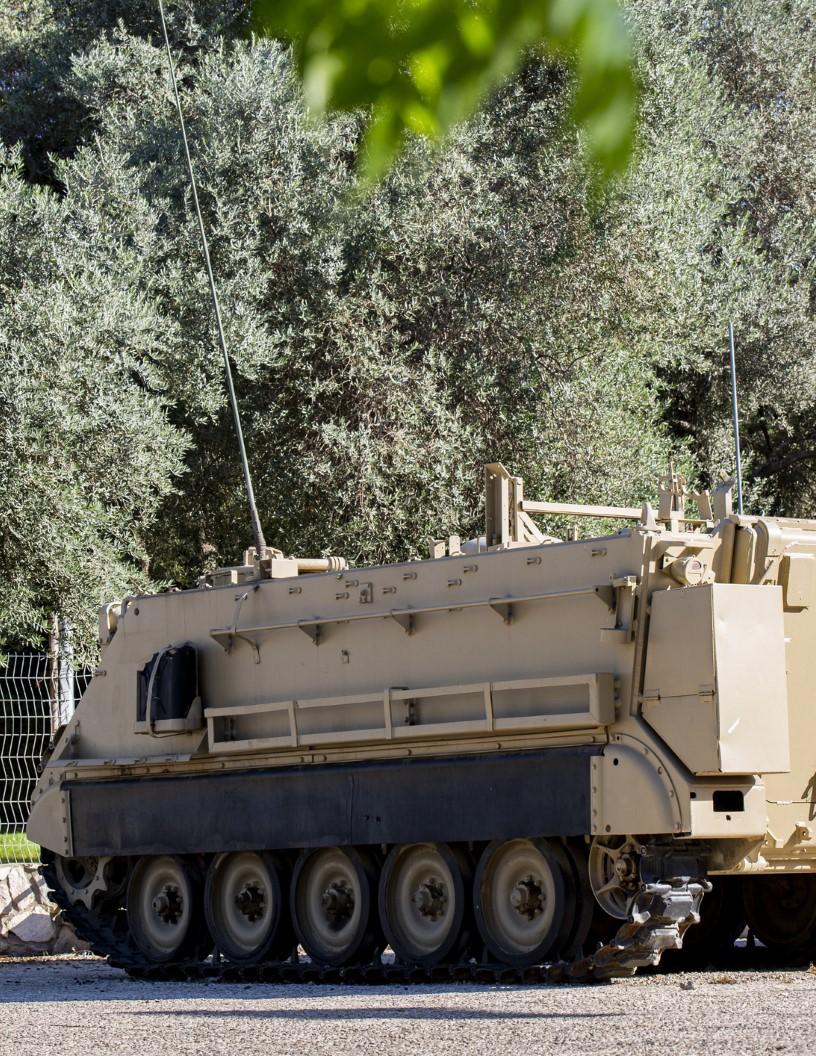
- The market encompasses a diverse range of military hardware, including support and auxiliary equipment, weapons systems, and armored fighting vehicles (AFVs). Key product categories include tanks, armored personnel carriers, artillery systems, missile defense systems, and small arms. Market dynamics are driven by geopolitical tensions and defense spending, leading to increased demand for advanced sensors, mobility, network-centric warfare, and alternative fuel sources. Autonomous equipment and unmanned systems are emerging trends, as military applications of artificial intelligence and robotics gain traction. Weapons systems continue to evolve, with a focus on non-gun powder and precision-guided munitions. Missile defense systems remain a critical area of investment, as nations seek to protect against emerging threats. Overall, the land-based defense equipment market is characterized by continuous innovation and technological advancements.
How is this Land Based Defense Equipment Industry segmented and which is the largest segment?
The land based defense equipment industry research report provides comprehensive data (region-wise segment analysis), with forecasts and estimates in "USD million" for the period 2024-2028, as well as historical data from 2018-2022 for the following segments.
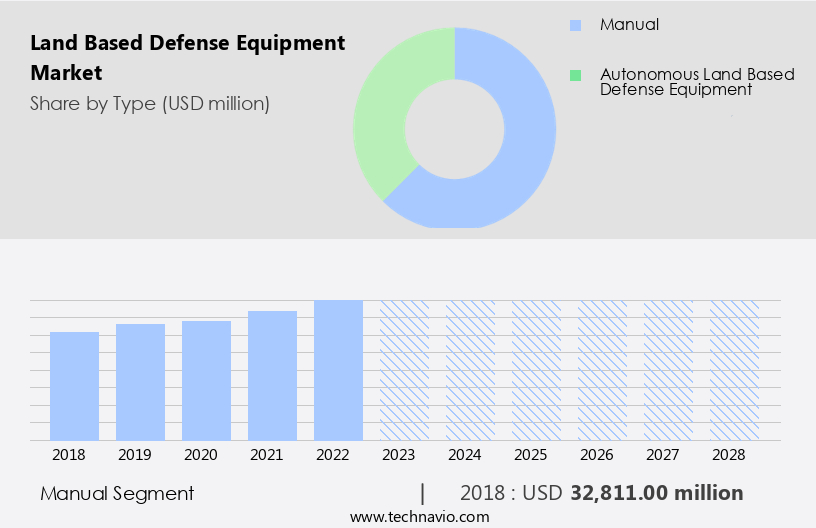
- Type
- Manual
- Autonomous land based defense equipment
- Geography
- North America
- US
- APAC
- China
- India
- Japan
- South Korea
- Europe
- Germany
- UK
- France
- Middle East and Africa
- South America
- North America
By Type Insights
- The manual segment is estimated to witness significant growth during the forecast period.
The market encompasses a range of military hardware, including guns, non-gun powder weapons, artillery systems, missile defense systems, and armored vehicles. Manual systems, such as armored vehicles, continue to hold significance due to their versatility in tactical and logistical applications. In September 2023, the Nigerian Army integrated Tares armored vehicles into their operations, acquired from ERAF Industrial Company in Saudi Arabia. The Tares 4 by 4, powered by a 6.7-liter V8 turbodiesel engine, offers strong and reliable performance in diverse environments with a horsepower output of 330 at 2,600 rpm. This equipment plays a crucial role in military defense strategies, addressing geopolitical tensions and ensuring national security.
Get a glance at the Land Based Defense Equipment Industry report of share of various segments Request Free Sample
The manual segment was valued at USD 32.81 billion in 2018 and showed a gradual increase during the forecast period.
Regional Analysis
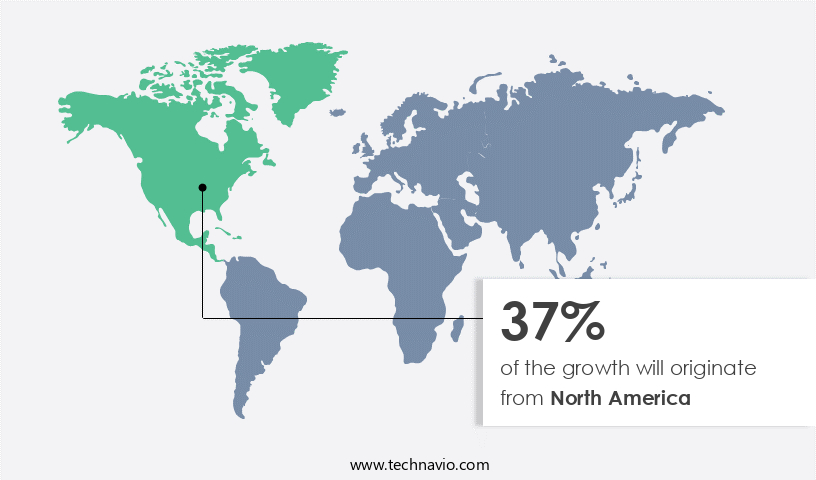
- North America is estimated to contribute 37% to the growth of the global market during the forecast period.
Technavio's analysts have elaborately explained the regional trends and drivers that shape the market during the forecast period.
For more insights on the market share of various regions, Request Free Sample
The North American market is driven by substantial defense budgets and modernization initiatives. The U.S. Department of Defense has allocated USD 849.8 billion for fiscal year 2025, demonstrating a commitment to enhancing military capabilities. Notably, this follows the Fiscal 2023 National Defense Authorization Act, which allocated USD 816.7 billion. A significant modernization effort In the U.S. Army involves replacing the ICVD Stryker Dragoon 8x8 armored vehicles with the new ICVVA1-30mm variant. This shift underscores the strategic importance of defense spending, with applications including counterterrorism capabilities and peacekeeping operations. Land-based defense equipment, including armored personnel carriers (APCs), main battle tanks (MBTs), infantry fighting vehicles (IFVs), and mine-resistant ambush-protected vehicles (MRAPs), play a crucial role In these efforts.
Market Dynamics
Our land based defense equipment market researchers analyzed the data with 2023 as the base year, along with the key drivers, trends, and challenges. A holistic analysis of drivers will help companies refine their marketing strategies to gain a competitive advantage.
What are the key market drivers leading to the rise In the adoption of Land Based Defense Equipment Industry?
The introduction of hybrid military vehicles is the key driver of the market.
- The market is experiencing significant growth due to escalating geopolitical tensions and the need for advanced military capabilities. Defense spending is on the rise in major markets, including the United States and India, with the US Department of Defense requesting a budget of USD 849.8 billion for fiscal year 2024. This allocation supports various military applications, including combat vehicles, combat support vehicles, and border security solutions. Advanced technologies such as autonomous equipment, artificial intelligence, unmanned systems, and robotics are increasingly integrated into land-based defense equipment. These technologies enhance mobility, network-centric warfare, and cybersecurity capabilities. Additionally, alternative fuel sources and electrification are gaining traction In the market.
- Armored vehicles, including armored fighting vehicles (AFVs), armored personnel carriers (APCs), and main battle tanks (MBTs), continue to dominate the market. Weapons, such as guns, non-gun powder weapons, and missiles, remain essential components of land-based defense equipment. Support tools and auxiliary tools, including turrets, armor packages, and active protection systems, are also in high demand. The market is driven by the need for advanced capabilities in combat vehicles, counterterrorism capabilities, and peacekeeping operations. Surface-to-surface missiles, surface-to-air missiles, and anti-tank guided missiles are critical components of land-based defense equipment. Radars, satellites, sonars, and other advanced sensors are also integral to the market.
What are the market trends shaping the Land Based Defense Equipment Industry?
The adoption of robotic combat vehicles is the upcoming market trend.
- The market is experiencing a notable evolution, with a growing emphasis on autonomous technology and support for versatile, efficient, and reliable military solutions. In 2023, General Dynamics Land Systems (GDLS) showcased this trend with the delivery of two prototype robotic combat vehicles (RCVs) to the U.S. Army. The TRX (Tracked Robot 10-ton), one of GDLS's offerings, exemplifies the future of RCVs, boasting superior transportability, growth potential, and a 1:1 payload-to-chassis ratio. This vehicle is designed to seamlessly integrate with various military formations, offering advanced capabilities for combat vehicles, combat support vehicles, and border security solutions. The market for land-based defense equipment is influenced by military budgets, geopolitical tensions, and the global security environment.
- Advanced sensors, artificial intelligence, unmanned systems, and alternative fuel sources are increasingly integrated into military hardware, including armored vehicles, artillery systems, missile defense systems, and infantry fighting vehicles. Armored personnel carriers (APCs), main battle tanks (MBTs), and mine-resistant ambush-protected vehicles (MRAPs) are also being enhanced with armor packages, active protection systems, and autonomous operations. The need for counterterrorism capabilities, peacekeeping operations, and border security solutions is driving the demand for advanced weaponry, such as surface-to-surface missiles, surface-to-air missiles, and anti-tank guided missiles. Support tools and auxiliary tools, including guns, non-gun powder weapons, and turrets, are also essential components of land-based defense equipment.
What challenges does the Land Based Defense Equipment Industry face during its growth?
Cyber attacks on land based defense systems is a key challenge affecting the industry growth.
- The market encompasses a range of support and auxiliary equipment, weapons, armored vehicles, and combat vehicles. This includes armored fighting vehicles (AFVs), autonomous equipment, and military applications of guns, non-gun powder weapons, and military hardware. The market is influenced by geopolitical tensions and defense spending, with a focus on advanced sensors, mobility, network-centric warfare, alternative fuel sources, and electrification. Cybersecurity is a significant challenge, as demonstrated by the 2024 attack on Diehl Defence, which involved sophisticated hacking tactics and compromised sensitive information.
- Other key areas of investment include border security solutions, counterterrorism capabilities, peacekeeping operations, and armored personnel carriers (APCs), main battle tanks (MBTs), infantry fighting vehicles (IFVs), mine-resistant ambush-protected vehicles, surface-to-surface missiles, surface-to-air missiles, and anti-tank guided missiles. Support tools and auxiliary tools are also crucial, as are weaponry, turrets, armor packages, and active protection systems. Autonomous operations and manually operated equipment are becoming increasingly important, with a growing focus on unmanned systems, robotics, corner shot rifles, and battle vehicles. Radars, satellites, and sonars are essential components of defense systems, as are defense budgets and military applications of artificial intelligence and unmanned aerial vehicles.
Exclusive Customer Landscape
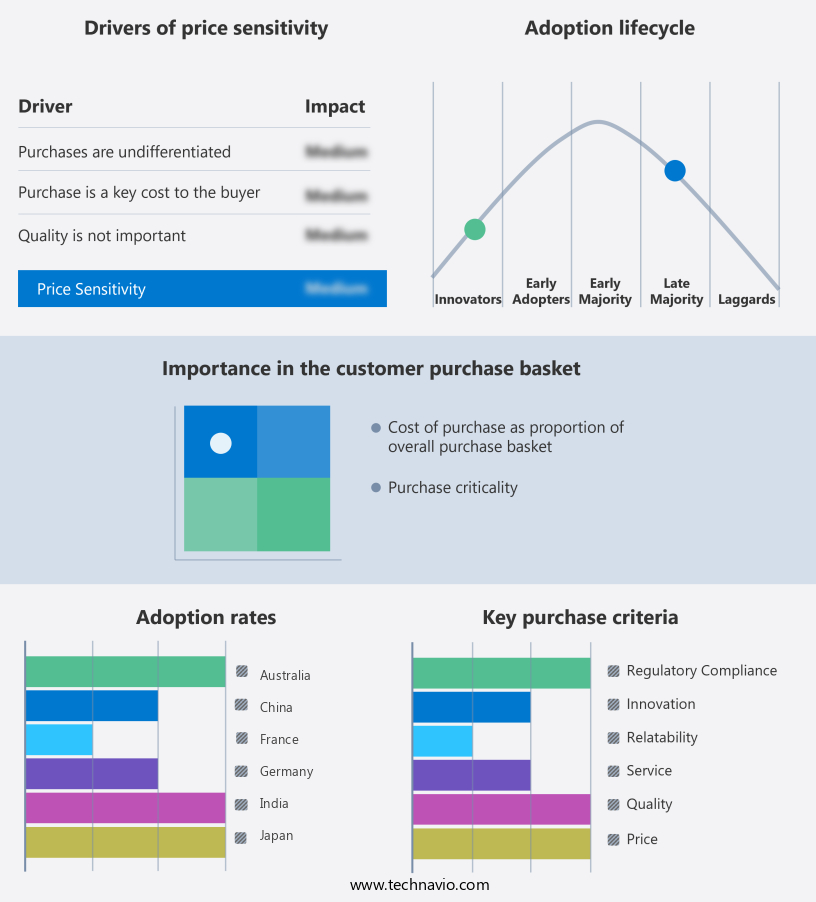
The land based defense equipment market forecasting report includes the adoption lifecycle of the market, covering from the innovator's stage to the laggard's stage. It focuses on adoption rates in different regions based on penetration. Furthermore, the land based defense equipment market report also includes key purchase criteria and drivers of price sensitivity to help companies evaluate and develop their market growth analysis strategies.
Customer Landscape
Key Companies & Market Insights
Companies are implementing various strategies, such as strategic alliances, land based defense equipment market forecast, partnerships, mergers and acquisitions, geographical expansion, and product/service launches, to enhance their presence In the industry.
The industry research and growth report includes detailed analyses of the competitive landscape of the market and information about key companies, including:
- BAE Systems Plc
- Elbit Systems Ltd.
- FNSS Savunma Sistemleri A.S.
- General Dynamics Corp.
- Hanwha Systems Co. Ltd.
- HYUNDAI ROTEM CO
- JSC Rosoboronexport.
- KNDS N.V.
- Leonardo Spa
- Lockheed Martin Corp.
- Mitsubishi Heavy Industries Ltd
- Northrop Grumman Corp.
- Paramount Group
- Patria Group
- Rheinmetall AG
- RTX Corp.
- Saab AB
- Tata Advanced Systems Ltd.
- Thales Group
- The Boeing Co.
Qualitative and quantitative analysis of companies has been conducted to help clients understand the wider business environment as well as the strengths and weaknesses of key industry players. Data is qualitatively analyzed to categorize companies as pure play, category-focused, industry-focused, and diversified; it is quantitatively analyzed to categorize companies as dominant, leading, strong, tentative, and weak.
Research Analyst Overview
Land-based defense equipment plays a crucial role in ensuring the security and protection of nations against various threats. This market encompasses a wide range of support and auxiliary equipment, designed to enhance the capabilities of combat vehicles and weapons systems. The demand for land-based defense equipment is driven by several factors. Geopolitical tensions and the evolving global security environment continue to fuel military budgets, leading to increased investments in new technologies and equipment. Combat vehicles, such as armored fighting vehicles (AFVs), armored personnel carriers (APCs), and main battle tanks (MBTs), are essential components of any modern military force. Advancements in technology have led to the development of autonomous equipment, including unmanned systems and robots, which are increasingly being integrated into military applications.
Further, artificial intelligence (AI) and network-centric warfare have become critical components of modern defense strategies, enabling real-time data analysis and decision-making. Mobility and alternative fuel sources are also key considerations In the land-based defense equipment market. Electric propulsion systems and advanced sensors have become increasingly popular, as they offer improved efficiency and reduced environmental impact. Border security solutions and counterterrorism capabilities are other important applications for land-based defense equipment. Advanced sensors, such as radars, satellites, and sonars, are used to detect and respond to threats, while cybersecurity measures are implemented to protect against cyber attacks. Military budgets continue to be a significant driver of demand for land-based defense equipment.
|
Land Based Defense Equipment Market Scope |
|
|
Report Coverage |
Details |
|
Page number |
215 |
|
Base year |
2023 |
|
Historic period |
2018-2022 |
|
Forecast period |
2024-2028 |
|
Growth momentum & CAGR |
Accelerate at a CAGR of 8.4% |
|
Market growth 2024-2028 |
USD 34.12 billion |
|
Market structure |
Fragmented |
|
YoY growth 2023-2024(%) |
8.0 |
|
Key countries |
US, China, Russia, India, France, Germany, UK, Japan, South Korea, and Australia |
|
Competitive landscape |
Leading Companies, Market Positioning of Companies, Competitive Strategies, and Industry Risks |
What are the Key Data Covered in this Land Based Defense Equipment Market Research and Growth Report?
- CAGR of the Land Based Defense Equipment industry during the forecast period
- Detailed information on factors that will drive the Land Based Defense Equipment Market growth and forecasting between 2024 and 2028
- Precise estimation of the size of the market and its contribution of the industry in focus to the parent market
- Accurate predictions about upcoming growth and trends and changes in consumer behaviour
- Growth of the market across North America, APAC, Europe, Middle East and Africa, and South America
- Thorough analysis of the market's competitive landscape and detailed information about companies
- Comprehensive analysis of factors that will challenge the land based defense equipment market growth of industry companies
We can help! Our analysts can customize this land based defense equipment market research report to meet your requirements.
 RIA -
RIA - 
