Rugged Servers Market Size 2024-2028
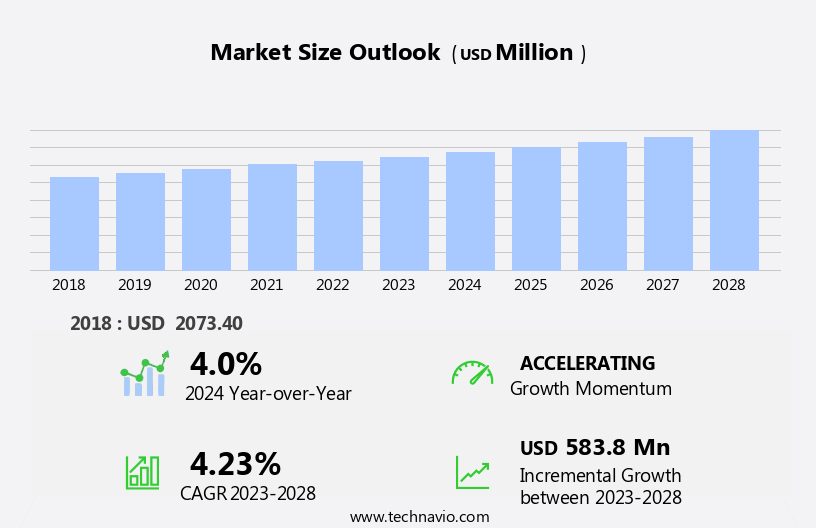
The rugged servers market size is forecast to increase by USD 583.8 million, at a CAGR of 4.23% between 2023 and 2028.
- The market is experiencing significant growth, driven by the increasing adoption of cloud applications in various industries. This trend is particularly noticeable in sectors such as telecommunications, energy, and transportation, where rugged servers are essential for ensuring uninterrupted operations in harsh environments. Another key driver is the emergence of containerized data centers, which require rugged servers to operate effectively in outdoor conditions. However, the market also faces challenges. The high cost of procurement is a significant obstacle for many organizations, particularly those in the public sector or small and medium-sized enterprises (SMEs). Additionally, the complexity of deploying and managing rugged servers in remote locations can be a challenge, requiring specialized expertise and resources.
- Despite these challenges, the market's potential is significant, with opportunities for companies to capitalize on the growing demand for rugged servers in various industries. To succeed, businesses must focus on providing cost-effective solutions that address the unique challenges of deploying and managing rugged servers in harsh environments. By doing so, they can help organizations overcome the barriers to adoption and capture a share of this growing market.
What will be the Size of the Rugged Servers Market during the forecast period?
Explore in-depth regional segment analysis with market size data - historical 2018-2022 and forecasts 2024-2028 - in the full report.
Request Free Sample
The market continues to evolve, driven by the increasing demand for reliable and high-performance computing solutions across various sectors. Big data applications, high-availability clusters, network-attached storage (NAS), and x86 architecture are integral components of this dynamic landscape. Remote management, solid-state drives (SSDs), security hardening, and tower servers are also key elements, ensuring business continuity and optimal performance. DevOps practices and compliance regulations have further shaped market activities, with an emphasis on automation, fault tolerance, and energy efficiency. High-performance computing (HPC), machine learning (ML), and data center infrastructure have emerged as significant areas of focus. Edge computing and cloud-native applications have also gained traction, necessitating robust thermal management and network connectivity.
Redundant power supplies, application software, and database management systems are essential components, ensuring seamless operation and data security. Disaster recovery solutions and monitoring and logging are critical for maintaining business continuity and ensuring regulatory compliance. The market's continuous unfolding is further characterized by the integration of advanced technologies, such as AI and ML, into server designs. Multi-core processors and ARM architecture are also gaining popularity, offering improved performance and energy efficiency. In summary, the market is a dynamic and evolving landscape, with ongoing activities shaping the market's direction and patterns. The integration of various technologies and components, such as RAID configurations, rack-mount servers, and compliance regulations, is essential for meeting the diverse needs of businesses and industries.
How is this Rugged Servers Industry segmented?
The rugged servers industry research report provides comprehensive data (region-wise segment analysis), with forecasts and estimates in "USD million" for the period 2024-2028, as well as historical data from 2018-2022 for the following segments.
- End-user
- MDA
- Enterprise
- Type
- Dedicated
- Standard
- Geography
- North America
- US
- Europe
- Germany
- APAC
- China
- Rest of World (ROW)
- North America
.
By End-user Insights
The MDA segment is estimated to witness significant growth during the forecast period.
The market is primarily driven by military and defense applications, with global military expenditure being a significant factor. Countries allocate substantial budgets for defense and military sectors to procure technology that ensures combat force connectivity. For instance, the US dedicates over half of its annual budget to these sectors. Technological advancements are also fueling market growth, enabling the modernization of military rugged computer systems and enhancing security measures. In the defense sector, rugged servers are essential for high-performance computing (HPC), data analytics, and big data processing. These servers are designed to withstand harsh environments and offer features such as redundant power supplies, thermal management, and disaster recovery solutions.
Rack-mount and blade servers are popular choices due to their compact size and high-density capabilities. Artificial intelligence (AI) and machine learning (ML) are increasingly being integrated into rugged servers for applications such as threat detection and predictive maintenance. DevOps practices, automated provisioning, and multi-core processors further optimize server performance. Compliance regulations, data security, and energy efficiency are crucial considerations for military applications, making rugged servers an attractive investment. The market for rugged servers is also witnessing trends such as cloud-native applications, server virtualization, and edge computing. Database management systems and network connectivity are essential components of rugged servers, ensuring seamless data access and transfer.
In the financial services sector, rugged servers offer high availability clusters and fault tolerance, making them an ideal solution for mission-critical applications. In conclusion, the market is experiencing growth due to increasing military budgets and technological advancements. These servers cater to the unique requirements of defense applications, offering features such as high-performance computing, data security, and energy efficiency. The integration of AI, ML, and DevOps practices further enhances the capabilities of rugged servers, making them an indispensable component of modern military technology infrastructure.
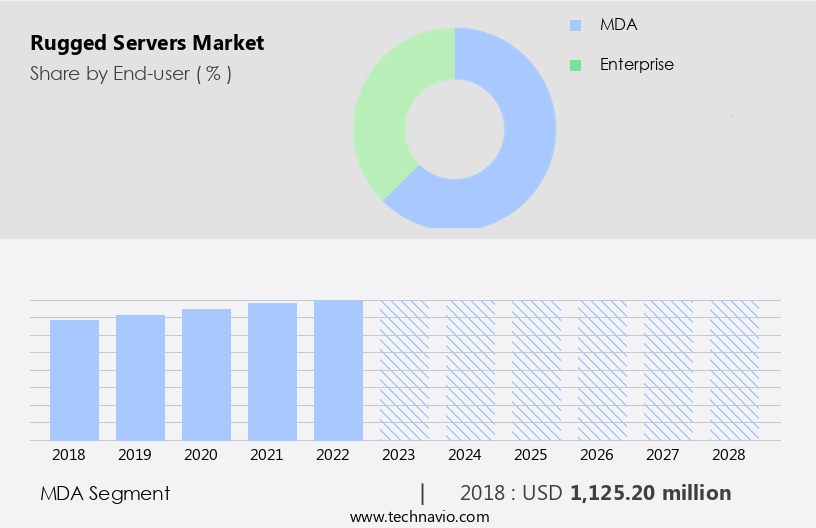
The MDA segment was valued at USD 1125.20 million in 2018 and showed a gradual increase during the forecast period.
Regional Analysis
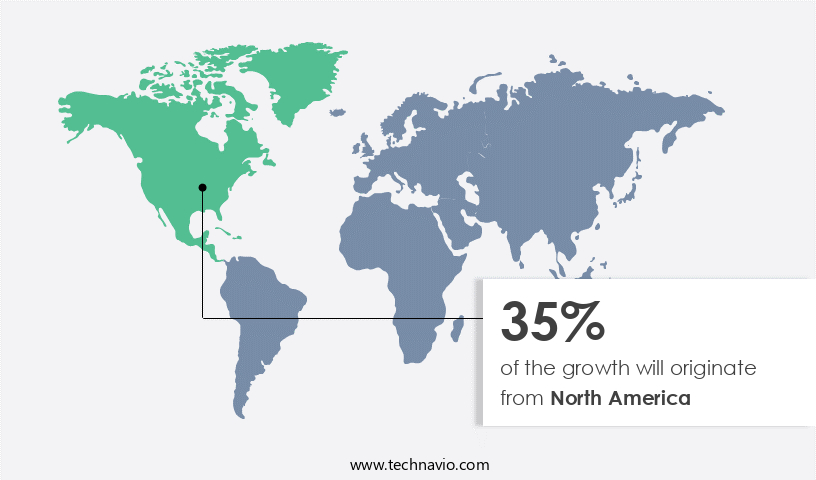
North America is estimated to contribute 35% to the growth of the global market during the forecast period. Technavio's analysts have elaborately explained the regional trends and drivers that shape the market during the forecast period.
The market in the US is experiencing significant growth, driven by increasing demand from the military and defense sector. This sector's spending on equipment, including servers, is linked to defense budgets, which are anticipated to rise during the forecast period. The US government has announced plans to increase spending on the air force and navy, leading to a surge in demand for rugged servers to support operational assets. Rugged servers are essential for military applications due to their ability to withstand harsh environments and provide high-performance computing capabilities. These servers are designed with features such as RAID configurations, redundant power supplies, and thermal management to ensure high availability and reliability.
Moreover, the integration of advanced technologies such as artificial intelligence (AI), machine learning (ML), and data analytics into military applications is driving the demand for rugged servers with high-performance capabilities. These servers are also required to support big data and high-performance computing (HPC) applications, which are becoming increasingly important in the defense sector. Furthermore, the adoption of DevOps practices, automated provisioning, and server virtualization in the military and defense sector is also contributing to the growth of the market. Compliance regulations and data security concerns are also driving the demand for rugged servers, which are designed with security hardening features and network connectivity options.
In conclusion, the market in the US is expected to grow significantly due to the increasing demand from the military and defense sector. The market is driven by factors such as rising defense budgets, the integration of advanced technologies, and the adoption of DevOps practices and server virtualization. Rugged servers are essential for military applications due to their ability to provide high-performance computing capabilities in harsh environments while ensuring data security and compliance.
Market Dynamics
Our researchers analyzed the data with 2023 as the base year, along with the key drivers, trends, and challenges. A holistic analysis of drivers will help companies refine their marketing strategies to gain a competitive advantage.
What are the key market drivers leading to the rise in the adoption of Rugged Servers Industry?
- The significant growth in the usage of cloud applications is the primary catalyst fueling market expansion.
- The market has been influenced by the rise of cloud computing and data center expansion, particularly in cold climatic zones. Cloud storage services, provided by tech giants such as Facebook, Google, and Amazon, have disrupted the traditional server market. These companies offer centralized computation through their data centers, leading to an increase in their number. In response, enterprises are increasingly investing in data centers located in cold regions to reduce the power consumption of cooling units. This trend is expected to positively impact the market, as these servers are specifically designed to operate in extreme temperatures.
- The development of cloud computing platforms has been a significant factor driving the growth of data centers, and the demand for rugged servers is expected to follow suit.
What are the market trends shaping the Rugged Servers Industry?
- Containerized data centers are gaining increasing popularity in the market due to their numerous advantages, such as ease of deployment, scalability, and cost efficiency. The emergence of this trend signifies a significant shift towards more flexible and agile IT infrastructure solutions.
- Containerized rugged servers, a type of portable data center solution, are gaining traction in the business world due to their flexibility and scalability. These data centers, housed in standard shipping containers, incorporate essential components such as raid configurations, rack-mount servers, disaster recovery solutions, blade servers, monitoring and logging, redundant power supplies, application software, thermal management, and artificial intelligence. The integration of these features ensures uninterrupted operations and high data security. Containerized data centers offer several advantages, including easy deployment, quick setup, and seamless integration with existing data center networks. They are particularly useful in remote locations or during temporary data center capacity needs.
- Moreover, the standardized components enable easy maintenance and upgrades. The adoption of containerized rugged servers is driven by the increasing demand for high-performance computing, data security, and disaster recovery solutions. The flexibility and scalability of these data centers make them an attractive option for businesses seeking to optimize their IT infrastructure while minimizing costs. Additionally, the integration of AI and advanced monitoring and logging systems further enhances the value proposition of containerized rugged servers.
What challenges does the Rugged Servers Industry face during its growth?
- The high cost of procurement poses a significant challenge to the industry's growth trajectory. In order to remain competitive and profitable, businesses must carefully manage their procurement expenses, negotiating favorable terms with suppliers and implementing cost-saving strategies. Effective supply chain management and leveraging technology to streamline procurement processes can also help mitigate this challenge.
- Rugged servers, built with x86 architecture, offer superior reliability and durability compared to commercial servers. Although the initial procurement cost is higher, the total cost of ownership (TCO) is lower in the long run. High-availability clusters, network-attached storage (NAS), and solid-state drives (SSDs) are essential features of rugged servers, making them ideal for handling big data and DevOps practices. Security hardening is another crucial factor that sets rugged servers apart. Remote management capabilities enable administrators to monitor and maintain these servers from a distance, ensuring business continuity. Rugged servers are designed to withstand harsh environments, making them suitable for industries such as telecommunications, energy, and transportation.
- Consumer-grade products may appear to be a more cost-effective option initially, but their TCO can be significantly higher. In contrast, rugged servers, while more expensive upfront, offer better performance, reliability, and security, making them a wise investment for businesses. Tower servers with rugged designs provide the necessary computing power while ensuring data integrity and availability, making them an essential component of modern IT infrastructure.
Exclusive Customer Landscape
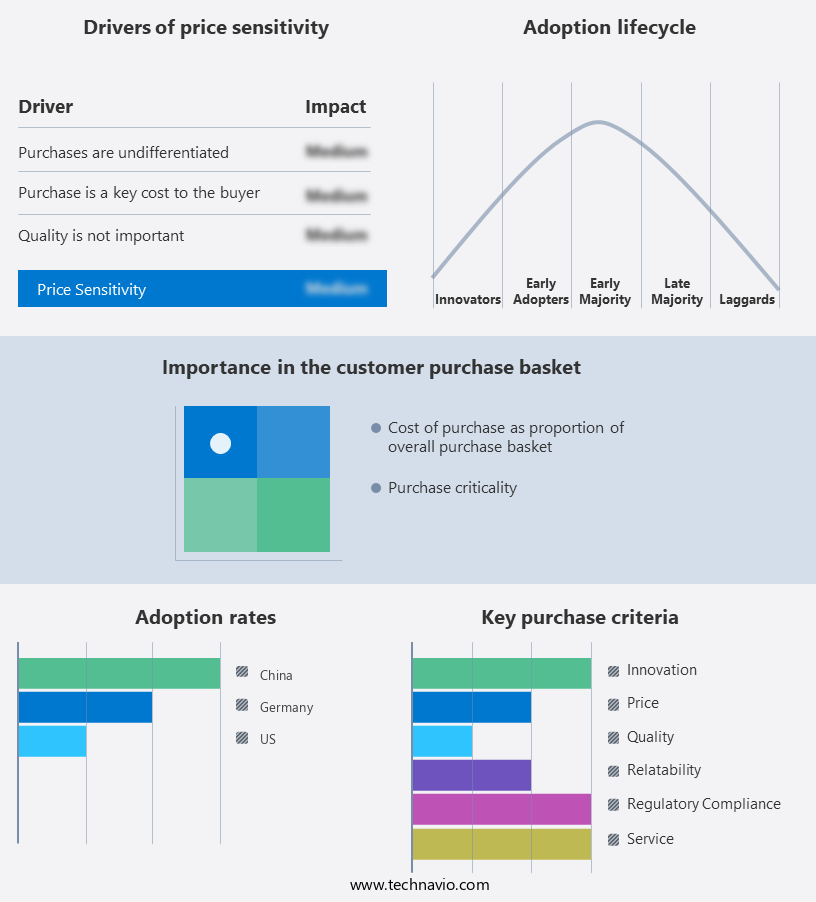
The rugged servers market forecasting report includes the adoption lifecycle of the market, covering from the innovator's stage to the laggard's stage. It focuses on adoption rates in different regions based on penetration. Furthermore, the rugged servers market report also includes key purchase criteria and drivers of price sensitivity to help companies evaluate and develop their market growth analysis strategies.
Customer Landscape
Key Companies & Market Insights
Companies are implementing various strategies, such as strategic alliances, rugged servers market forecast, partnerships, mergers and acquisitions, geographical expansion, and product/service launches, to enhance their presence in the industry.
Advantech Co. Ltd. - This company specializes in rugged servers, engineered to meet stringent military and industrial standards for enhanced compatibility, robust security, and unwavering reliability.
The industry research and growth report includes detailed analyses of the competitive landscape of the market and information about key companies, including:
- Advantech Co. Ltd.
- Core Systems
- Corvalent Corp.
- CP Technologies LLC
- CRI
- Crystal Group Inc.
- Dell Technologies Inc.
- E and M Computing Ltd.
- Extreme Engineering Solutions Inc.
- Hewlett Packard Enterprise Co
- International Business Machines Corp.
- Mercury Systems Inc.
- Sparton Corp.
- Systel Inc.
- Technology Advancement Group
- TPG Group Plc
- Trenton Systems Inc.
- Zmicro
Qualitative and quantitative analysis of companies has been conducted to help clients understand the wider business environment as well as the strengths and weaknesses of key industry players. Data is qualitatively analyzed to categorize companies as pure play, category-focused, industry-focused, and diversified; it is quantitatively analyzed to categorize companies as dominant, leading, strong, tentative, and weak.
Recent Development and News in Rugged Servers Market
- In March 2023, Dell Technologies introduced its new PowerEdge C4140 and C4145 rugged servers, designed for edge and telecommunications applications. These servers offer enhanced security features, improved thermal management, and increased processing power to better support 5G and IoT deployments (Dell Technologies Press Release).
- In July 2024, Schneider Electric and IBM announced a strategic collaboration to integrate Schneider Electric's EcoStruxure IT platform with IBM's Power Systems for edge computing. This partnership aims to simplify IT management and improve energy efficiency in edge data centers (IBM Press Release).
- In October 2024, Hewlett Packard Enterprise (HPE) completed the acquisition of Membrain Technologies, a leader in liquid cooling technology for edge computing. This acquisition will enable HPE to offer more efficient cooling solutions for rugged servers, reducing the need for large air conditioning systems (HPE Press Release).
- In January 2025, NVIDIA launched the Jetson AGX Xavier HPC module, a ruggedized, AI-powered edge computing platform. This module features a 512-core NVIDIA Volta GPU and is designed for autonomous machines, robotics, and edge data centers (NVIDIA Press Release).
- These developments demonstrate significant advancements in rugged servers, including enhanced security, improved energy efficiency, increased processing power, and innovative cooling solutions. Companies are focusing on edge computing applications, such as 5G and IoT deployments, and collaborating to simplify IT management and offer more efficient solutions.
Research Analyst Overview
- The market is experiencing significant growth, driven by the increasing demand for real-time data processing and computer vision applications in industries such as manufacturing, transportation, and energy. Deep learning algorithms and virtualization software are key technologies fueling this trend, enabling the deployment of advanced analytics and AI workloads in harsh environments. Data encryption and failover mechanisms ensure data security and high availability, while cloud computing platforms like Microsoft Azure offer scalability and flexibility. Open source technologies, such as software-defined networking (SDN) and cloud orchestration, are also gaining traction, enabling more efficient management of cloud resources. Serverless computing, server clustering, and edge analytics are other emerging trends, enabling real-time data processing at the edge and reducing latency.
- Data mining and predictive analytics are essential tools for gaining insights from large datasets, while data warehousing and load balancing ensure data accessibility and reliability. Cloud migration and redundant network interfaces are crucial for ensuring business continuity and disaster recovery. Network virtualization and cloud management are essential for optimizing resource utilization and ensuring seamless integration with existing IT infrastructure.
Dive into Technavio's robust research methodology, blending expert interviews, extensive data synthesis, and validated models for unparalleled Rugged Servers Market insights. See full methodology.
|
Market Scope |
|
|
Report Coverage |
Details |
|
Page number |
162 |
|
Base year |
2023 |
|
Historic period |
2018-2022 |
|
Forecast period |
2024-2028 |
|
Growth momentum & CAGR |
Accelerate at a CAGR of 4.23% |
|
Market growth 2024-2028 |
USD 583.8 million |
|
Market structure |
Fragmented |
|
YoY growth 2023-2024(%) |
4.0 |
|
Key countries |
US, China, and Germany |
|
Competitive landscape |
Leading Companies, Market Positioning of Companies, Competitive Strategies, and Industry Risks |
What are the Key Data Covered in this Rugged Servers Market Research and Growth Report?
- CAGR of the Rugged Servers industry during the forecast period
- Detailed information on factors that will drive the growth and forecasting between 2024 and 2028
- Precise estimation of the size of the market and its contribution of the industry in focus to the parent market
- Accurate predictions about upcoming growth and trends and changes in consumer behaviour
- Growth of the market across North America, APAC, Europe, Middle East and Africa, and South America
- Thorough analysis of the market's competitive landscape and detailed information about companies
- Comprehensive analysis of factors that will challenge the rugged servers market growth of industry companies
We can help! Our analysts can customize this rugged servers market research report to meet your requirements.
 RIA -
RIA - 
