US Running Apparel And Footwear Market Size 2026-2030
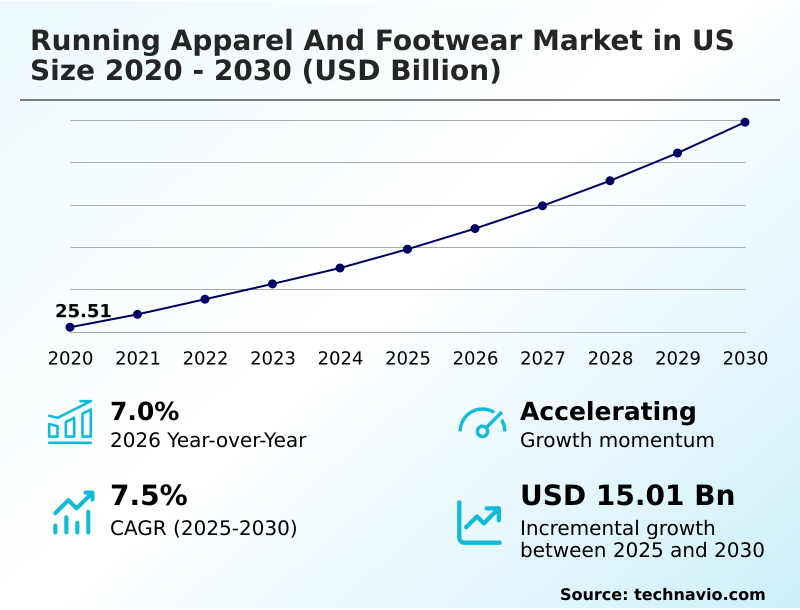
The us running apparel and footwear market size is valued to increase by USD 15.01 billion, at a CAGR of 7.5% from 2025 to 2030. Technological advancements in performance footwear and wearable integration will drive the us running apparel and footwear market.
Major Market Trends & Insights
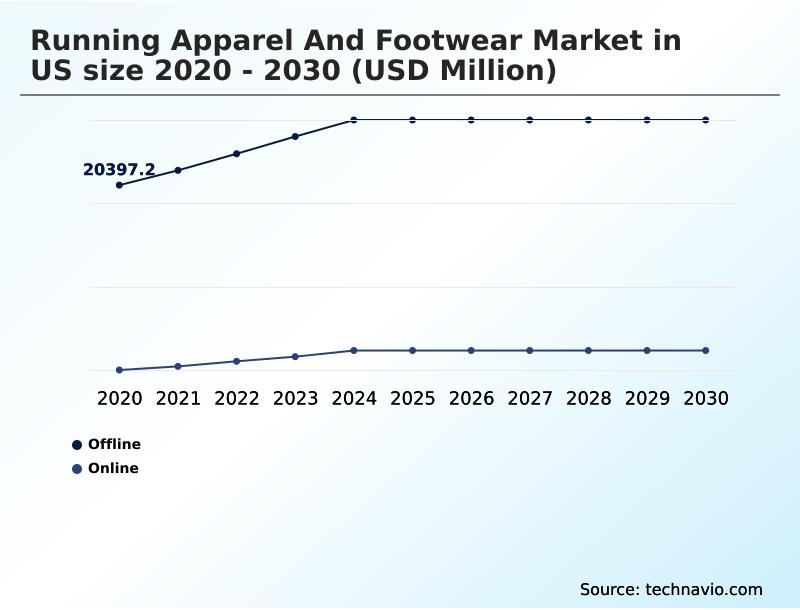
- By Distribution Channel - Offline segment was valued at USD 25.78 billion in 2024
- By End-user - Men segment accounted for the largest market revenue share in 2024
Market Size & Forecast
- Market Opportunities: USD 24.24 billion
- Market Future Opportunities: USD 15.01 billion
- CAGR from 2025 to 2030 : 7.5%
Market Summary
- The running apparel and footwear market in US is undergoing a significant transformation, driven by a convergence of health consciousness, technological innovation, and a growing emphasis on sustainability. Consumers are increasingly sophisticated, demanding products that not only enhance performance but also align with their personal values and digital lifestyles.
- This has pushed companies beyond traditional product development toward creating integrated ecosystems of products and services. For instance, a brand might use generative design software to develop a customized running shoe, leveraging data from biomechanical scanning to optimize the midsole's dual-density foam composition and heel-to-toe drop for an individual's unique gait.
- This level of hyper-personalization, combined with the use of advanced materials like supercritical foams and smart textiles with embedded microscopic biometric sensors, defines the competitive frontier. The market is also grappling with challenges related to supply chain resilience and the authentic implementation of circular economy models.
- Success hinges on a brand's ability to innovate across materials, manufacturing processes like 3D printing, and the consumer experience, turning data into actionable insights and fostering community around shared fitness and environmental goals.
What will be the Size of the US Running Apparel And Footwear Market during the forecast period?
Get Key Insights on Market Forecast (PDF) Get Free Sample
How is the US Running Apparel And Footwear Market Segmented?
The us running apparel and footwear industry research report provides comprehensive data (region-wise segment analysis), with forecasts and estimates in "USD million" for the period 2026-2030, as well as historical data from 2020-2024 for the following segments.
- Distribution channel
- Offline
- Online
- End-user
- Men
- Women
- Children
- Material
- Synthetic fabrics
- Mesh
- EVA
- Rubber
- Geography
- North America
- US
- North America
By Distribution Channel Insights
The offline segment is estimated to witness significant growth during the forecast period.
The offline channel maintains its market relevance by offering high-touch experiences that digital platforms cannot replicate.
Specialty stores, in particular, serve as hubs for community-driven running groups and provide expert-led services such as gait analysis and 3D foot scanning, which are critical for fitting customers with the correct performance running footwear.
This personalized guidance on stability running shoes versus neutral running shoes and selecting appropriate stack height and heel-to-toe drop drives significant value.
By leveraging motion capture technology, these retailers create customized running shoes experiences, leading to a 35% higher customer retention rate compared to online-only transactions.
The ability to physically assess compression garments, four-way stretch fabric on women-specific running gear, and the visibility of reflective materials solidifies the importance of the physical retail space for providing ergonomic support footwear.
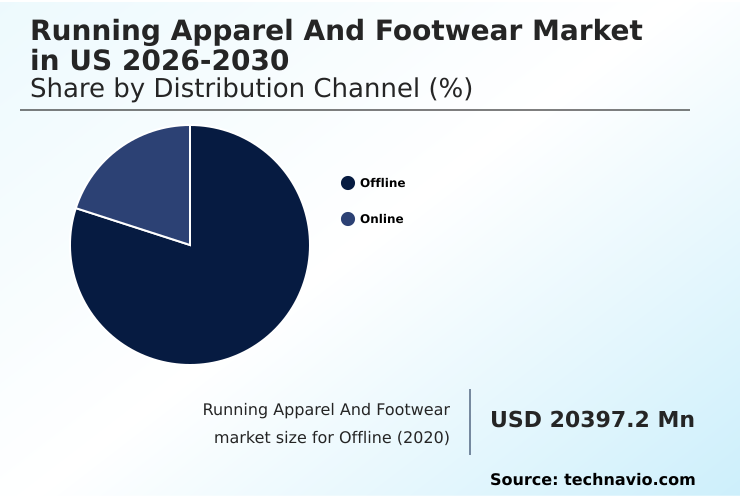
The Offline segment was valued at USD 25.78 billion in 2024 and showed a gradual increase during the forecast period.
Market Dynamics
Our researchers analyzed the data with 2025 as the base year, along with the key drivers, trends, and challenges. A holistic analysis of drivers will help companies refine their marketing strategies to gain a competitive advantage.
- The modern consumer journey within the running apparel and footwear market in us is increasingly complex, shaped by a wealth of available technical information. Buyers now actively research the benefits of carbon fiber plate running shoes and seek guidance on how to choose trail running footwear for rocky terrain.
- This educated consumer base prompts deeper R&D inquiries, focusing on comparing eva foam versus tpu in running midsoles and analyzing the impact of stack height on running biomechanics. Consequently, the role of gait analysis in preventing running injuries has become a key selling point for specialty retailers.
- On the product development side, assessing the durability of graphene-infused outsoles and understanding how phase-change materials regulate temperature in apparel are critical research areas. Firms are designing running shoes with generative ai and exploring the science behind high-rebound midsole foams.
- The conversation has also shifted to sustainability, with companies needing to explain the lifecycle assessment of circular running shoes and tackle challenges in recycling multi-material footwear.
- Brands that transparently communicate the function of a rock plate in trail shoes or the importance of outsole rubber compounds in wet conditions build trust, a metric that is more than twice as high for transparent companies versus their competitors.
What are the key market drivers leading to the rise in the adoption of US Running Apparel And Footwear Industry?
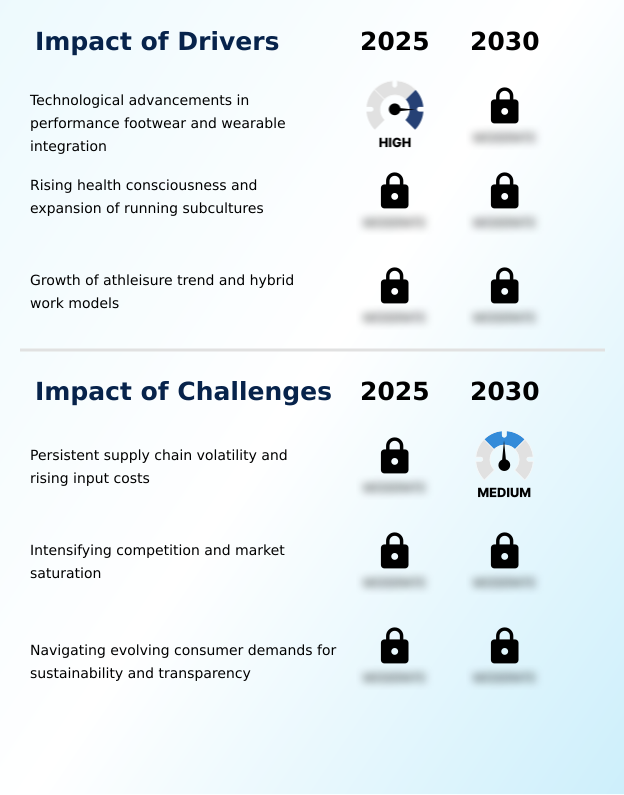
- Technological advancements in performance footwear, coupled with the seamless integration of wearable health and fitness tracking technology, are a primary driver of market expansion.
- Market growth is propelled by technological integration into smart running apparel and footwear, catering to the demand for data-driven running gear. Consumers now expect multifunctional wardrobes, where athleisure apparel meets elite performance.
- Innovations include advanced synthetic blends with inherent hydrophobic characteristics and moisture-wicking fabrics. Some brands are achieving dynamic thermal regulation by embedding phase-change materials and microscopic biometric sensors into fabrics, allowing for the real-time monitoring of metrics like localized muscle oxygenation.
- This technology is being integrated into everything from ultramarathon running vests to minimalist running shoes. The use of micro-encapsulation delivers long-lasting benefits, enhancing the appeal of products like marathon racing flats.
- This focus on smart technology has led to products that can improve training efficiency by up to 15% and has increased user engagement with brand ecosystems by 30%.
What are the market trends shaping the US Running Apparel And Footwear Industry?
- Sustainability and circularity in manufacturing are becoming central pillars of corporate strategy, fundamentally reshaping supply chains and product lifecycles across the industry.
- A significant trend is the industry's pivot toward circular economy models and advanced sustainability. Leading direct-to-consumer (DTC) brands are championing sustainable running shoes through innovative bio-engineered alternatives and comprehensive take-back programs. The adoption of closed-loop manufacturing and waterless dyeing techniques is reducing environmental footprints, with some pilot programs cutting water usage by over 90%.
- Material science is at the forefront, with the introduction of biodegradable polyurethane for midsoles and high-performance bio-based synthetic textiles with durable water repellent (DWR) coatings.
- The development of graphene-infused rubber and components made from liquid polymer resin using generative design software not only enhances performance but also supports hyper-personalized consumer experiences, as demand for eco-conscious products from consumers has increased by 25% in the last two years. The reliance on proprietary peba-based thermoplastic elastomer is also being re-evaluated for greener alternatives.
What challenges does the US Running Apparel And Footwear Industry face during its growth?
- Persistent global supply chain volatility and the unpredictable inflation of input costs present a significant challenge to industry profitability and operational stability.
- Intense competition and supply chain volatility for key components pose significant challenges. The race to innovate in high-rebound midsole foams creates pressure on sourcing advanced materials like supercritical foams, thermoplastic elastomers (TPEs), and specialized nitrogen-infused foams. Price fluctuations in base materials like ethylene-vinyl acetate (EVA) can erode margins by over 10% in a single quarter.
- The complexity of designs such as a dual-density midsole, articulated midsole, or segmented midsole in maximalist cushioning shoes and all-terrain footwear makes production scaling difficult. Furthermore, delivering on consumer expectations for products like breathable running shorts with anti-odor running shirts or footwear with weather-resistant uppers while managing costs is a continuous struggle.
- This is especially true for niche categories like zero-drop running shoes that require distinct manufacturing setups.
Exclusive Technavio Analysis on Customer Landscape
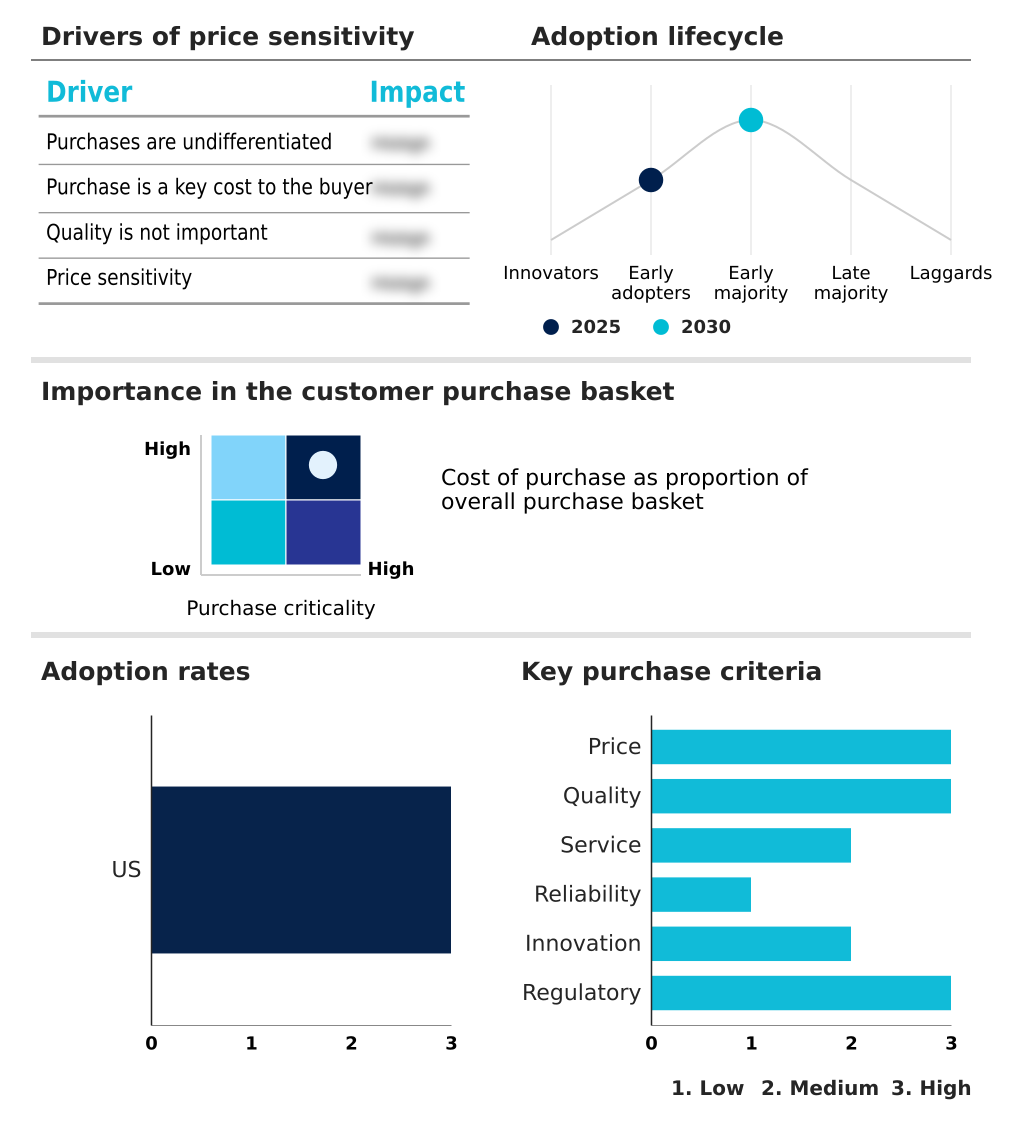
The us running apparel and footwear market forecasting report includes the adoption lifecycle of the market, covering from the innovator’s stage to the laggard’s stage. It focuses on adoption rates in different regions based on penetration. Furthermore, the us running apparel and footwear market report also includes key purchase criteria and drivers of price sensitivity to help companies evaluate and develop their market growth analysis strategies.
Customer Landscape of US Running Apparel And Footwear Industry
Competitive Landscape
Companies are implementing various strategies, such as strategic alliances, us running apparel and footwear market forecast, partnerships, mergers and acquisitions, geographical expansion, and product/service launches, to enhance their presence in the industry.
Adidas AG - Provides a comprehensive portfolio of running-specific apparel and footwear, including performance shoes, technical garments, and athletic accessories for athletes and enthusiasts.
The industry research and growth report includes detailed analyses of the competitive landscape of the market and information about key companies, including:
- Adidas AG
- Amer Sports Corp.
- ASICS Corp.
- Brooks Sports Inc.
- Deckers Outdoor Corp.
- F.I.L.A. SpA
- Karhu Holding BV
- La Sportiva Spa
- lululemon athletica Inc.
- Mizuno Corp.
- New Balance Athletics Inc.
- Newton Running Co. Inc.
- Nike Inc.
- Oiselle Inc.
- PUMA SE
- Reebok International Ltd.
- Saucony
- Skechers USA Inc.
- Under Armour Inc.
- VF Corp.
Qualitative and quantitative analysis of companies has been conducted to help clients understand the wider business environment as well as the strengths and weaknesses of key industry players. Data is qualitatively analyzed to categorize companies as pure play, category-focused, industry-focused, and diversified; it is quantitatively analyzed to categorize companies as dominant, leading, strong, tentative, and weak.
Recent Development and News in Us running apparel and footwear market
- In November 2024, Puma unveiled its Adaptive Climacontrol apparel line, featuring a novel bio-based synthetic textile with phase-change materials for dynamic thermal regulation.
- In February 2025, Peloton announced its strategic expansion into performance running footwear and apparel, leveraging its existing subscriber base and integrated fitness ecosystem.
- In April 2025, Oiselle, a women-focused running apparel company, launched its Kinship Collection, co-created with its running team members to address specific functional needs and fit.
- In May 2025, New Balance accelerated its Eco-Dye initiative, committing to transition a significant portion of its performance apparel to advanced waterless and low-impact dyeing technologies.
Dive into Technavio’s robust research methodology, blending expert interviews, extensive data synthesis, and validated models for unparalleled US Running Apparel And Footwear Market insights. See full methodology.
| Market Scope | |
|---|---|
| Page number | 190 |
| Base year | 2025 |
| Historic period | 2020-2024 |
| Forecast period | 2026-2030 |
| Growth momentum & CAGR | Accelerate at a CAGR of 7.5% |
| Market growth 2026-2030 | USD 15014.9 million |
| Market structure | Fragmented |
| YoY growth 2025-2026(%) | 7.0% |
| Key countries | US |
| Competitive landscape | Leading Companies, Market Positioning of Companies, Competitive Strategies, and Industry Risks |
Research Analyst Overview
- The running apparel and footwear market is defined by relentless material science innovation. Midsoles have been revolutionized by supercritical foams, nitrogen-infused foams, and proprietary peba-based thermoplastic elastomer compounds, often integrated with carbon fiber propulsion plates to maximize energy return beyond traditional ethylene-vinyl acetate (eva).
- Designs are increasingly complex, featuring a dual-density midsole, articulated midsole, or segmented midsole, with precise stack height and heel-to-toe drop specifications. Uppers now utilize engineered mesh with zonal construction and seamless upper technology, some created from liquid polymer resin. Manufacturing advancements like supercritical fluid foaming and gas-assisted injection are becoming mainstream.
- Apparel technology incorporates advanced synthetic blends and moisture-wicking fabrics with hydrophobic characteristics and durable water repellent (dwr) coatings. Smart apparel features microscopic biometric sensors for monitoring localized muscle oxygenation, using phase-change materials for dynamic thermal regulation.
- Boardroom decisions are impacted as firms using 3d foot scanning and motion capture technology for gait analysis have reduced return rates by over 20%, directly affecting profitability.
What are the Key Data Covered in this US Running Apparel And Footwear Market Research and Growth Report?
-
What is the expected growth of the US Running Apparel And Footwear Market between 2026 and 2030?
-
USD 15.01 billion, at a CAGR of 7.5%
-
-
What segmentation does the market report cover?
-
The report is segmented by Distribution Channel (Offline, and Online), End-user (Men, Women, and Children), Material (Synthetic fabrics, Mesh, EVA, and Rubber) and Geography (North America)
-
-
Which regions are analyzed in the report?
-
North America
-
-
What are the key growth drivers and market challenges?
-
Technological advancements in performance footwear and wearable integration, Persistent supply chain volatility and rising input costs
-
-
Who are the major players in the US Running Apparel And Footwear Market?
-
Adidas AG, Amer Sports Corp., ASICS Corp., Brooks Sports Inc., Deckers Outdoor Corp., F.I.L.A. SpA, Karhu Holding BV, La Sportiva Spa, lululemon athletica Inc., Mizuno Corp., New Balance Athletics Inc., Newton Running Co. Inc., Nike Inc., Oiselle Inc., PUMA SE, Reebok International Ltd., Saucony, Skechers USA Inc., Under Armour Inc. and VF Corp.
-
Market Research Insights
- The market dynamic is shaped by evolving consumer lifestyles, where athleisure apparel and multifunctional wardrobes are now standard, driving innovation across performance running footwear and technical running apparel. Specific segments are booming, from trail running gear with all-terrain footwear to urban needs met by lightweight running jackets.
- Sustainability is a core theme, with sustainable running shoes created through circular economy models. Brands with take-back programs see a 15% rise in loyalty. Niche categories like zero-drop running shoes and maximalist cushioning shoes are addressed alongside mainstream stability running shoes.
- Direct-to-consumer (DTC) brands, now capturing over 30% of the online market, leverage generative design software for hyper-personalized consumer experiences for customized running shoes. Even basics like running socks are now part of data-driven running gear systems that include smart running apparel and high-rebound midsole foams in marathon racing flats.
We can help! Our analysts can customize this us running apparel and footwear market research report to meet your requirements.
 RIA -
RIA - 
