Safes And Vaults In Non-Banking Market Analysis, Size, and Forecast 2025-2029: North America (US and Canada), Europe (France, Germany, Italy, and UK), APAC (China, India, and Japan), South America (Brazil), and Rest of World (ROW)

Safes And Vaults In Non-Banking Market Analysis, Size, and Forecast 2025-2029:
North America (US and Canada), Europe (France, Germany, Italy, and UK), APAC (China, India, and Japan), South America (Brazil), and Rest of World (ROW)

Published: May 2025 205 Pages SKU: IRTNTR77094

Market Overview at a Glance

$1.91 B
Market Opportunity
8.4%
CAGR
7.8
YoY growth 2024-2025(%)

Safes And Vaults In Non-Banking Market Size 2025-2029

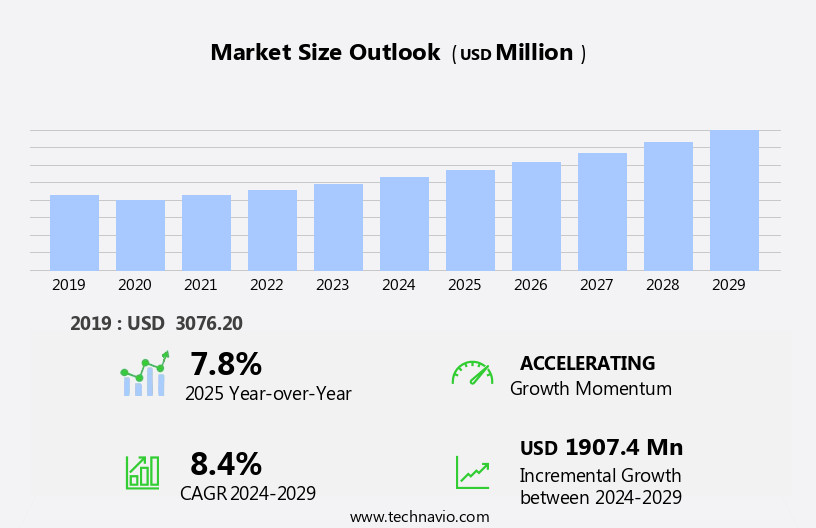
The safes and vaults in non-banking market size is forecast to increase by USD 1.91 billion, at a CAGR of 8.4% between 2024 and 2029.

  • The non-banking safes and vaults market is driven by the rising crime rate and growing concerns about safety. With increasing instances of burglary and theft, there is a heightened demand for secure storage solutions. This trend is further fueled by technological advancements in safes and vaults, which offer enhanced security features such as biometric access, remote monitoring, and digital locks. However, the market faces challenges in the form of stringent regulations and industry standards regarding safety. Compliance with these regulations can be costly and time-consuming, posing a significant obstacle for market entrants.
  • Additionally, maintaining the highest safety standards is crucial to retain customer trust and loyalty. Companies seeking to capitalize on market opportunities must stay abreast of the latest technological advancements while navigating regulatory requirements effectively. By focusing on innovation and compliance, market participants can differentiate themselves and meet the evolving needs of security-conscious consumers.

What will be the Size of the Safes And Vaults In Non-Banking Market during the forecast period?

Safes And Vaults In Non-Banking Market Size

 Request Free Sample

The non-banking market for security hardware is a continuously evolving landscape, encompassing various sectors and applications. From government security to tenant security, fireproof safes find a place in real estate and inventory management. Security training and consulting services are integral to ensuring the effectiveness of security systems, which incorporate RFID technology, vault doors, and high-security safes. Fire protection systems, including pressure sensors and fire suppression systems, safeguard valuables in residential homes and commercial establishments. In the realm of data security, data encryption and biometric authentication secure sensitive information. Electronic safes and safe auditing services ensure compliance with industry standards and insurance requirements.

Pharmaceutical security, jewellery security, and data centers necessitate reinforced concrete vault construction and temperature sensors. Property owners and real estate agents rely on access control systems, alarm monitoring, and security personnel for building security. Time-delay safes and safe transportation services offer additional layers of protection for valuable assets. Perimeter security measures, such as security cameras and motion sensors, complement security software and access control systems. The integration of security hardware and software in retail and residential security, banking security, and building security is a seamless process. Lock mechanisms, security assessments, and asset protection services ensure the ongoing security of valuables and data.

Security awareness and disaster recovery plans are essential components of effective risk management strategies. The non-banking market for security hardware is a dynamic and interconnected ecosystem, with ongoing market activities unfolding across various sectors. The evolving patterns in security hardware and software reflect the ever-changing needs of businesses and individuals in protecting their assets and data.

How is this Safes And Vaults In Non-Banking Industry segmented?

The safes and vaults in non-banking industry research report provides comprehensive data (region-wise segment analysis), with forecasts and estimates in "USD million" for the period 2025-2029, as well as historical data from 2019-2023 for the following segments.

  • Type
    • Cash management safes
    • Depository safes
    • Others
  • End-user
    • Commercial
    • Residential
  • Material
    • Metal safes and vaults 
    • Concrete vaults
    • Composite materials
  • Geography
    • North America
      • US
      • Canada
    • Europe
      • France
      • Germany
      • Italy
      • UK
    • APAC
      • China
      • India
      • Japan
    • South America
      • Brazil
    • Rest of World (ROW)

    By Type Insights

    The cash management safes segment is estimated to witness significant growth during the forecast period.

    The non-banking safes and vaults market encompasses various entities, including security hardware, real estate, government security, tenant security, fireproof safes, security training, security consulting, security systems, rfid technology, vault doors, high-security safes, fire protection, pressure sensors, security lighting, residential homes, inventory management, cctv systems, data encryption, biometric authentication, electronic safes, safe auditing, pharmaceutical security, steel plate, remote monitoring, valuables storage, home safes, lock rekeying, key management systems, property owners, data security, safe deposit boxes, loss prevention, emergency response, security audits, jewellery security, reinforced concrete, vault construction, data centers, temperature sensors, compliance standards, property management, safe installation, time-delay safes, insurance requirements, access control systems, real estate agents, access control, security awareness, depository safes, private security, alarm monitoring, gun safes, disaster recovery, risk management, biometric safes, safe transportation, document storage, perimeter security, key duplication, commercial safes, motion sensors, security personnel, data backup, physical security, retail security, door sensors, residential security, security software, burglar alarm, combination safes, safe maintenance, security cameras, banking security, building security, lock mechanisms, security assessments, asset protection, art security, fire suppression systems, safe repair, and key-lock safes, intrusion detection systems.

    Within this market, cash management safes are a crucial segment, catering to the needs of businesses in retail, hospitality, and transportation sectors, where large cash transactions are common. Cash management safes offer advanced features, such as secure locking mechanisms, integrated cash management systems, and sophisticated tracking technologies, ensuring accountable cash handling practices. These safes prioritize protection from theft, tampering, and unauthorized access, providing businesses with a dependable solution for managing their cash holdings efficiently. In the context of non-banking sectors, cash management safes significantly contribute to maintaining the security and integrity of cash handling processes. The integration of advanced features, such as rfid technology, biometric authentication, and remote monitoring, further enhances the security and efficiency of cash management operations.

    As the market evolves, the focus on data security, compliance standards, and risk management continues to grow, driving the demand for advanced safes and vaults with integrated security systems and features.

    Safes And Vaults In Non-Banking Market Size

    Request Free Sample

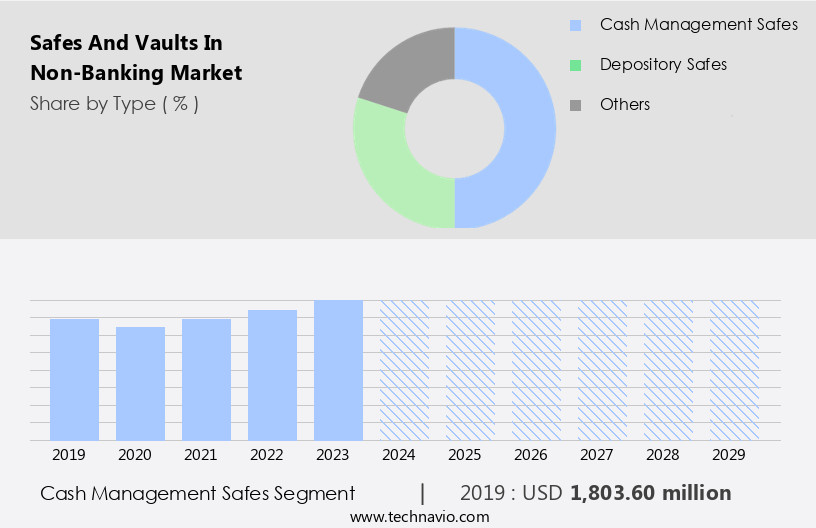
    The Cash management safes segment was valued at USD 1.8 billion in 2019 and showed a gradual increase during the forecast period.

    Regional Analysis

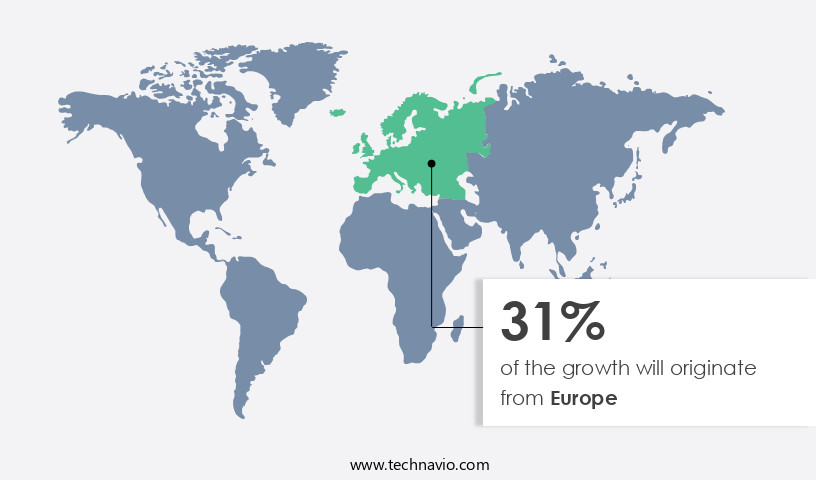
    Europe is estimated to contribute 31% to the growth of the global market during the forecast period.Technavio’s analysts have elaborately explained the regional trends and drivers that shape the market during the forecast period.

    Safes And Vaults In Non-Banking Market Share by Geography

     Request Free Sample

    The non-banking safes and vaults market in North America has experienced consistent expansion, serving commercial, retail, hospitality, healthcare, and residential sectors with secure storage solutions for valuable assets. In February 2024, Convergint unveiled DEA-compliant vault systems and cages for healthcare facilities, combining engineering, manufacturing, and installation to adhere to DEA standards for Schedule I-V materials. These systems offer modular vault technology and seamless integration with building management systems, increasing adoption among healthcare institutions. Security remains a top priority, fueling the demand for safes and vaults in non-banking sectors. RFID technology, biometric authentication, access control systems, and remote monitoring are among the advanced security features integrated into these solutions.

    Fire protection, pressure sensors, and security lighting ensure the safety of assets in case of emergencies. Real estate agents and property owners increasingly turn to security consulting and training to enhance property management and loss prevention. Data security is another significant concern, with data encryption, CCTV systems, and intrusion detection systems becoming essential components of safes and vaults. Pharmaceutical security, inventory management, and jewellery security are specialized applications catered to by high-security safes and vaults. Reinforced concrete, vault construction, and temperature sensors contribute to the robustness and reliability of these storage solutions. Compliance standards, such as those for data centers, drive the adoption of advanced security systems, including fire suppression systems and access control systems.

    Property management companies and businesses invest in safe installation, maintenance, and auditing to ensure the ongoing security of their assets. Time-delay safes, insurance requirements, and access control systems further enhance the market's growth. In summary, the non-banking safes and vaults market in North America is thriving, driven by the need for advanced security features, regulatory compliance, and the protection of valuable assets across various industries.

    Market Dynamics

    Our researchers analyzed the data with 2024 as the base year, along with the key drivers, trends, and challenges. A holistic analysis of drivers will help companies refine their marketing strategies to gain a competitive advantage.

    What are the key market drivers leading to the rise in the adoption of Safes And Vaults In Non-Banking Industry?

    • The rising crime rate and growing concerns about safety are the primary factors fueling market demand. 

    • In today's world, the escalating crime rate has heightened the need for robust security solutions in various industries, particularly those dealing with valuable assets in the non-banking sector. These sectors encompass jewelry stores, retail businesses, pharmaceutical companies, and private collectors, among others. The increasing value of assets being transported or stored has made them prime targets for theft and other security threats. For instance, a report from the Anti-Defamation League revealed a surge in extremist violence in early 2025, with the number of deaths already surpassing the total for the previous year. To mitigate these risks, businesses are turning to advanced security solutions such as time-delay safes, access control systems, and biometric safes.
    • Insurance requirements often dictate the implementation of these security measures. Real estate agents and commercial property owners are also recognizing the importance of security awareness and investing in perimeter security, motion sensors, and alarm monitoring. Private security, security personnel, and safe transportation services are increasingly popular choices for businesses seeking to protect their assets. Disaster recovery plans that include data backup and redundancy systems are also crucial for businesses dealing with sensitive information. Access control systems and key duplication control are essential for maintaining the security of commercial safes. Gun safes are popular choices for individuals and businesses seeking to protect firearms.
    • As businesses continue to prioritize risk management and data security, the demand for advanced security solutions is expected to grow.

    What are the market trends shaping the Safes And Vaults In Non-Banking Industry?

    • The trend in the market is leaning towards advanced technological innovations in safes and vaults. This includes features such as biometric access, remote monitoring, and digital security systems. Technological enhancements are becoming essential for safes and vaults to meet the evolving security needs of businesses and individuals.

    • The non-banking safes and vaults market has experienced substantial technological progression, driven by the escalating demand for robust physical security solutions. With increasing concerns regarding asset protection and building security, businesses are investing in advanced safes and vaults to secure their valuable possessions. Some notable trends in this market include: Biometric security: Biometric technology, such as fingerprint and iris recognition, is increasingly being adopted in safes and vaults for highly secure access control systems. This technology mitigates the risks associated with lost or stolen keys or passwords, offering unparalleled security. Door sensors and alarms: Door sensors and burglar alarms are becoming standard features in safes and vaults, providing early warning systems against unauthorized entry.
    • These features enhance the overall security of the premises and help prevent potential losses. Security software and cameras: Integration of security software and cameras in safes and vaults allows for remote monitoring and management, providing an additional layer of protection against potential threats. Fire suppression systems: Fire suppression systems are crucial in safes and vaults to protect valuable assets from damage caused by fires. These systems ensure the safety of assets by quickly extinguishing fires and minimizing potential losses. Safe maintenance and repair: Regular maintenance and repair of safes and vaults are essential to ensure their optimal performance and longevity.
    • This includes cleaning, lubricating lock mechanisms, and addressing any potential issues before they become major problems. Intrusion detection systems: Intrusion detection systems provide an added layer of security by monitoring the surrounding area for potential threats and alerting authorities in case of a breach. These systems help safeguard assets and prevent potential losses. Lock mechanisms: Advanced lock mechanisms, such as electronic keypad locks and combination safes, offer enhanced security features and make it more difficult for unauthorized individuals to gain access. Security assessments: Regular security assessments help businesses identify potential vulnerabilities and address them before they can be exploited.
    • These assessments ensure the effectiveness of existing security measures and provide recommendations for improvements. Art security: For businesses dealing with valuable art collections, specialized safes and vaults designed for art security offer additional features, such as temperature and humidity control, to protect these assets from damage and degradation. Fire suppression systems: Fire suppression systems are essential in safes and vaults to protect valuable assets from damage caused by fires. These systems ensure the safety of assets by quickly extinguishing fires and minimizing potential losses. Safe repair: Regular maintenance and repair of safes and vaults are crucial to ensure their optimal performance and longevity.
    • This includes cleaning, lubricating lock mechanisms, and addressing any potential issues before they become major problems. In conclusion, the non-banking safes and vaults market is undergoing significant technological advancements to address the evolving security needs of businesses. Biometric security, door sensors and alarms, security software and cameras, fire suppression systems, safe maintenance and repair, intrusion detection systems, lock mechanisms, security assessments, and art security are some of the key trends driving the growth of this market. These innovations help businesses safeguard their valuable assets and ensure the protection of their premises.

    What challenges does the Safes And Vaults In Non-Banking Industry face during its growth?

    • The stringent regulations and industry standards concerning safety present a significant challenge to the industry's growth by imposing mandatory compliance requirements. 

    • The non-banking safes and vaults market demands strict adherence to security regulations and industry standards to protect valuable assets and confidential information. These regulations aim to enhance security measures and mitigate potential risks, such as unauthorized access, theft, and data breaches. However, keeping up with constantly evolving regulations across various regions and jurisdictions poses a significant challenge. Manufacturers and providers must invest in research and development to stay compliant and offer secure solutions. Security hardware, including fireproof safes, vault doors, and high-security safes, plays a crucial role in ensuring tenant and government security. Fire protection features like fireproof safes, pressure sensors, and fire suppression systems are essential for safeguarding valuable assets.
    • Security systems, such as RFID technology, CCTV systems, data encryption, biometric authentication, and electronic safes, provide advanced security features. Security training and consulting services help organizations maintain optimal security levels and implement best practices. Security lighting and safe auditing are additional measures that contribute to the overall security of non-banking safes and vaults. Inventory management systems ensure efficient and secure storage and access to assets. In conclusion, the non-banking safes and vaults market requires continuous innovation and adaptation to meet evolving security regulations and customer needs. Providers must invest in research and development to offer advanced security solutions that cater to various industries and applications.

    Exclusive Customer Landscape

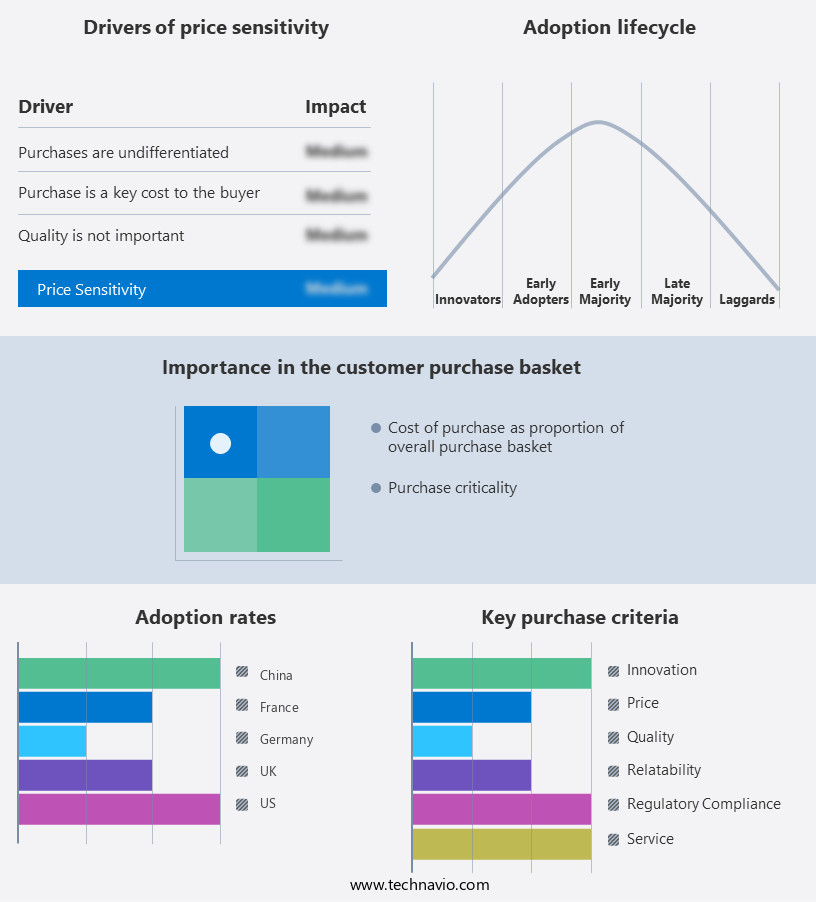
    The safes and vaults in non-banking market forecasting report includes the adoption lifecycle of the market, covering from the innovator’s stage to the laggard’s stage. It focuses on adoption rates in different regions based on penetration. Furthermore, the safes and vaults in non-banking market report also includes key purchase criteria and drivers of price sensitivity to help companies evaluate and develop their market growth analysis strategies.

    Safes And Vaults In Non-Banking Market Share by Geography

     Customer Landscape

    Key Companies & Market Insights

    Companies are implementing various strategies, such as strategic alliances, safes and vaults in non-banking market forecast, partnerships, mergers and acquisitions, geographical expansion, and product/service launches, to enhance their presence in the industry.

    Allegion Public Ltd. Co. - This company specializes in providing top-tier safes and vault solutions. Our product offerings encompass a range of options, including cylindrical and chart-type safes, handles and accessories, and door closers with servo-controlled closing mechanisms. These solutions prioritize security and durability, ensuring valuable assets remain protected. Our commitment to innovation sets us apart, continually elevating search engine exposure and delivering cutting-edge technology to our clients.

    The industry research and growth report includes detailed analyses of the competitive landscape of the market and information about key companies, including:

    • Allegion Public Ltd. Co.
    • Alpha Safe and Vault Inc.
    • American Security
    • BJARSTAL sarl
    • Bode Panzer GmbH
    • Bordogna Casseforti
    • Brown Safe Manufacturing Inc.
    • Bumilsafe Mfg. Co.
    • Cannon Safe
    • Cennox Inc.
    • CitySafe Inc.
    • Diebold Nixdorf Incorp.
    • dormakaba Holding AG
    • Gardall Safe Corp.
    • Godrej and Boyce Manufacturing Co. Ltd.
    • Gunnebo AB
    • Hamilton Safe

    Qualitative and quantitative analysis of companies has been conducted to help clients understand the wider business environment as well as the strengths and weaknesses of key industry players. Data is qualitatively analyzed to categorize companies as pure play, category-focused, industry-focused, and diversified; it is quantitatively analyzed to categorize companies as dominant, leading, strong, tentative, and weak.

    Recent Development and News in Safes And Vaults In Non-Banking Market

    • In February 2023, Gunvault, a leading non-banking safe manufacturer, introduced their newest biometric safe series, the GV2000NX, featuring advanced fingerprint technology and smartphone connectivity (Gunvault Press Release, 2023). This innovation allows users to unlock their safes using their unique fingerprints or via a compatible smartphone application.
    • In May 2024, Gardall Safe Company, a major player in the non-banking safes market, announced a strategic partnership with Amazon to offer their safes for sale on the e-commerce giant's platform. This collaboration aims to expand Gardall's reach and provide customers with a more convenient shopping experience (Amazon Business Wire, 2024).
    • In October 2024, Securicor, a global security solutions provider, acquired SafeSite, a leading provider of modular vaults and secure storage solutions. This acquisition strengthened Securicor's position in the non-banking safes and vaults market, allowing them to offer a more comprehensive range of security solutions to their clients (Securicor Press Release, 2024).
    • In March 2025, the European Union passed new regulations requiring all non-banking safes and vaults to meet stricter security standards. This policy change is expected to boost demand for high-security safes and vaults in the region (European Parliament Press Release, 2025). Additionally, it will push manufacturers to invest in research and development to meet these new requirements.

    Research Analyst Overview

    • In the non-banking market, the demand for advanced security solutions continues to grow, with cybersecurity insurance, behavioral analysis, and forensic security emerging as key areas of focus. Anti-theft devices, AI security, and robotics security are increasingly integrated into systems to enhance protection against physical and cyber threats. Security consulting services offer valuable insights on security best practices, vulnerability assessments, and compliance audits. Liability insurance, data breach prevention, and security incident management are essential components of risk mitigation strategies. Security budgeting, regulations, and reporting are critical for ensuring adherence to security standards.
    • RFID tags, security certifications, penetration testing, and security training programs are essential elements of a comprehensive security strategy. Cloud-based security and security analytics provide real-time monitoring and response capabilities, while tamper-proof mechanisms and security outsourcing offer additional layers of protection. Security incident response and security awareness campaigns are crucial for minimizing the impact of potential breaches.

    Dive into Technavio’s robust research methodology, blending expert interviews, extensive data synthesis, and validated models for unparalleled Safes And Vaults In Non-Banking Market insights. See full methodology.

    Market Scope

    Report Coverage

    Details

    Page number

    205

    Base year

    2024

    Historic period

    2019-2023

    Forecast period

    2025-2029

    Growth momentum & CAGR

    Accelerate at a CAGR of 8.4%

    Market growth 2025-2029

    USD 1907.4 million

    Market structure

    Fragmented

    YoY growth 2024-2025(%)

    7.8

    Key countries

    US, Germany, China, UK, Canada, France, India, Japan, Italy, and Brazil

    Competitive landscape

    Leading Companies, Market Positioning of Companies, Competitive Strategies, and Industry Risks

    Request Free Sample

    What are the Key Data Covered in this Safes And Vaults In Non-Banking Market Research and Growth Report?

    • CAGR of the Safes And Vaults In Non-Banking industry during the forecast period
    • Detailed information on factors that will drive the growth and forecasting between 2025 and 2029
    • Precise estimation of the size of the market and its contribution of the industry in focus to the parent market
    • Accurate predictions about upcoming growth and trends and changes in consumer behaviour
    • Growth of the market across North America, Europe, APAC, South America, and Middle East and Africa
    • Thorough analysis of the market’s competitive landscape and detailed information about companies
    • Comprehensive analysis of factors that will challenge the safes and vaults in non-banking market growth of industry companies

    We can help! Our analysts can customize this safes and vaults in non-banking market research report to meet your requirements.

    Get in touch


    1 Executive Summary

    • 1.1 Market overview
      • Executive Summary - Chart on Market Overview
      • Executive Summary - Data Table on Market Overview
      • Executive Summary - Chart on Global Market Characteristics
      • Executive Summary - Chart on Market by Geography
      • Executive Summary - Chart on Market Segmentation by Type
      • Executive Summary - Chart on Market Segmentation by End-user
      • Executive Summary - Chart on Market Segmentation by Material
      • Executive Summary - Chart on Incremental Growth
      • Executive Summary - Data Table on Incremental Growth
      • Executive Summary - Chart on Company Market Positioning

    2 Technavio Analysis

    • 2.1 Analysis of price sensitivity, lifecycle, customer purchase basket, adoption rates, and purchase criteria
      • Analysis of price sensitivity, lifecycle, customer purchase basket, adoption rates, and purchase criteria
    • 2.2 Criticality of inputs and Factors of differentiation
      • Overview on criticality of inputs and factors of differentiation
    • 2.3 Factors of disruption
      • Overview on factors of disruption
    • 2.4 Impact of drivers and challenges
      • Impact of drivers and challenges in 2024 and 2029

    3 Market Landscape

    • 3.1 Market ecosystem
      • Parent Market
      • Data Table on - Parent Market
    • 3.2 Market characteristics
      • Market characteristics analysis
    • 3.3 Value chain analysis
      • Value chain analysis

    4 Market Sizing

    • 4.1 Market definition
      • Offerings of companies included in the market definition
    • 4.2 Market segment analysis
      • Market segments
    • 4.3 Market size 2024
      • 4.4 Market outlook: Forecast for 2024-2029
        • Chart on Global - Market size and forecast 2024-2029 ($ million)
        • Data Table on Global - Market size and forecast 2024-2029 ($ million)
        • Chart on Global Market: Year-over-year growth 2024-2029 (%)
        • Data Table on Global Market: Year-over-year growth 2024-2029 (%)

      5 Historic Market Size

      • 5.1 Global Safes And Vaults In Non-Banking Market 2019 - 2023
        • Historic Market Size - Data Table on Global Safes And Vaults In Non-Banking Market 2019 - 2023 ($ million)
      • 5.2 Type segment analysis 2019 - 2023
        • Historic Market Size - Type Segment 2019 - 2023 ($ million)
      • 5.3 End-user segment analysis 2019 - 2023
        • Historic Market Size - End-user Segment 2019 - 2023 ($ million)
      • 5.4 Material segment analysis 2019 - 2023
        • Historic Market Size - Material Segment 2019 - 2023 ($ million)
      • 5.5 Geography segment analysis 2019 - 2023
        • Historic Market Size - Geography Segment 2019 - 2023 ($ million)
      • 5.6 Country segment analysis 2019 - 2023
        • Historic Market Size - Country Segment 2019 - 2023 ($ million)

      6 Qualitative Analysis

      • 6.1 The impact of AI in global safes and vaults in non-banking market

        7 Five Forces Analysis

        • 7.1 Five forces summary
          • Five forces analysis - Comparison between 2024 and 2029
        • 7.2 Bargaining power of buyers
          • Bargaining power of buyers - Impact of key factors 2024 and 2029
        • 7.3 Bargaining power of suppliers
          • Bargaining power of suppliers - Impact of key factors in 2024 and 2029
        • 7.4 Threat of new entrants
          • Threat of new entrants - Impact of key factors in 2024 and 2029
        • 7.5 Threat of substitutes
          • Threat of substitutes - Impact of key factors in 2024 and 2029
        • 7.6 Threat of rivalry
          • Threat of rivalry - Impact of key factors in 2024 and 2029
        • 7.7 Market condition
          • Chart on Market condition - Five forces 2024 and 2029

        8 Market Segmentation by Type

        • 8.1 Market segments
          • Chart on Type - Market share 2024-2029 (%)
          • Data Table on Type - Market share 2024-2029 (%)
        • 8.2 Comparison by Type
          • Chart on Comparison by Type
          • Data Table on Comparison by Type
        • 8.3 Cash management safes - Market size and forecast 2024-2029
          • Chart on Cash management safes - Market size and forecast 2024-2029 ($ million)
          • Data Table on Cash management safes - Market size and forecast 2024-2029 ($ million)
          • Chart on Cash management safes - Year-over-year growth 2024-2029 (%)
          • Data Table on Cash management safes - Year-over-year growth 2024-2029 (%)
        • 8.4 Depository safes - Market size and forecast 2024-2029
          • Chart on Depository safes - Market size and forecast 2024-2029 ($ million)
          • Data Table on Depository safes - Market size and forecast 2024-2029 ($ million)
          • Chart on Depository safes - Year-over-year growth 2024-2029 (%)
          • Data Table on Depository safes - Year-over-year growth 2024-2029 (%)
        • 8.5 Others - Market size and forecast 2024-2029
          • Chart on Others - Market size and forecast 2024-2029 ($ million)
          • Data Table on Others - Market size and forecast 2024-2029 ($ million)
          • Chart on Others - Year-over-year growth 2024-2029 (%)
          • Data Table on Others - Year-over-year growth 2024-2029 (%)
        • 8.6 Market opportunity by Type
          • Market opportunity by Type ($ million)
          • Data Table on Market opportunity by Type ($ million)

        9 Market Segmentation by End-user

        • 9.1 Market segments
          • Chart on End-user - Market share 2024-2029 (%)
          • Data Table on End-user - Market share 2024-2029 (%)
        • 9.2 Comparison by End-user
          • Chart on Comparison by End-user
          • Data Table on Comparison by End-user
        • 9.3 Commercial - Market size and forecast 2024-2029
          • Chart on Commercial - Market size and forecast 2024-2029 ($ million)
          • Data Table on Commercial - Market size and forecast 2024-2029 ($ million)
          • Chart on Commercial - Year-over-year growth 2024-2029 (%)
          • Data Table on Commercial - Year-over-year growth 2024-2029 (%)
        • 9.4 Residential - Market size and forecast 2024-2029
          • Chart on Residential - Market size and forecast 2024-2029 ($ million)
          • Data Table on Residential - Market size and forecast 2024-2029 ($ million)
          • Chart on Residential - Year-over-year growth 2024-2029 (%)
          • Data Table on Residential - Year-over-year growth 2024-2029 (%)
        • 9.5 Market opportunity by End-user
          • Market opportunity by End-user ($ million)
          • Data Table on Market opportunity by End-user ($ million)

        10 Market Segmentation by Material

        • 10.1 Market segments
          • Chart on Material - Market share 2024-2029 (%)
          • Data Table on Material - Market share 2024-2029 (%)
        • 10.2 Comparison by Material
          • Chart on Comparison by Material
          • Data Table on Comparison by Material
        • 10.3 Metal safes and vaults - Market size and forecast 2024-2029
          • Chart on Metal safes and vaults - Market size and forecast 2024-2029 ($ million)
          • Data Table on Metal safes and vaults - Market size and forecast 2024-2029 ($ million)
          • Chart on Metal safes and vaults - Year-over-year growth 2024-2029 (%)
          • Data Table on Metal safes and vaults - Year-over-year growth 2024-2029 (%)
        • 10.4 Concrete vaults - Market size and forecast 2024-2029
          • Chart on Concrete vaults - Market size and forecast 2024-2029 ($ million)
          • Data Table on Concrete vaults - Market size and forecast 2024-2029 ($ million)
          • Chart on Concrete vaults - Year-over-year growth 2024-2029 (%)
          • Data Table on Concrete vaults - Year-over-year growth 2024-2029 (%)
        • 10.5 Composite materials - Market size and forecast 2024-2029
          • Chart on Composite materials - Market size and forecast 2024-2029 ($ million)
          • Data Table on Composite materials - Market size and forecast 2024-2029 ($ million)
          • Chart on Composite materials - Year-over-year growth 2024-2029 (%)
          • Data Table on Composite materials - Year-over-year growth 2024-2029 (%)
        • 10.6 Market opportunity by Material
          • Market opportunity by Material ($ million)
          • Data Table on Market opportunity by Material ($ million)

        11 Customer Landscape

        • 11.1 Customer landscape overview
          • Analysis of price sensitivity, lifecycle, customer purchase basket, adoption rates, and purchase criteria

        12 Geographic Landscape

        • 12.1 Geographic segmentation
          • Chart on Market share by geography 2024-2029 (%)
          • Data Table on Market share by geography 2024-2029 (%)
        • 12.2 Geographic comparison
          • Chart on Geographic comparison
          • Data Table on Geographic comparison
        • 12.3 North America - Market size and forecast 2024-2029
          • Chart on North America - Market size and forecast 2024-2029 ($ million)
          • Data Table on North America - Market size and forecast 2024-2029 ($ million)
          • Chart on North America - Year-over-year growth 2024-2029 (%)
          • Data Table on North America - Year-over-year growth 2024-2029 (%)
        • 12.4 Europe - Market size and forecast 2024-2029
          • Chart on Europe - Market size and forecast 2024-2029 ($ million)
          • Data Table on Europe - Market size and forecast 2024-2029 ($ million)
          • Chart on Europe - Year-over-year growth 2024-2029 (%)
          • Data Table on Europe - Year-over-year growth 2024-2029 (%)
        • 12.5 APAC - Market size and forecast 2024-2029
          • Chart on APAC - Market size and forecast 2024-2029 ($ million)
          • Data Table on APAC - Market size and forecast 2024-2029 ($ million)
          • Chart on APAC - Year-over-year growth 2024-2029 (%)
          • Data Table on APAC - Year-over-year growth 2024-2029 (%)
        • 12.6 South America - Market size and forecast 2024-2029
          • Chart on South America - Market size and forecast 2024-2029 ($ million)
          • Data Table on South America - Market size and forecast 2024-2029 ($ million)
          • Chart on South America - Year-over-year growth 2024-2029 (%)
          • Data Table on South America - Year-over-year growth 2024-2029 (%)
        • 12.7 Middle East and Africa - Market size and forecast 2024-2029
          • Chart on Middle East and Africa - Market size and forecast 2024-2029 ($ million)
          • Data Table on Middle East and Africa - Market size and forecast 2024-2029 ($ million)
          • Chart on Middle East and Africa - Year-over-year growth 2024-2029 (%)
          • Data Table on Middle East and Africa - Year-over-year growth 2024-2029 (%)
        • 12.8 US - Market size and forecast 2024-2029
          • Chart on US - Market size and forecast 2024-2029 ($ million)
          • Data Table on US - Market size and forecast 2024-2029 ($ million)
          • Chart on US - Year-over-year growth 2024-2029 (%)
          • Data Table on US - Year-over-year growth 2024-2029 (%)
        • 12.9 Germany - Market size and forecast 2024-2029
          • Chart on Germany - Market size and forecast 2024-2029 ($ million)
          • Data Table on Germany - Market size and forecast 2024-2029 ($ million)
          • Chart on Germany - Year-over-year growth 2024-2029 (%)
          • Data Table on Germany - Year-over-year growth 2024-2029 (%)
        • 12.10 China - Market size and forecast 2024-2029
          • Chart on China - Market size and forecast 2024-2029 ($ million)
          • Data Table on China - Market size and forecast 2024-2029 ($ million)
          • Chart on China - Year-over-year growth 2024-2029 (%)
          • Data Table on China - Year-over-year growth 2024-2029 (%)
        • 12.11 UK - Market size and forecast 2024-2029
          • Chart on UK - Market size and forecast 2024-2029 ($ million)
          • Data Table on UK - Market size and forecast 2024-2029 ($ million)
          • Chart on UK - Year-over-year growth 2024-2029 (%)
          • Data Table on UK - Year-over-year growth 2024-2029 (%)
        • 12.12 Canada - Market size and forecast 2024-2029
          • Chart on Canada - Market size and forecast 2024-2029 ($ million)
          • Data Table on Canada - Market size and forecast 2024-2029 ($ million)
          • Chart on Canada - Year-over-year growth 2024-2029 (%)
          • Data Table on Canada - Year-over-year growth 2024-2029 (%)
        • 12.13 France - Market size and forecast 2024-2029
          • Chart on France - Market size and forecast 2024-2029 ($ million)
          • Data Table on France - Market size and forecast 2024-2029 ($ million)
          • Chart on France - Year-over-year growth 2024-2029 (%)
          • Data Table on France - Year-over-year growth 2024-2029 (%)
        • 12.14 India - Market size and forecast 2024-2029
          • Chart on India - Market size and forecast 2024-2029 ($ million)
          • Data Table on India - Market size and forecast 2024-2029 ($ million)
          • Chart on India - Year-over-year growth 2024-2029 (%)
          • Data Table on India - Year-over-year growth 2024-2029 (%)
        • 12.15 Japan - Market size and forecast 2024-2029
          • Chart on Japan - Market size and forecast 2024-2029 ($ million)
          • Data Table on Japan - Market size and forecast 2024-2029 ($ million)
          • Chart on Japan - Year-over-year growth 2024-2029 (%)
          • Data Table on Japan - Year-over-year growth 2024-2029 (%)
        • 12.16 Italy - Market size and forecast 2024-2029
          • Chart on Italy - Market size and forecast 2024-2029 ($ million)
          • Data Table on Italy - Market size and forecast 2024-2029 ($ million)
          • Chart on Italy - Year-over-year growth 2024-2029 (%)
          • Data Table on Italy - Year-over-year growth 2024-2029 (%)
        • 12.17 Brazil - Market size and forecast 2024-2029
          • Chart on Brazil - Market size and forecast 2024-2029 ($ million)
          • Data Table on Brazil - Market size and forecast 2024-2029 ($ million)
          • Chart on Brazil - Year-over-year growth 2024-2029 (%)
          • Data Table on Brazil - Year-over-year growth 2024-2029 (%)
        • 12.18 Market opportunity by geography
          • Market opportunity by geography ($ million)
          • Data Tables on Market opportunity by geography ($ million)

        13 Drivers, Challenges, and Opportunity/Restraints

        • 13.1 Market drivers
          • 13.2 Market challenges
            • 13.3 Impact of drivers and challenges
              • Impact of drivers and challenges in 2024 and 2029
            • 13.4 Market opportunities/restraints

              14 Competitive Landscape

              • 14.1 Overview
                • 14.2 Competitive Landscape
                  • Overview on criticality of inputs and factors of differentiation
                • 14.3 Landscape disruption
                  • Overview on factors of disruption
                • 14.4 Industry risks
                  • Impact of key risks on business

                15 Competitive Analysis

                • 15.1 Companies profiled
                  • Companies covered
                • 15.2 Company ranking index
                  • Company ranking index
                • 15.3 Market positioning of companies
                  • Matrix on companies position and classification
                • 15.4 Allegion Public Ltd. Co.
                  • Allegion Public Ltd. Co. - Overview
                  • Allegion Public Ltd. Co. - Business segments
                  • Allegion Public Ltd. Co. - Key news
                  • Allegion Public Ltd. Co. - Key offerings
                  • Allegion Public Ltd. Co. - Segment focus
                  • SWOT
                • 15.5 Alpha Safe and Vault Inc.
                  • Alpha Safe and Vault Inc. - Overview
                  • Alpha Safe and Vault Inc. - Product / Service
                  • Alpha Safe and Vault Inc. - Key offerings
                  • SWOT
                • 15.6 American Security
                  • American Security - Overview
                  • American Security - Product / Service
                  • American Security - Key offerings
                  • SWOT
                • 15.7 BJARSTAL sarl
                  • BJARSTAL sarl - Overview
                  • BJARSTAL sarl - Product / Service
                  • BJARSTAL sarl - Key offerings
                  • SWOT
                • 15.8 Bode Panzer GmbH
                  • Bode Panzer GmbH - Overview
                  • Bode Panzer GmbH - Product / Service
                  • Bode Panzer GmbH - Key offerings
                  • SWOT
                • 15.9 Bordogna Casseforti
                  • Bordogna Casseforti - Overview
                  • Bordogna Casseforti - Product / Service
                  • Bordogna Casseforti - Key offerings
                  • SWOT
                • 15.10 Brown Safe Manufacturing Inc.
                  • Brown Safe Manufacturing Inc. - Overview
                  • Brown Safe Manufacturing Inc. - Product / Service
                  • Brown Safe Manufacturing Inc. - Key offerings
                  • SWOT
                • 15.11 Bumilsafe Mfg. Co.
                  • Bumilsafe Mfg. Co. - Overview
                  • Bumilsafe Mfg. Co. - Product / Service
                  • Bumilsafe Mfg. Co. - Key offerings
                  • SWOT
                • 15.12 Cannon Safe
                  • Cannon Safe - Overview
                  • Cannon Safe - Product / Service
                  • Cannon Safe - Key offerings
                  • SWOT
                • 15.13 Cennox Inc.
                  • Cennox Inc. - Overview
                  • Cennox Inc. - Product / Service
                  • Cennox Inc. - Key offerings
                  • SWOT
                • 15.14 CitySafe Inc.
                  • CitySafe Inc. - Overview
                  • CitySafe Inc. - Product / Service
                  • CitySafe Inc. - Key offerings
                  • SWOT
                • 15.15 Diebold Nixdorf Incorp.
                  • Diebold Nixdorf Incorp. - Overview
                  • Diebold Nixdorf Incorp. - Business segments
                  • Diebold Nixdorf Incorp. - Key offerings
                  • Diebold Nixdorf Incorp. - Segment focus
                  • SWOT
                • 15.16 dormakaba Holding AG
                  • dormakaba Holding AG - Overview
                  • dormakaba Holding AG - Business segments
                  • dormakaba Holding AG - Key offerings
                  • dormakaba Holding AG - Segment focus
                  • SWOT
                • 15.17 Godrej and Boyce Manufacturing Co. Ltd.
                  • Godrej and Boyce Manufacturing Co. Ltd. - Overview
                  • Godrej and Boyce Manufacturing Co. Ltd. - Product / Service
                  • Godrej and Boyce Manufacturing Co. Ltd. - Key offerings
                  • SWOT
                • 15.18 Gunnebo AB
                  • Gunnebo AB - Overview
                  • Gunnebo AB - Product / Service
                  • Gunnebo AB - Key offerings
                  • SWOT

                16 Appendix

                • 16.1 Scope of the report
                  • 16.2 Inclusions and exclusions checklist
                    • Inclusions checklist
                    • Exclusions checklist
                  • 16.3 Currency conversion rates for US$
                    • Currency conversion rates for US$
                  • 16.4 Research methodology
                    • Research methodology
                  • 16.5 Data procurement
                    • Information sources
                  • 16.6 Data validation
                    • Data validation
                  • 16.7 Validation techniques employed for market sizing
                    • Validation techniques employed for market sizing
                  • 16.8 Data synthesis
                    • Data synthesis
                  • 16.9 360 degree market analysis
                    • 360 degree market analysis
                  • 16.10 List of abbreviations
                    • List of abbreviations

                  Research Methodology

                  Technavio presents a detailed picture of the market by way of study, synthesis, and summation of data from multiple sources. The analysts have presented the various facets of the market with a particular focus on identifying the key industry influencers. The data thus presented is comprehensive, reliable, and the result of extensive research, both primary and secondary.

                  INFORMATION SOURCES

                  Primary sources

                  • Manufacturers and suppliers
                  • Channel partners
                  • Industry experts
                  • Strategic decision makers

                  Secondary sources

                  • Industry journals and periodicals
                  • Government data
                  • Financial reports of key industry players
                  • Historical data
                  • Press releases

                  DATA ANALYSIS

                  Data Synthesis

                  • Collation of data
                  • Estimation of key figures
                  • Analysis of derived insights

                  Data Validation

                  • Triangulation with data models
                  • Reference against proprietary databases
                  • Corroboration with industry experts

                  REPORT WRITING

                  Qualitative

                  • Market drivers
                  • Market challenges
                  • Market trends
                  • Five forces analysis

                  Quantitative

                  • Market size and forecast
                  • Market segmentation
                  • Geographical insights
                  • Competitive landscape

                  Interested in this report?

                  Get your sample now to see our research methodology and insights!

                  Download Now

                  Frequently Asked Questions

                  Safes And Vaults In Non-Banking market growth will increase by $ 1907.4 mn during 2025-2029.

                  The Safes And Vaults In Non-Banking market is expected to grow at a CAGR of 8.4% during 2025-2029.

                  Safes And Vaults In Non-Banking market is segmented by Type( Cash management safes, Depository safes, Others) End-user( Commercial, Residential) Material( Metal safes and vaults , Concrete vaults, Composite materials, South America, Middle East and Africa)

                  Allegion Public Ltd. Co., Alpha Safe and Vault Inc., American Security, BJARSTAL sarl, Bode Panzer GmbH, Bordogna Casseforti, Brown Safe Manufacturing Inc., Bumilsafe Mfg. Co., Cannon Safe, Cennox Inc., CitySafe Inc., Diebold Nixdorf Incorp., dormakaba Holding AG, Gardall Safe Corp., Godrej and Boyce Manufacturing Co. Ltd., Gunnebo AB, Hamilton Safe are a few of the key vendors in the Safes And Vaults In Non-Banking market.

                  Europe will register the highest growth rate of 31% among the other regions. Therefore, the Safes And Vaults In Non-Banking market in Europe is expected to garner significant business opportunities for the vendors during the forecast period.

                  US, Germany, China, UK, Canada, France, India, Japan, Italy, Brazil

                  • Increase in crime rate and concern about safetyThe world is witnessing an alarming increase in the crime rate is the driving factor this market.
                  • leading to growing concerns about safety. Security threats and targeted attacks have become more sophisticated is the driving factor this market.
                  • posing significant challenges to the transportation and protection of valuable assets. For instance is the driving factor this market.
                  • in February 2025 is the driving factor this market.
                  • a report from the Anti-Defamation League highlighted a surge in extremist violence is the driving factor this market.
                  • with the number of deaths in the first six weeks of 2025 already surpassing the total for 2024.One of the primary reasons behind the surge in crime is the rising value of assets being transported or stored in non-banking sectors. These sectors include jewelry stores is the driving factor this market.
                  • retail businesses is the driving factor this market.
                  • pharmaceutical companies is the driving factor this market.
                  • and private collectors is the driving factor this market.
                  • among others. Criminals see these assets as lucrative targets for theft and illegal trade. As the value increases is the driving factor this market.
                  • so does the incentive to carry out high-profile heists or robberies is the driving factor this market.
                  • which often involve targeting drivers responsible for transporting these valuable goods. Additionally is the driving factor this market.
                  • advancements in technology and criminal methodologies have further aggravated concerns about safety. Criminals are increasingly using sophisticated tools and techniques to breach security systems is the driving factor this market.
                  • gaining unauthorized access to transport vehicles and storage facilities. According to the world population review is the driving factor this market.
                  • Venezuela is the country with the highest crime index in the world is the driving factor this market.
                  • at 83.76. Travelers should avoid going to Venezuela as per the U.S. Department of States Level 4 travel recommendation is the driving factor this market.
                  • which states that it is risky to travel there. The collapse of the Rule of Law is the driving factor this market.
                  • judicial system flaws is the driving factor this market.
                  • and government corruption have all been blamed for Venezuelas high crime rates.The crime index for Papua New Guinea is 80.79. The main causes of crime in Papua New Guinea is the driving factor this market.
                  • particularly violent crime is the driving factor this market.
                  • are the countrys swift social is the driving factor this market.
                  • political is the driving factor this market.
                  • and economic developments. Rasool gang members typically lack formal education and job options is the driving factor this market.
                  • and they participate in both small- and large-scale criminal activities.The lack of standardized security protocols across different regions and industries is another contributing factor. Some businesses may prioritize budget constraints over investing in robust security measures is the driving factor this market.
                  • leaving drivers and assets vulnerable to criminal activities. Moreover is the driving factor this market.
                  • limited awareness and training among drivers regarding best practices for safety in high-risk areas or during emergencies further exacerbate the problem. To address these challenges is the driving factor this market.
                  • the non-banking sector and relevant authorities need to collaborate closely in implementing comprehensive security protocols and standards. This may include the use of advanced technologies is the driving factor this market.
                  • such as biometric authentication and GPS tracking systems is the driving factor this market.
                  • to enhance the monitoring and security of assets during transportation. Regular training programs for drivers on situational awareness is the driving factor this market.
                  • emergency response is the driving factor this market.
                  • and self-defense techniques can also significantly improve their safety. Thus is the driving factor this market.
                  • the increase in the crime rate and concern about safety will drive the growth of the global safes and vaults in non-banking market during the forecast period. is the driving factor this market.

                  The Safes And Vaults In Non-Banking market vendors should focus on grabbing business opportunities from the Cash management safes segment as it accounted for the largest market share in the base year.
                  RIA - Research AI Assistant
                  Ask RIA