Laundry Care Market Size 2026-2030
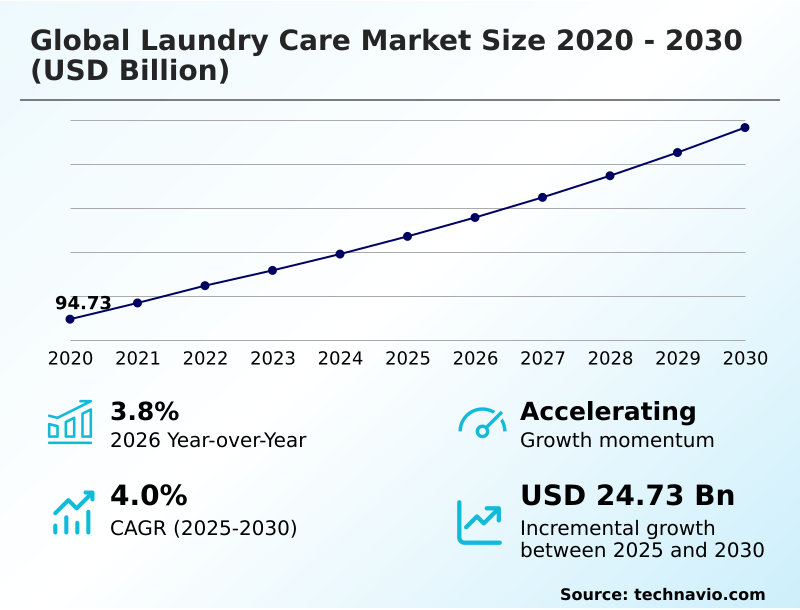
The laundry care market size is valued to increase by USD 24.73 billion, at a CAGR of 4% from 2025 to 2030. Imperative of sustainability and heightened eco-consciousness will drive the laundry care market.
Major Market Trends & Insights
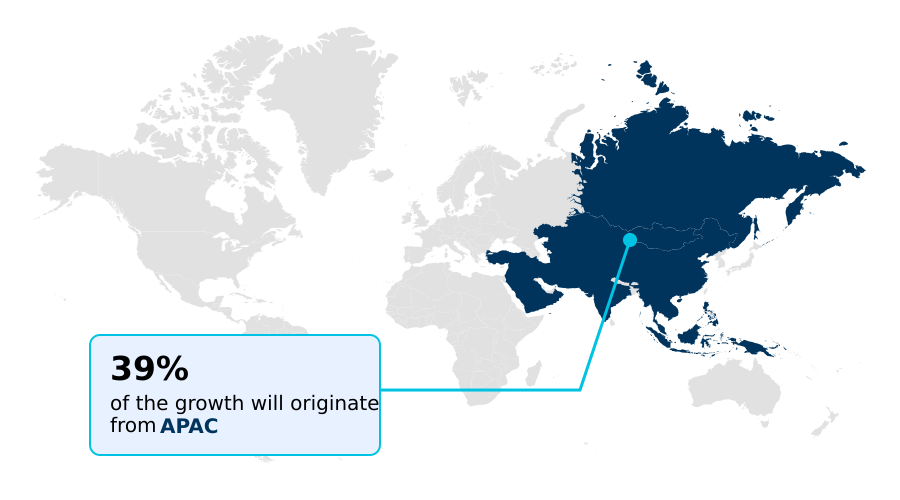
- APAC dominated the market and accounted for a 39.2% growth during the forecast period.
- By Distribution Channel - Offline segment was valued at USD 64.70 billion in 2024
- By Product - Laundry detergent segment accounted for the largest market revenue share in 2024
Market Size & Forecast
- Market Opportunities: USD 43.55 billion
- Market Future Opportunities: USD 24.73 billion
- CAGR from 2025 to 2030 : 4%
Market Summary
- The laundry care market is undergoing a significant transformation, moving beyond basic cleaning to address sophisticated consumer demands for convenience, sustainability, and specialized fabric care. This evolution is driven by a pronounced shift toward unit-dose formats like dissolvable laundry pods and innovative waterless detergent formats, including solid detergent sheets, which appeal to modern lifestyles while reducing environmental impact.
- Formulations are advancing rapidly, with a focus on cold-water performance to promote energy savings and the integration of plant-based surfactants and biodegradable ingredients. Premiumization trends are also prominent, with consumers seeking sensory experience enhancement through micro-encapsulation technology for long-lasting fragrance delivery and superior fabric care and protection. For manufacturers, adapting to this landscape requires significant operational agility.
- For instance, a company transitioning to refillable packaging systems must reconfigure its entire supply chain, from sustainable sourcing of bulk materials to implementing reverse logistics for container returns, a complex undertaking that directly impacts capital expenditure and long-term profitability. This push for sustainability, coupled with the need for continuous product format innovation, defines the industry's competitive dynamic.
What will be the Size of the Laundry Care Market during the forecast period?
Get Key Insights on Market Forecast (PDF) Get Free Sample
How is the Laundry Care Market Segmented?
The laundry care industry research report provides comprehensive data (region-wise segment analysis), with forecasts and estimates in "USD million" for the period 2026-2030, as well as historical data from 2020-2024 for the following segments.
- Distribution channel
- Offline
- Online
- Product
- Laundry detergent
- Fabric softner
- Others
- Application
- Residential
- Commercial
- Type
- Liquids
- Powders
- Pods
- Sheets
- Bar soaps
- Geography
- APAC
- China
- India
- Japan
- North America
- US
- Canada
- Mexico
- Europe
- Germany
- UK
- France
- South America
- Brazil
- Argentina
- Colombia
- Middle East and Africa
- Saudi Arabia
- UAE
- South Africa
- Rest of World (ROW)
- APAC
By Distribution Channel Insights
The offline segment is estimated to witness significant growth during the forecast period.
The offline retail segment, encompassing traditional brick-and-mortar stores, remains the market's foundational pillar. Its strength lies in established consumer habits and the ability for shoppers to interact directly with products, from concentrated liquid detergents to items featuring plastic-free packaging.
However, this channel faces intense private label competition and pressure from e-commerce channel growth. To adapt, retailers are enhancing the in-store experience, with some introducing refillable packaging systems to promote a reduced packaging footprint and foster brand loyalty cultivation.
Initiatives like installing digital displays that highlight product format innovation and material sourcing, such as the use of post-consumer recycled plastics, influence purchasing decisions in over 60% of in-store shoppers, demonstrating a strategic response to evolving consumer values.
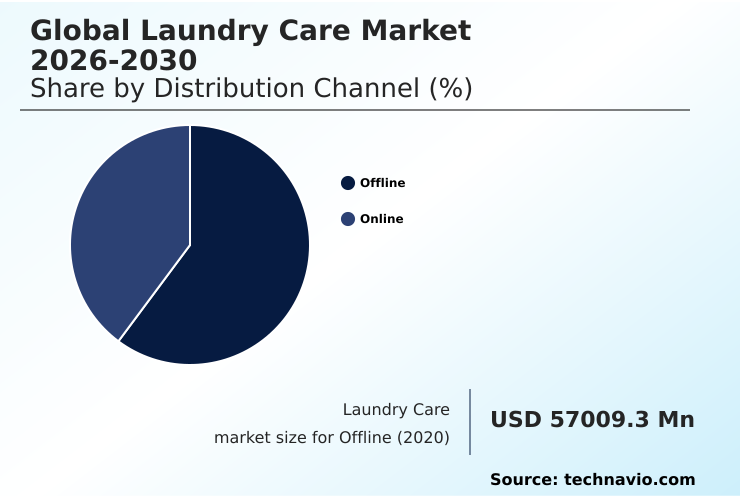
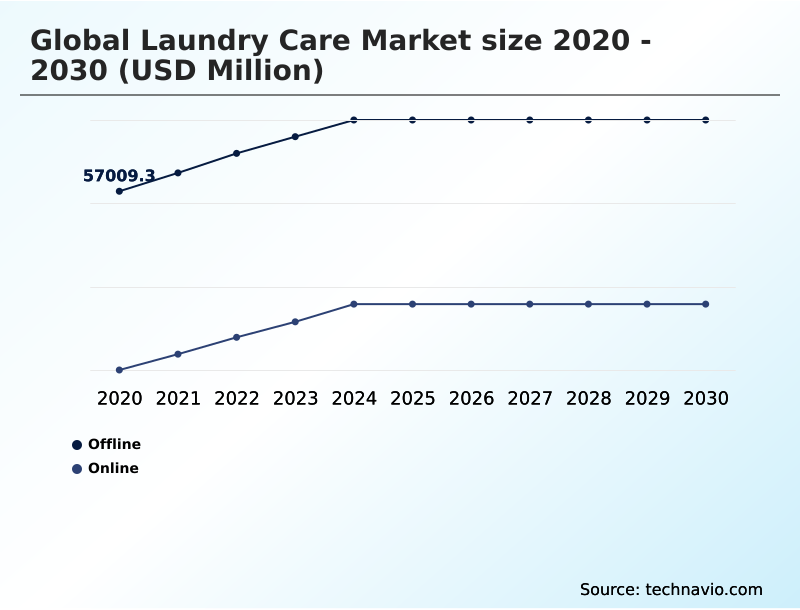
The Offline segment was valued at USD 64.70 billion in 2024 and showed a gradual increase during the forecast period.
Regional Analysis
APAC is estimated to contribute 39.2% to the growth of the global market during the forecast period.Technavio’s analysts have elaborately explained the regional trends and drivers that shape the market during the forecast period.
See How Laundry Care Market Demand is Rising in APAC Get Free Sample
The geographic landscape is highly diverse, contrasting mature markets in North America and Europe with high-growth regions like APAC, which will contribute nearly 40% of the market's incremental growth.
In developed regions, the focus is on energy conservation in laundry, driving demand for products ensuring excellent cold-water performance. Consumers here also prioritize fabric care and protection, seeking formulations with color protection polymers and fiber-smoothing agents.
In contrast, many developing markets are transitioning from basic powders to liquids.
Across all regions, circular economy principles are gaining influence, compelling manufacturers to invest in biodegradable ingredients and sustainable packaging to strengthen brand loyalty cultivation among an increasingly eco-conscious global consumer base.
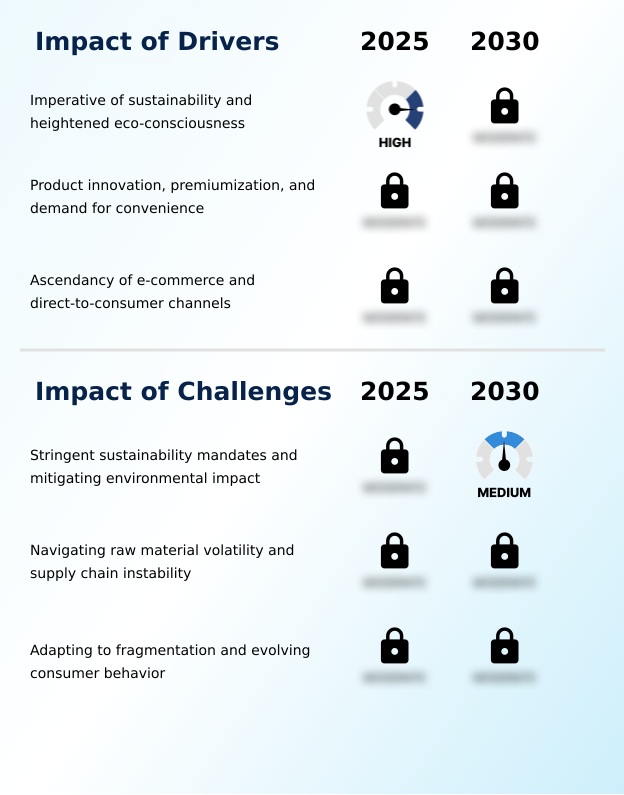
Market Dynamics
Our researchers analyzed the data with 2025 as the base year, along with the key drivers, trends, and challenges. A holistic analysis of drivers will help companies refine their marketing strategies to gain a competitive advantage.
- Today’s consumers navigate a complex landscape of laundry care choices, driven by diverse needs and values. A primary consideration for families is finding the best laundry detergent for sensitive skin, which often leads to searches for hypoallergenic laundry detergent for babies and products that are both vegan and cruelty-free.
- The environmental impact of consumption is a major factor, prompting research into eco-friendly laundry detergent packaging options and questions like are laundry detergent pods biodegradable. This has fueled the popularity of zero waste laundry detergent sheets and the ongoing laundry detergent sheets versus pods comparison.
- Cost and efficiency remain crucial, leading consumers to analyze the powder versus liquid detergent cost and learn how to use concentrated laundry detergent effectively. Performance is non-negotiable, with a focus on cold water wash detergent effectiveness and the ability of enzyme detergents for removing tough stains.
- The desire for convenience is met by multi-functional laundry pods for convenience, while sensory preferences drive the search for the best smelling long-lasting fabric softener. Hygiene concerns are addressed by the specific need for a laundry sanitizer for cold water washes. The market is also seeing interest in smart-dosing washing machine detergent types and even DIY natural laundry detergent alternatives.
- As a result, supply chain analysis shows a shift to waterless formats reduces shipping weight by a factor of five compared to liquids, impacting logistics costs. Consumers are also interested in understanding the impact of phosphates on the environment and the benefits of plant-based surfactant cleaners, with many turning to subscription boxes for laundry supplies to simplify purchasing.
What are the key market drivers leading to the rise in the adoption of Laundry Care Industry?
- The imperative for sustainability and a heightened sense of eco-consciousness among consumers are key drivers of market growth.
- Market expansion is fueled by innovation catering to consumer lifestyle shifts toward convenience and premium performance. These premiumization trends are evident in the adoption of advanced products that offer superior cold wash efficacy, reducing household energy use by over 70%.
- The demand for simplicity has propelled the growth of unit-dose formats like multi-chamber pods, which leverage advanced enzyme technology for targeted stain removal.
- The rise of direct-to-consumer (DTC) models and subscription-based services has been pivotal, allowing niche brands featuring plant-based surfactants to capture significant market share.
- Furthermore, the integration of smart home technology is creating a new ecosystem for auto-dosing detergents, enhancing user convenience and optimizing product consumption.
What are the market trends shaping the Laundry Care Industry?
- A primary market trend is the increasing ubiquity of eco-conscious formulations and circular packaging, driven by a growing demand for sustainable products.
- Key market trends are converging around sustainability and wellness. The demand for ingredient transparency is driving the mainstreaming of hypoallergenic formulations and dermatologically tested products. This aligns with a greater household hygiene focus, where laundry sanitizer additives are gaining traction, with sales increasing by 35% in hygiene-conscious households.
- Concurrently, product innovation is addressing environmental concerns through waterless detergent formats like solid detergent sheets, which reduce shipping weight by up to 90% compared to liquids. This move towards compostable packaging and formulations that serve as water scarcity solutions is reshaping product development, while sensory experience enhancement remains a critical differentiator for brand preference.
What challenges does the Laundry Care Industry face during its growth?
- Stringent sustainability mandates and the challenge of mitigating environmental impact are key factors affecting industry growth.
- The industry navigates significant operational headwinds, primarily from supply chain volatility and raw material price fluctuation, especially for petrochemical derivatives used in production, which can impact costs by over 30% in a single quarter. Regulatory compliance costs are escalating as mandates require the adoption of optical brightener alternatives and the development of phosphate-free detergents.
- This pressure to reformulate for sustainable sourcing complicates production of items like dissolvable laundry pods and low-sudsing formulations. Simultaneously, niche market fragmentation challenges established players, who must adapt their portfolios to cater to specialized consumer demands while managing the complex logistics and R&D investment required for this diversification.
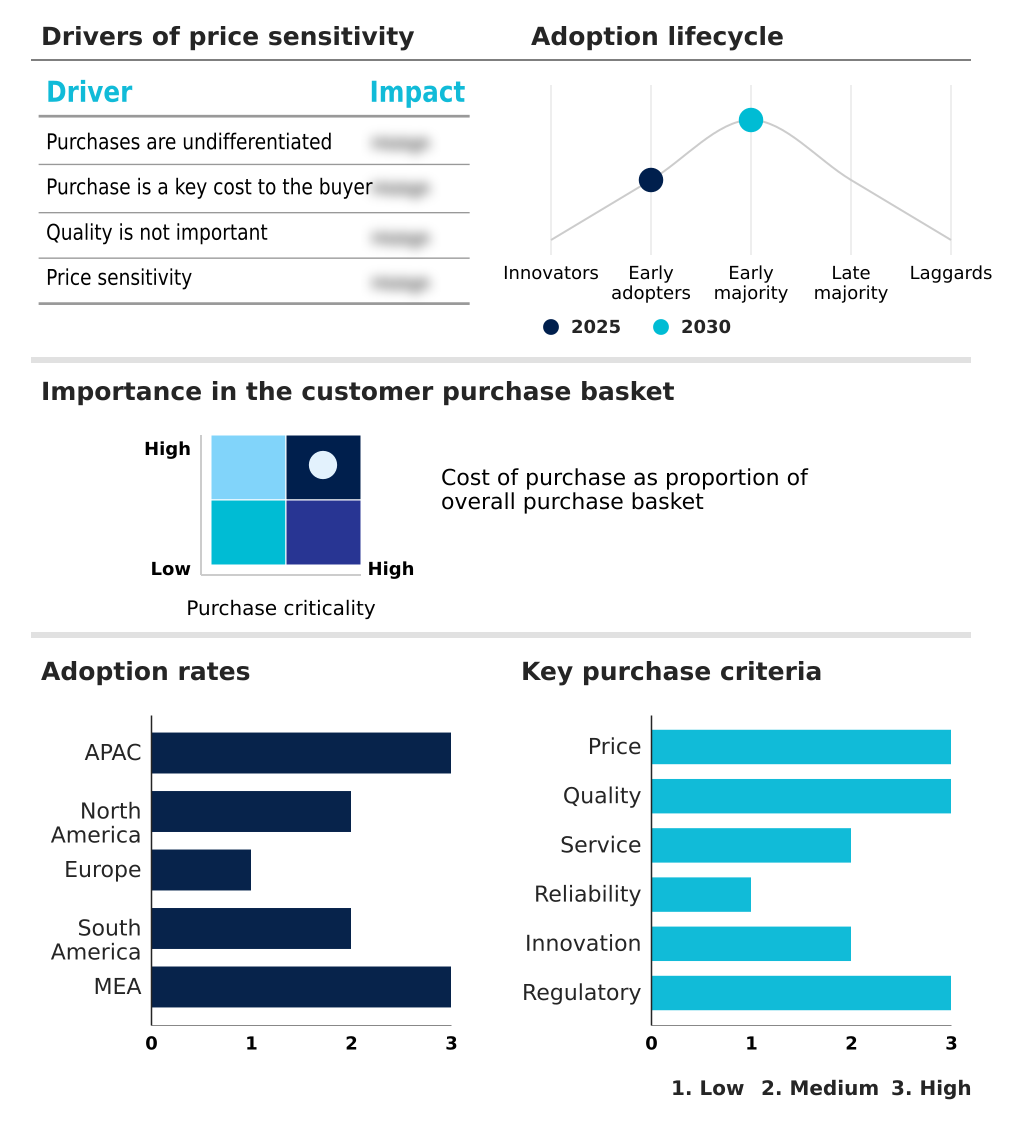
Exclusive Technavio Analysis on Customer Landscape
The laundry care market forecasting report includes the adoption lifecycle of the market, covering from the innovator’s stage to the laggard’s stage. It focuses on adoption rates in different regions based on penetration. Furthermore, the laundry care market report also includes key purchase criteria and drivers of price sensitivity to help companies evaluate and develop their market growth analysis strategies.
Customer Landscape of Laundry Care Industry
Competitive Landscape
Companies are implementing various strategies, such as strategic alliances, laundry care market forecast, partnerships, mergers and acquisitions, geographical expansion, and product/service launches, to enhance their presence in the industry.
Amway Corp. - Delivers concentrated, eco-friendly laundry care performance, emphasizing cleaning efficiency and sustainable principles.
The industry research and growth report includes detailed analyses of the competitive landscape of the market and information about key companies, including:
- Amway Corp.
- Church and Dwight Co. Inc.
- Colgate Palmolive Co.
- Fena Pvt. Ltd.
- Godrej Enterprises Group
- Grove Collaborative Inc.
- Henkel AG and Co. KGaA
- Jyothy Labs Ltd.
- Kao Corp.
- Lion Corp.
- Procter and Gamble Co.
- Puracy
- PZ Cussons Plc
- Reckitt Benckiser Group Plc
- RSPL Group
- S.C. Johnson and Son Inc.
- Saraya Co. Ltd.
- The Clorox Co.
- Unilever PLC
- Venus Laboratories
Qualitative and quantitative analysis of companies has been conducted to help clients understand the wider business environment as well as the strengths and weaknesses of key industry players. Data is qualitatively analyzed to categorize companies as pure play, category-focused, industry-focused, and diversified; it is quantitatively analyzed to categorize companies as dominant, leading, strong, tentative, and weak.
Recent Development and News in Laundry care market
- In April 2025, Henkel announced its entire Sensitive Skin laundry detergent line across Europe and North America had been reformulated to be 100 percent plant-based and had received certification from Skin Health Alliance.
- In May 2025, Unilever announced the European launch of its Clean Future Refill stations in major retail chains, allowing consumers to bring their own containers to refill a new ultra-concentrated, plant-based liquid detergent.
- In March 2025, Procter and Gamble announced the European launch of its Tide Evo laundry sheets, a waterless format packaged in fully recyclable paperboard and engineered for maximum efficacy in cold wash cycles.
- In April 2025, Walmart expanded its private-label Great Value brand with a new line of hypoallergenic laundry products, including a detergent, fabric softener, and dryer sheets, to increase accessibility to gentle formulations.
Dive into Technavio’s robust research methodology, blending expert interviews, extensive data synthesis, and validated models for unparalleled Laundry Care Market insights. See full methodology.
| Market Scope | |
|---|---|
| Page number | 319 |
| Base year | 2025 |
| Historic period | 2020-2024 |
| Forecast period | 2026-2030 |
| Growth momentum & CAGR | Accelerate at a CAGR of 4% |
| Market growth 2026-2030 | USD 24733.9 million |
| Market structure | Fragmented |
| YoY growth 2025-2026(%) | 3.8% |
| Key countries | China, India, Japan, South Korea, Australia, Indonesia, US, Canada, Mexico, Germany, UK, France, Italy, Spain, The Netherlands, Brazil, Argentina, Colombia, Saudi Arabia, UAE, South Africa, Egypt and Turkey |
| Competitive landscape | Leading Companies, Market Positioning of Companies, Competitive Strategies, and Industry Risks |
Research Analyst Overview
- The market is at a pivotal juncture where sustainability is a core operational mandate. The industry-wide pivot to plant-based surfactants and biodegradable ingredients is redefining product development, with a strong emphasis on cold-water performance.
- This shift is visible in the proliferation of waterless detergent formats such as solid detergent sheets and dissolvable laundry pods, often presented in plastic-free packaging or compostable packaging. For boardroom consideration, the strategic challenge lies in balancing investment in advanced enzyme technology and optical brightener alternatives against the logistical complexities of deploying refillable packaging systems.
- Brands utilizing micro-encapsulation technology for fragrance and multi-chamber pods for combined benefits are leading premiumization trends. Formulations are also becoming more specialized, with hypoallergenic formulations, phosphate-free detergents, and low-sudsing formulations becoming standard. Innovations like laundry sanitizer additives and smart-dosing systems for auto-dosing detergents and concentrated liquid detergents are reshaping consumer habits.
- The transition away from petrochemical derivatives is critical, as firms that successfully adopt sustainable materials, including post-consumer recycled plastics, have seen brand trust metrics improve by over 15%.
What are the Key Data Covered in this Laundry Care Market Research and Growth Report?
-
What is the expected growth of the Laundry Care Market between 2026 and 2030?
-
USD 24.73 billion, at a CAGR of 4%
-
-
What segmentation does the market report cover?
-
The report is segmented by Distribution Channel (Offline, and Online), Product (Laundry detergent, Fabric softner, and Others), Application (Residential, and Commercial), Type (Liquids, Powders, Pods, Sheets, and Bar soaps) and Geography (APAC, North America, Europe, South America, Middle East and Africa)
-
-
Which regions are analyzed in the report?
-
APAC, North America, Europe, South America and Middle East and Africa
-
-
What are the key growth drivers and market challenges?
-
Imperative of sustainability and heightened eco-consciousness, Stringent sustainability mandates and mitigating environmental impact
-
-
Who are the major players in the Laundry Care Market?
-
Amway Corp., Church and Dwight Co. Inc., Colgate Palmolive Co., Fena Pvt. Ltd., Godrej Enterprises Group, Grove Collaborative Inc., Henkel AG and Co. KGaA, Jyothy Labs Ltd., Kao Corp., Lion Corp., Procter and Gamble Co., Puracy, PZ Cussons Plc, Reckitt Benckiser Group Plc, RSPL Group, S.C. Johnson and Son Inc., Saraya Co. Ltd., The Clorox Co., Unilever PLC and Venus Laboratories
-
Market Research Insights
- Market dynamics are increasingly shaped by consumer lifestyle shifts and the rapid expansion of e-commerce channel growth. The rise of direct-to-consumer (DTC) models has been particularly disruptive, with niche brands leveraging these platforms to achieve growth rates 30% higher than legacy retail channels.
- Subscription-based services are proving effective for brand loyalty cultivation, improving customer retention by over 20% in some cases. This digital-first environment fosters ingredient transparency, as consumers scrutinize formulations and favor brands that align with their values.
- In response, established players are navigating intense private label competition by accelerating product format innovation and emphasizing their own commitments to circular economy principles and sustainable sourcing to maintain market relevance.
We can help! Our analysts can customize this laundry care market research report to meet your requirements.
 RIA -
RIA - 
