Satellite Market Analysis North America, Europe, APAC, Middle East and Africa, South America - US, China, Japan, Russia, France - Size and Forecast 2024-2028

Satellite Market Analysis North America, Europe, APAC, Middle East and Africa, South America - US, China, Japan, Russia, France - Size and Forecast 2024-2028

Published: Oct 2023 172 Pages SKU: IRTNTR71145

Market Overview at a Glance

$14.53 B
Market Opportunity
3.31%
CAGR
2.94
YoY growth 2023-2024(%)

Satellite Market Size 2024-2028 

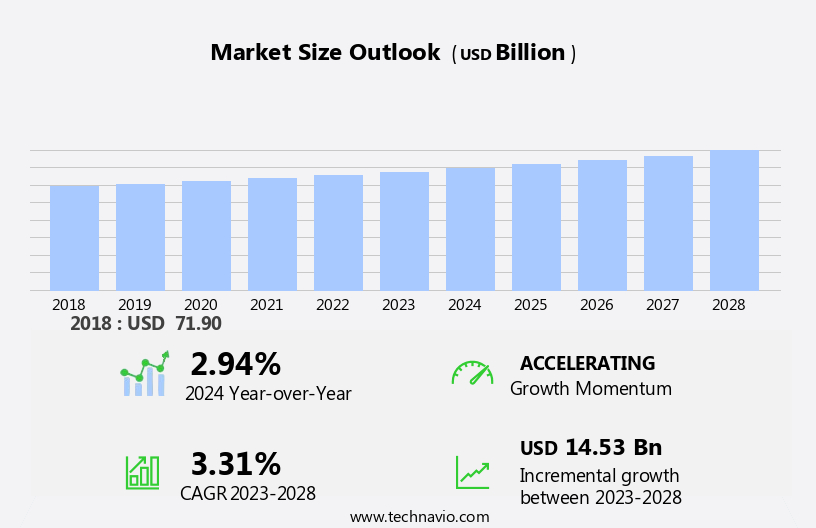
The satellite market size is forecast to increase by USD 14.53 billion at a CAGR of 3.31% between 2023 and 2028. The market is experiencing significant growth, driven by the increasing demand for DTH services and satellite-based telemetry applications. The number of DTH subscribers continues to rise, fueled by the availability of affordable satellite receivers. High-throughput satellites (HTS) are gaining popularity due to their ability to provide faster data transmission rates, making them ideal for IoT devices and other bandwidth-intensive applications. The high cost of satellite hardware and components remains a challenge, but innovations such as 3D-printed satellite parts are helping to reduce costs. OneWeb, among others, is leading the charge in this area, with plans to launch a constellation of low Earth orbit satellites to provide global connectivity. Overall, the market is poised for continued growth, driven by advancements in technology and increasing demand for reliable, high-speed connectivity.

Satellite Market Size

 Request Free Sample

The market is witnessing significant growth due to the increasing demand for artificial satellites in various applications such as communication, earth observation, navigation, scientific research, and space exploration. These satellites are launched into different orbits, including Low Earth Orbit (LEO), Medium Earth Orbit (MEO), and Geostationary Earth Orbit (GEO), depending on their function. Communication is a major application segment in the market, driving the demand for satellite services, including satellite-based internet services and voice communications. Earth observation is another significant application area, with satellite imaging playing a crucial role in areas like agriculture, forestry, and disaster management. High-throughput satellites and mega constellations, such as Starlink satellites, are emerging trends in the market, aiming to bridge the digital divide by providing internet access to remote and underserved areas.

Furthermore, space exploration missions and satellite-based warfare are other key applications driving the growth of the market. Small satellites are gaining popularity due to their cost-effectiveness and ease of deployment. Satellite data transmission is another crucial aspect of the market, with space data being used for various applications, including television and video distribution, digital television, and internet access. The market is witnessing significant investments from satellite enterprises, communication service providers, and space-focused firms.

Market Segmentation

The market research report provides comprehensive data (region-wise segment analysis), with forecasts and estimates in "USD Billion" for the period 2024-2028, as well as historical data from 2018-2022 for the following segments.

  • End-user
    • Civil
    • Defense
  • Type
    • Large
    • medium satellite
    • Small satellite
  • Geography
    • North America
      • US
    • Europe
      • France
    • APAC
      • China
      • Japan
    • Middle East and Africa
    • South America

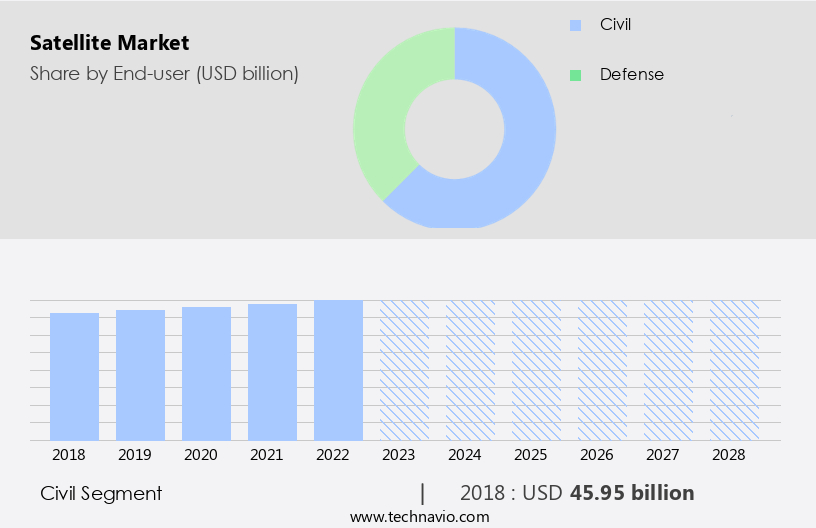
By End-user Insights

The civil segment is estimated to witness significant growth during the forecast period. Satellites play a crucial role in driving economic growth for various sectors, including commercial enterprises, government agencies, and the telecommunications and space industries. These technological marvels come in different forms, determined by their frequency, orbit, and mission objectives. With the escalating demand for Internet services and the growing number of mobile users, satellites have found extensive applications in civilian domains, such as voice communications, satellite-based internet services, and meteorology. Manufacturers of GPS receivers cater to the needs of civilians, particularly scientists and surveyors, who rely on these devices for precise time and position measurements for research and surveying purposes. Additionally, satellites contribute significantly to civil aviation, ensuring optimal navigational services and flight information region (FIR) coverage.

Satellite Market Size

Get a glance at the market share of various segments Request Free Sample

The civil segment was valued at USD 45.95 billion in 2018 and showed a gradual increase during the forecast period.

Regional Insights

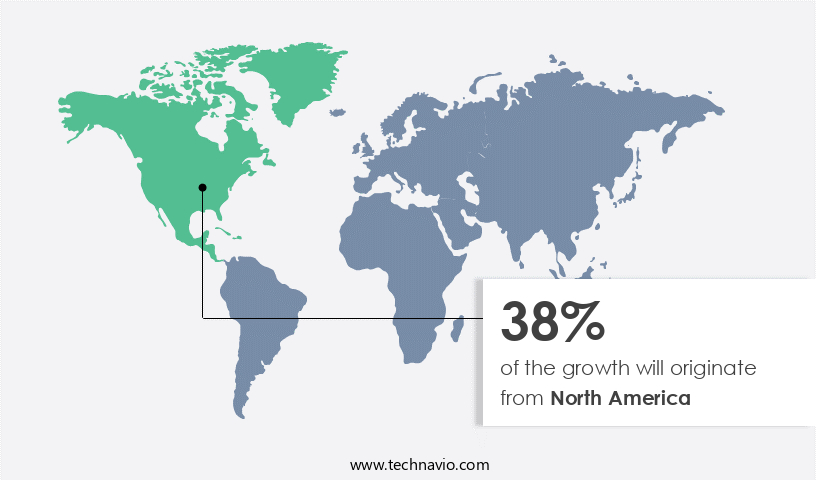
North America is estimated to contribute 38% to the growth of the global market during the forecast period. Technavio's analysts have elaborately explained the regional trends and drivers that shape the market during the forecast period.

Satellite Market Share by Geography

For more insights on the market share of various regions Request Free Sample

Satellite services play a crucial role in various applications, including satellite imaging, internet connectivity, and voice communications. North America is a significant market for these services, with the US, Canada, and Mexico being the primary consumers. The US, in particular, has a strong civil space sector, led by NASA, which focuses on maintaining four main activities: aeronautical research, exploration systems, science, and space operations. The demand for satellites in the US civil sector has risen, especially for navigation, communications, and location-based services (LBS). High-throughput satellites are increasingly being used to bridge the digital divide and provide satellite-based internet services to remote areas. Furthermore, space exploration missions also contribute significantly to the market in North America.

Our researchers analyzed the data with 2023 as the base year, along with the key drivers, trends, and challenges. A holistic analysis of drivers will help companies refine their marketing strategies to gain a competitive advantage.

Market Driver

The accelerating demand for satellite navigation equipment is the key driver of the market. Artificial satellites play a pivotal role in various applications, including communication, Earth observation, navigation, and scientific research. Orbiting the Earth at different altitudes, these satellites offer continuous coverage and early detection capabilities. For instance, they are utilized for strategic and tactical operations, such as monitoring enemy weapon development and pre-positioning military assets in strategic locations during potential conflicts. Communication satellites facilitate global connectivity, enabling voice and data transmission between distant regions.

Furthermore, Earth observation satellites provide valuable data for agriculture, environmental monitoring, and disaster management. Navigation satellites, such as GPS, enable precise location determination. Furthermore, LEO (Low Earth Orbit) satellites are increasingly being used for space exploration and scientific research. With advancements in technology, miniaturization, and collaboration, countries and organizations can access these capabilities through their own networks or partnerships.

Market Trends

The growing satellite-based telemetry applications is the upcoming trend in the market. Artificial satellites play a crucial role in various applications, including communication, Earth observation, navigation, and scientific research. Orbiting satellites enable the transmission of signals over vast distances, making them indispensable for global connectivity. In the realm of Earth observation, satellites provide valuable data for monitoring environmental changes, natural disasters, and urban development. Navigation systems, such as GPS, rely on satellites to determine precise locations.

Moreover, satellites facilitate scientific research in numerous domains. For instance, they are used to track the movements of animals and birds on Earth through radio signals transmitted from transmitters attached to the targets. The satellites calculate the distance between the transmitter and the satellite, enabling researchers to determine the transmitter's location on the ground. This technology has significant applications in fields like ecology, conservation, and wildlife management. Overall, the demand for satellite technology continues to grow, driven by the need for efficient communication, accurate navigation, and advanced scientific research.

Market Challenge

The high cost of satellite hardware and components is a key challenge affecting the market growth. Artificial satellites play a crucial role in various applications such as communication, Earth observation, navigation, scientific research, and space exploration. These satellites orbit the Earth at different altitudes, including Low Earth Orbit (LEO), Medium Earth Orbit (MEO), and Geostationary Earth Orbit (GEO). The development and manufacture of satellites entail significant challenges due to the extreme space environment and stringent security and certification requirements. Satellites have evolved to become larger, more complex, and costlier machines. Building a satellite involves extensive resources and financial support for design, construction, launch, and monitoring. Equipment and materials used in satellite manufacturing contribute significantly to the overall cost.

Transponders, which are essential components for communication, cost hundreds of thousands of dollars annually to maintain. The minimum cost of bandwidth per MHz is priced at approximately USD3,500 per month. Despite these challenges, the market continues to grow, driven by the increasing demand for advanced satellite technologies and applications.

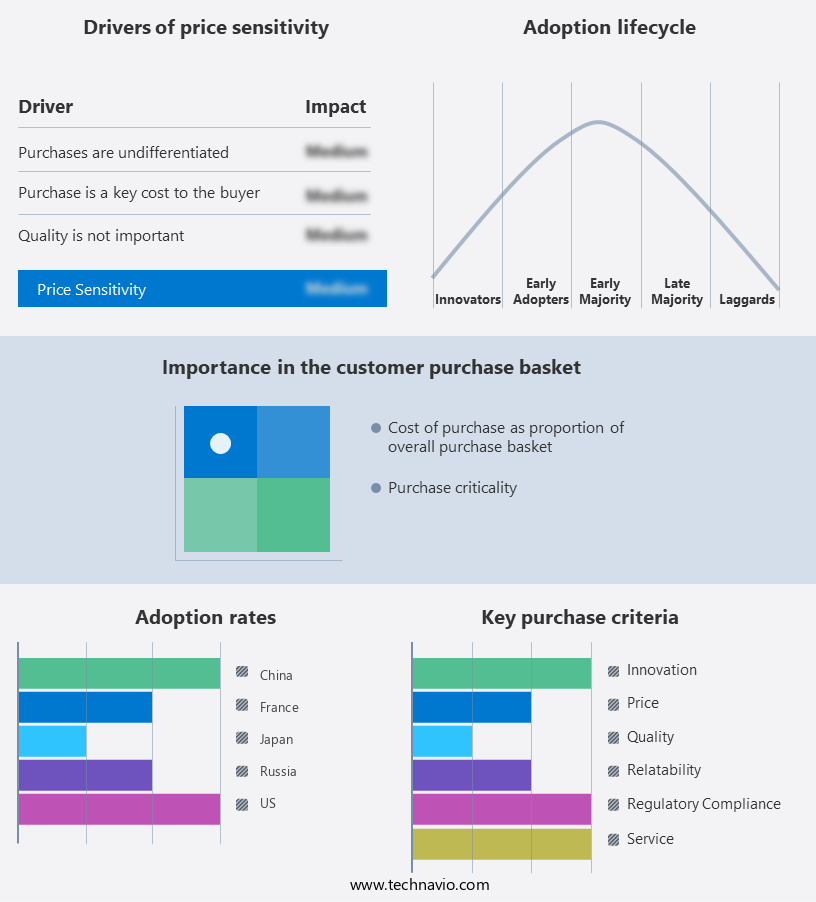
Exclusive Customer Landscape

The market forecasting report includes the adoption lifecycle of the market, covering from the innovator's stage to the laggard's stage. It focuses on adoption rates in different regions based on penetration. Furthermore, the report also includes key purchase criteria and drivers of price sensitivity to help companies evaluate and develop their market growth analysis strategies.

Satellite Market Share by Geography

 Customer Landscape

Key Companies & Market Insights

Companies are implementing various strategies, such as strategic alliances, partnerships, mergers and acquisitions, geographical expansion, and product/service launches, to enhance their presence in the market.

Airbus SE - The company offers satellites such as Optical Earth observation satellites, and Radar Earth observation satellites. 

The market research and growth report includes detailed analyses of the competitive landscape of the market and information about key companies, including:

  • AAC Clyde Space AB
  • Airbus SE
  • Ball Corp.
  • EnduroSat
  • Eutelsat SA
  • Gilat Satellite Networks Ltd.
  • Intelsat US LLC
  • Kongsberg Gruppen ASA
  • L3Harris Technologies Inc.
  • Leidos Holdings Inc.
  • Lockheed Martin Corp.
  • Maxar Technologies Inc.
  • Mitsubishi Electric Corp.
  • Northrop Grumman Corp.
  • OHB SE
  • Raytheon Technologies Corp.
  • Safran SA
  • Sierra Nevada Corp.
  • Space Exploration Technologies Corp.
  • Terran Orbital Corp.
  • Thales Group
  • The Boeing Co.

Qualitative and quantitative analysis of companies has been conducted to help clients understand the wider business environment as well as the strengths and weaknesses of key market players. Data is qualitatively analyzed to categorize companies as pure play, category-focused, industry-focused, and diversified; it is quantitatively analyzed to categorize companies as dominant, leading, strong, tentative, and weak.

Research Analyst Overview

The market is witnessing significant growth due to the increasing demand for artificial satellites in various applications such as communication, earth observation, navigation, and scientific research. The market is segmented based on orbit type and function. Low Earth Orbit (LEO) satellites dominate the market due to their ability to provide real-time data and services. Satellite services include communication, satellite-based internet services, digital television, and Direct-to-Home (DTH) services. High-throughput satellites (HTS) are gaining popularity due to their ability to provide high-speed internet connectivity, bridging the digital divide in remote areas. Space exploration missions, satellite-based warfare, and space data are other applications driving market growth.

Furthermore, mega constellations, such as Starlink satellites, OneWeb, and Amazon's Project Kuiper, are transforming the satellite industry with their large numbers of satellites in LEO. Satellite enterprises, communication service providers, and space-focused firms are investing in the development of small satellites, including nanosatellites, microsatellites, and minisatellites, for cost-effective solutions. Satellite data transmission is crucial for various applications, including IoT devices, weather forecasting, mapping and navigation, and surveillance and security. The market trends include the use of 3D-printed satellite parts, the integration of HTS in DTH services, and the growth of satellite receiver technology. Cable infrastructure and DTH subscribers are expected to decline due to the increasing popularity of satellite-based internet services and digital television.

Market Scope

Report Coverage

Details

Page number

172

Base year

2023

Historic period

2018-2022

Forecast period

2024-2028

Growth momentum & CAGR

Accelerate at a CAGR of 3.31%

Market growth 2024-2028

USD 14.53 billion

Market structure

Fragmented

YoY growth 2023-2024(%)

2.94

Regional analysis

North America, Europe, APAC, Middle East and Africa, and South America

Performing market contribution

North America at 38%

Key countries

US, China, Japan, Russia, and France

Competitive landscape

Leading Companies, Market Positioning of Companies, Competitive Strategies, and Industry Risks

Key companies profiled

AAC Clyde Space AB, Airbus SE, Ball Corp., EnduroSat, Eutelsat SA, Gilat Satellite Networks Ltd., Intelsat US LLC, Kongsberg Gruppen ASA, L3Harris Technologies Inc., Leidos Holdings Inc., Lockheed Martin Corp., Maxar Technologies Inc., Mitsubishi Electric Corp., Northrop Grumman Corp., OHB SE, Raytheon Technologies Corp., Safran SA, Sierra Nevada Corp., Space Exploration Technologies Corp., Terran Orbital Corp., Thales Group, and The Boeing Co.

Market dynamics

Parent market analysis, market growth inducers and obstacles, market forecast, fast-growing and slow-growing segment analysis, COVID-19 impact and recovery analysis and future consumer dynamics, market condition analysis for the forecast period

Customization purview

If our market report has not included the data that you are looking for, you can reach out to our analysts and get segments customized.

Request Free Sample

What are the Key Data Covered in this Market Research and Growth Report?

  • CAGR of the market during the forecast period
  • Detailed information on factors that will drive the market growth and forecasting between 2024 and 2028
  • Precise estimation of the size of the market  and its contribution of the market in focus to the parent market
  • Accurate predictions about upcoming market growth and trends and changes in consumer behaviour
  • Growth of the market across North America, Europe, APAC, Middle East and Africa, and South America
  • Thorough analysis of the market's competitive landscape and detailed information about companies
  • Comprehensive analysis of factors that will challenge the growth of market companies

We can help! Our analysts can customize this market research report to meet your requirements. Get in touch

1 Executive Summary

  • 1.1 Market overview
    • Exhibit 01: Executive Summary – Chart on Market Overview
    • Exhibit 02: Executive Summary – Data Table on Market Overview
    • Exhibit 03: Executive Summary – Chart on Global Market Characteristics
    • Exhibit 04: Executive Summary – Chart on Market by Geography
    • Exhibit 05: Executive Summary – Chart on Market Segmentation by End-user
    • Exhibit 06: Executive Summary – Chart on Market Segmentation by Type
    • Exhibit 07: Executive Summary – Chart on Incremental Growth
    • Exhibit 08: Executive Summary – Data Table on Incremental Growth
    • Exhibit 09: Executive Summary – Chart on Vendor Market Positioning

2 Market Landscape

  • 2.1 Market ecosystem
    • Exhibit 10: Parent market
    • Exhibit 11: Market Characteristics

3 Market Sizing

  • 3.1 Market definition
    • Exhibit 12: Offerings of vendors included in the market definition
  • 3.2 Market segment analysis
    • Exhibit 13: Market segments
  • 3.3 Market size 2023
    • 3.4 Market outlook: Forecast for 2023-2028
      • Exhibit 14: Chart on Global - Market size and forecast 2023-2028 ($ billion)
      • Exhibit 15: Data Table on Global - Market size and forecast 2023-2028 ($ billion)
      • Exhibit 16: Chart on Global Market: Year-over-year growth 2023-2028 (%)
      • Exhibit 17: Data Table on Global Market: Year-over-year growth 2023-2028 (%)

    4 Historic Market Size

    • 4.1 Global satellite market 2018 - 2022
      • Exhibit 18: Historic Market Size – Data Table on global satellite market 2018 - 2022 ($ billion)
    • 4.2 End-user Segment Analysis 2018 - 2022
      • Exhibit 19: Historic Market Size – End-user Segment 2018 - 2022 ($ billion)
    • 4.3 Type Segment Analysis 2018 - 2022
      • Exhibit 20: Historic Market Size – Type Segment 2018 - 2022 ($ billion)
    • 4.4 Geography Segment Analysis 2018 - 2022
      • Exhibit 21: Historic Market Size – Geography Segment 2018 - 2022 ($ billion)
    • 4.5 Country Segment Analysis 2018 - 2022
      • Exhibit 22: Historic Market Size – Country Segment 2018 - 2022 ($ billion)

    5 Five Forces Analysis

    • 5.1 Five forces summary
      • Exhibit 23: Five forces analysis - Comparison between 2023 and 2028
    • 5.2 Bargaining power of buyers
      • Exhibit 24: Chart on Bargaining power of buyers – Impact of key factors 2023 and 2028
    • 5.3 Bargaining power of suppliers
      • Exhibit 25: Bargaining power of suppliers – Impact of key factors in 2023 and 2028
    • 5.4 Threat of new entrants
      • Exhibit 26: Threat of new entrants – Impact of key factors in 2023 and 2028
    • 5.5 Threat of substitutes
      • Exhibit 27: Threat of substitutes – Impact of key factors in 2023 and 2028
    • 5.6 Threat of rivalry
      • Exhibit 28: Threat of rivalry – Impact of key factors in 2023 and 2028
    • 5.7 Market condition
      • Exhibit 29: Chart on Market condition - Five forces 2023 and 2028

    6 Market Segmentation by End-user

    • 6.1 Market segments
      • Exhibit 30: Chart on End-user - Market share 2023-2028 (%)
      • Exhibit 31: Data Table on End-user - Market share 2023-2028 (%)
    • 6.2 Comparison by End-user
      • Exhibit 32: Chart on Comparison by End-user
      • Exhibit 33: Data Table on Comparison by End-user
    • 6.3 Civil - Market size and forecast 2023-2028
      • Exhibit 34: Chart on Civil - Market size and forecast 2023-2028 ($ billion)
      • Exhibit 35: Data Table on Civil - Market size and forecast 2023-2028 ($ billion)
      • Exhibit 36: Chart on Civil - Year-over-year growth 2023-2028 (%)
      • Exhibit 37: Data Table on Civil - Year-over-year growth 2023-2028 (%)
    • 6.4 Defense - Market size and forecast 2023-2028
      • Exhibit 38: Chart on Defense - Market size and forecast 2023-2028 ($ billion)
      • Exhibit 39: Data Table on Defense - Market size and forecast 2023-2028 ($ billion)
      • Exhibit 40: Chart on Defense - Year-over-year growth 2023-2028 (%)
      • Exhibit 41: Data Table on Defense - Year-over-year growth 2023-2028 (%)
    • 6.5 Market opportunity by End-user
      • Exhibit 42: Market opportunity by End-user ($ billion)
      • Exhibit 43: Data Table on Market opportunity by End-user ($ billion)

    7 Market Segmentation by Type

    • 7.1 Market segments
      • Exhibit 44: Chart on Type - Market share 2023-2028 (%)
      • Exhibit 45: Data Table on Type - Market share 2023-2028 (%)
    • 7.2 Comparison by Type
      • Exhibit 46: Chart on Comparison by Type
      • Exhibit 47: Data Table on Comparison by Type
    • 7.3 Large and medium satellite - Market size and forecast 2023-2028
      • Exhibit 48: Chart on Large and medium satellite - Market size and forecast 2023-2028 ($ billion)
      • Exhibit 49: Data Table on Large and medium satellite - Market size and forecast 2023-2028 ($ billion)
      • Exhibit 50: Chart on Large and medium satellite - Year-over-year growth 2023-2028 (%)
      • Exhibit 51: Data Table on Large and medium satellite - Year-over-year growth 2023-2028 (%)
    • 7.4 Small satellite - Market size and forecast 2023-2028
      • Exhibit 52: Chart on Small satellite - Market size and forecast 2023-2028 ($ billion)
      • Exhibit 53: Data Table on Small satellite - Market size and forecast 2023-2028 ($ billion)
      • Exhibit 54: Chart on Small satellite - Year-over-year growth 2023-2028 (%)
      • Exhibit 55: Data Table on Small satellite - Year-over-year growth 2023-2028 (%)
    • 7.5 Market opportunity by Type
      • Exhibit 56: Market opportunity by Type ($ billion)
      • Exhibit 57: Data Table on Market opportunity by Type ($ billion)

    8 Customer Landscape

    • 8.1 Customer landscape overview
      • Exhibit 58: Analysis of price sensitivity, lifecycle, customer purchase basket, adoption rates, and purchase criteria

    9 Geographic Landscape

    • 9.1 Geographic segmentation
      • Exhibit 59: Chart on Market share by geography 2023-2028 (%)
      • Exhibit 60: Data Table on Market share by geography 2023-2028 (%)
    • 9.2 Geographic comparison
      • Exhibit 61: Chart on Geographic comparison
      • Exhibit 62: Data Table on Geographic comparison
    • 9.3 North America - Market size and forecast 2023-2028
      • Exhibit 63: Chart on North America - Market size and forecast 2023-2028 ($ billion)
      • Exhibit 64: Data Table on North America - Market size and forecast 2023-2028 ($ billion)
      • Exhibit 65: Chart on North America - Year-over-year growth 2023-2028 (%)
      • Exhibit 66: Data Table on North America - Year-over-year growth 2023-2028 (%)
    • 9.4 Europe - Market size and forecast 2023-2028
      • Exhibit 67: Chart on Europe - Market size and forecast 2023-2028 ($ billion)
      • Exhibit 68: Data Table on Europe - Market size and forecast 2023-2028 ($ billion)
      • Exhibit 69: Chart on Europe - Year-over-year growth 2023-2028 (%)
      • Exhibit 70: Data Table on Europe - Year-over-year growth 2023-2028 (%)
    • 9.5 APAC - Market size and forecast 2023-2028
      • Exhibit 71: Chart on APAC - Market size and forecast 2023-2028 ($ billion)
      • Exhibit 72: Data Table on APAC - Market size and forecast 2023-2028 ($ billion)
      • Exhibit 73: Chart on APAC - Year-over-year growth 2023-2028 (%)
      • Exhibit 74: Data Table on APAC - Year-over-year growth 2023-2028 (%)
    • 9.6 Middle East and Africa - Market size and forecast 2023-2028
      • Exhibit 75: Chart on Middle East and Africa - Market size and forecast 2023-2028 ($ billion)
      • Exhibit 76: Data Table on Middle East and Africa - Market size and forecast 2023-2028 ($ billion)
      • Exhibit 77: Chart on Middle East and Africa - Year-over-year growth 2023-2028 (%)
      • Exhibit 78: Data Table on Middle East and Africa - Year-over-year growth 2023-2028 (%)
    • 9.7 South America - Market size and forecast 2023-2028
      • Exhibit 79: Chart on South America - Market size and forecast 2023-2028 ($ billion)
      • Exhibit 80: Data Table on South America - Market size and forecast 2023-2028 ($ billion)
      • Exhibit 81: Chart on South America - Year-over-year growth 2023-2028 (%)
      • Exhibit 82: Data Table on South America - Year-over-year growth 2023-2028 (%)
    • 9.8 US - Market size and forecast 2023-2028
      • Exhibit 83: Chart on US - Market size and forecast 2023-2028 ($ billion)
      • Exhibit 84: Data Table on US - Market size and forecast 2023-2028 ($ billion)
      • Exhibit 85: Chart on US - Year-over-year growth 2023-2028 (%)
      • Exhibit 86: Data Table on US - Year-over-year growth 2023-2028 (%)
    • 9.9 China - Market size and forecast 2023-2028
      • Exhibit 87: Chart on China - Market size and forecast 2023-2028 ($ billion)
      • Exhibit 88: Data Table on China - Market size and forecast 2023-2028 ($ billion)
      • Exhibit 89: Chart on China - Year-over-year growth 2023-2028 (%)
      • Exhibit 90: Data Table on China - Year-over-year growth 2023-2028 (%)
    • 9.10 Russia - Market size and forecast 2023-2028
      • Exhibit 91: Chart on Russia - Market size and forecast 2023-2028 ($ billion)
      • Exhibit 92: Data Table on Russia - Market size and forecast 2023-2028 ($ billion)
      • Exhibit 93: Chart on Russia - Year-over-year growth 2023-2028 (%)
      • Exhibit 94: Data Table on Russia - Year-over-year growth 2023-2028 (%)
    • 9.11 France - Market size and forecast 2023-2028
      • Exhibit 95: Chart on France - Market size and forecast 2023-2028 ($ billion)
      • Exhibit 96: Data Table on France - Market size and forecast 2023-2028 ($ billion)
      • Exhibit 97: Chart on France - Year-over-year growth 2023-2028 (%)
      • Exhibit 98: Data Table on France - Year-over-year growth 2023-2028 (%)
    • 9.12 Japan - Market size and forecast 2023-2028
      • Exhibit 99: Chart on Japan - Market size and forecast 2023-2028 ($ billion)
      • Exhibit 100: Data Table on Japan - Market size and forecast 2023-2028 ($ billion)
      • Exhibit 101: Chart on Japan - Year-over-year growth 2023-2028 (%)
      • Exhibit 102: Data Table on Japan - Year-over-year growth 2023-2028 (%)
    • 9.13 Market opportunity by geography
      • Exhibit 103: Market opportunity by geography ($ billion)
      • Exhibit 104: Data Tables on Market opportunity by geography ($ billion)

    10 Drivers, Challenges, and Trends

    • 10.1 Market drivers
      • 10.2 Market challenges
        • 10.3 Impact of drivers and challenges
          • Exhibit 105: Impact of drivers and challenges in 2023 and 2028
        • 10.4 Market trends

          11 Vendor Landscape

          • 11.1 Overview
            • 11.2 Vendor landscape
              • Exhibit 106: Overview on Criticality of inputs and Factors of differentiation
            • 11.3 Landscape disruption
              • Exhibit 107: Overview on factors of disruption
            • 11.4 Industry risks
              • Exhibit 108: Impact of key risks on business

            12 Vendor Analysis

            • 12.1 Vendors covered
              • Exhibit 109: Vendors covered
            • 12.2 Market positioning of vendors
              • Exhibit 110: Matrix on vendor position and classification
            • 12.3 Airbus SE
              • Exhibit 111: Airbus SE - Overview
              • Exhibit 112: Airbus SE - Business segments
              • Exhibit 113: Airbus SE - Key news
              • Exhibit 114: Airbus SE - Key offerings
              • Exhibit 115: Airbus SE - Segment focus
            • 12.4 Ball Corp.
              • Exhibit 116: Ball Corp. - Overview
              • Exhibit 117: Ball Corp. - Business segments
              • Exhibit 118: Ball Corp. - Key offerings
              • Exhibit 119: Ball Corp. - Segment focus
            • 12.5 Gilat Satellite Networks Ltd.
              • Exhibit 120: Gilat Satellite Networks Ltd. - Overview
              • Exhibit 121: Gilat Satellite Networks Ltd. - Business segments
              • Exhibit 122: Gilat Satellite Networks Ltd. - Key offerings
              • Exhibit 123: Gilat Satellite Networks Ltd. - Segment focus
            • 12.6 Kongsberg Gruppen ASA
              • Exhibit 124: Kongsberg Gruppen ASA - Overview
              • Exhibit 125: Kongsberg Gruppen ASA - Business segments
              • Exhibit 126: Kongsberg Gruppen ASA - Key news
              • Exhibit 127: Kongsberg Gruppen ASA - Key offerings
              • Exhibit 128: Kongsberg Gruppen ASA - Segment focus
            • 12.7 L3Harris Technologies Inc.
              • Exhibit 129: L3Harris Technologies Inc. - Overview
              • Exhibit 130: L3Harris Technologies Inc. - Business segments
              • Exhibit 131: L3Harris Technologies Inc. - Key news
              • Exhibit 132: L3Harris Technologies Inc. - Key offerings
              • Exhibit 133: L3Harris Technologies Inc. - Segment focus
            • 12.8 Leidos Holdings Inc.
              • Exhibit 134: Leidos Holdings Inc. - Overview
              • Exhibit 135: Leidos Holdings Inc. - Business segments
              • Exhibit 136: Leidos Holdings Inc. - Key offerings
              • Exhibit 137: Leidos Holdings Inc. - Segment focus
            • 12.9 Lockheed Martin Corp.
              • Exhibit 138: Lockheed Martin Corp. - Overview
              • Exhibit 139: Lockheed Martin Corp. - Business segments
              • Exhibit 140: Lockheed Martin Corp. - Key news
              • Exhibit 141: Lockheed Martin Corp. - Key offerings
              • Exhibit 142: Lockheed Martin Corp. - Segment focus
            • 12.10 Maxar Technologies Inc.
              • Exhibit 143: Maxar Technologies Inc. - Overview
              • Exhibit 144: Maxar Technologies Inc. - Business segments
              • Exhibit 145: Maxar Technologies Inc. - Key offerings
              • Exhibit 146: Maxar Technologies Inc. - Segment focus
            • 12.11 Mitsubishi Electric Corp.
              • Exhibit 147: Mitsubishi Electric Corp. - Overview
              • Exhibit 148: Mitsubishi Electric Corp. - Business segments
              • Exhibit 149: Mitsubishi Electric Corp. - Key news
              • Exhibit 150: Mitsubishi Electric Corp. - Key offerings
              • Exhibit 151: Mitsubishi Electric Corp. - Segment focus
            • 12.12 Northrop Grumman Corp.
              • Exhibit 152: Northrop Grumman Corp. - Overview
              • Exhibit 153: Northrop Grumman Corp. - Business segments
              • Exhibit 154: Northrop Grumman Corp. - Key news
              • Exhibit 155: Northrop Grumman Corp. - Key offerings
              • Exhibit 156: Northrop Grumman Corp. - Segment focus
            • 12.13 Raytheon Technologies Corp.
              • Exhibit 157: Raytheon Technologies Corp. - Overview
              • Exhibit 158: Raytheon Technologies Corp. - Business segments
              • Exhibit 159: Raytheon Technologies Corp. - Key news
              • Exhibit 160: Raytheon Technologies Corp. - Key offerings
              • Exhibit 161: Raytheon Technologies Corp. - Segment focus
            • 12.14 Safran SA
              • Exhibit 162: Safran SA - Overview
              • Exhibit 163: Safran SA - Business segments
              • Exhibit 164: Safran SA - Key news
              • Exhibit 165: Safran SA - Key offerings
              • Exhibit 166: Safran SA - Segment focus
            • 12.15 Space Exploration Technologies Corp.
              • Exhibit 167: Space Exploration Technologies Corp. - Overview
              • Exhibit 168: Space Exploration Technologies Corp. - Product / Service
              • Exhibit 169: Space Exploration Technologies Corp. - Key offerings
            • 12.16 Thales Group
              • Exhibit 170: Thales Group - Overview
              • Exhibit 171: Thales Group - Business segments
              • Exhibit 172: Thales Group - Key news
              • Exhibit 173: Thales Group - Key offerings
              • Exhibit 174: Thales Group - Segment focus
            • 12.17 The Boeing Co.
              • Exhibit 175: The Boeing Co. - Overview
              • Exhibit 176: The Boeing Co. - Business segments
              • Exhibit 177: The Boeing Co. - Key offerings
              • Exhibit 178: The Boeing Co. - Segment focus

            13 Appendix

            • 13.1 Scope of the report
              • 13.2 Inclusions and exclusions checklist
                • Exhibit 179: Inclusions checklist
                • Exhibit 180: Exclusions checklist
              • 13.3 Currency conversion rates for US$
                • Exhibit 181: Currency conversion rates for US$
              • 13.4 Research methodology
                • Exhibit 182: Research methodology
                • Exhibit 183: Validation techniques employed for market sizing
                • Exhibit 184: Information sources
              • 13.5 List of abbreviations
                • Exhibit 185: List of abbreviations

              Research Methodology

              Technavio presents a detailed picture of the market by way of study, synthesis, and summation of data from multiple sources. The analysts have presented the various facets of the market with a particular focus on identifying the key industry influencers. The data thus presented is comprehensive, reliable, and the result of extensive research, both primary and secondary.

              INFORMATION SOURCES

              Primary sources

              • Manufacturers and suppliers
              • Channel partners
              • Industry experts
              • Strategic decision makers

              Secondary sources

              • Industry journals and periodicals
              • Government data
              • Financial reports of key industry players
              • Historical data
              • Press releases

              DATA ANALYSIS

              Data Synthesis

              • Collation of data
              • Estimation of key figures
              • Analysis of derived insights

              Data Validation

              • Triangulation with data models
              • Reference against proprietary databases
              • Corroboration with industry experts

              REPORT WRITING

              Qualitative

              • Market drivers
              • Market challenges
              • Market trends
              • Five forces analysis

              Quantitative

              • Market size and forecast
              • Market segmentation
              • Geographical insights
              • Competitive landscape

              Interested in this report?

              Get your sample now to see our research methodology and insights!

              Download Now

              Frequently Asked Questions

              Satellite market growth will increase by $ 14.53 bn during 2024-2028 .

              The Satellite market is expected to grow at a CAGR of 3.31% during 2024-2028 .

              Satellite market is segmented by End-user( Civil, Defense) Type( Large, medium satellite, Small satellite, MEA, South America)

              AAC Clyde Space AB, Airbus SE, Ball Corp., EnduroSat, Eutelsat SA, Gilat Satellite Networks Ltd., Intelsat US LLC, Kongsberg Gruppen ASA, L3Harris Technologies Inc., Leidos Holdings Inc., Lockheed Martin Corp., Maxar Technologies Inc., Mitsubishi Electric Corp., Northrop Grumman Corp., OHB SE, Raytheon Technologies Corp., Safran SA, Sierra Nevada Corp., Space Exploration Technologies Corp., Terran Orbital Corp., Thales Group, The Boeing Co. are a few of the key vendors in the Satellite market.

              North America will register the highest growth rate of 38% among the other regions. Therefore, the Satellite market in North America is expected to garner significant business opportunities for the vendors during the forecast period.

              US, China, Japan, Russia, France

              • Accelerating demand for satellite navigation equipmentSatellites are primarily used for specific mission profiles is the driving factor this market.
              • such as surveillance is the driving factor this market.
              • reconnaissance is the driving factor this market.
              • and navigation. They can provide continuous coverage of the area and can be used for the early detection of intercontinental ballistic missile launches. Satellites can carry out both strategic and tactical operations. For example is the driving factor this market.
              • satellites support strategic targeting by not only monitoring the development of weapons by the enemy but also pre-determining the deployment of military assets in strategic vantage points in the event of an armed conflict. With the advent of smart sensors and miniature satellites is the driving factor this market.
              • many countries have developed military satellite networks or cooperated with technology partners to access technologies according to their needs. Several development projects will create potential market opportunities for command-and-control solutions to monitor these satellites. Hence is the driving factor this market.
              • the focus on the local development of appropriate command and control systems is increasing. These developments are expected to lead to the growth of the global satellite market during the forecast period. is the driving factor this market.

              The Satellite market vendors should focus on grabbing business opportunities from the Civil segment as it accounted for the largest market share in the base year.