School Stationery Supplies Market Analysis, Size, and Forecast 2026-2030: APAC (China, Japan, and India), Europe (Germany, UK, and France), North America (US, Canada, and Mexico), South America (Brazil and Argentina), Middle East and Africa (Saudi Arabia, UAE, and South Africa), and Rest of World (ROW)

School Stationery Supplies Market Analysis, Size, and Forecast 2026-2030:
APAC (China, Japan, and India), Europe (Germany, UK, and France), North America (US, Canada, and Mexico), South America (Brazil and Argentina), Middle East and Africa (Saudi Arabia, UAE, and South Africa), and Rest of World (ROW)

Published: Mar 2026 289 Pages SKU: IRTNTR43722

Market Overview at a Glance

$12.28 B
Market Opportunity
2.2%
CAGR 2025 - 2030
42.1%
APAC Growth
$48.12 B
Paper products segment 2024

School Stationery Supplies Market Size 2026-2030

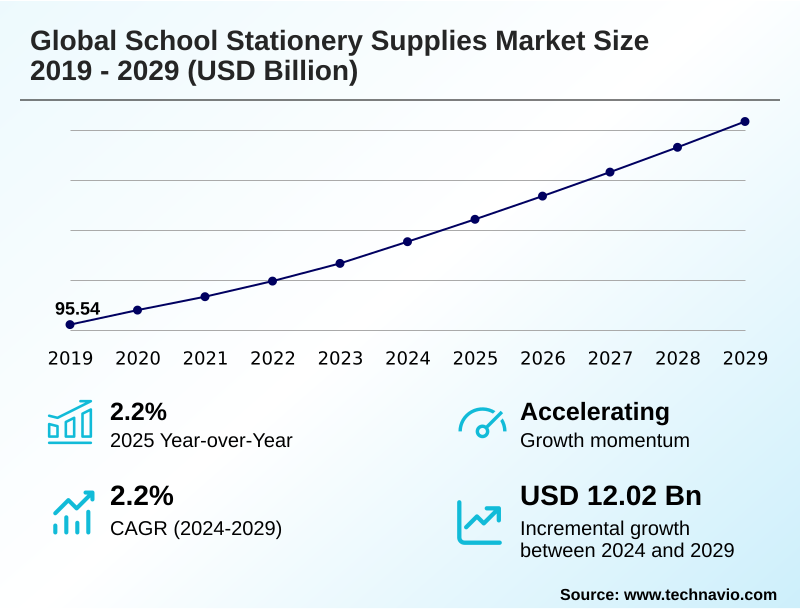
The school stationery supplies market size is valued to increase by USD 12.28 billion, at a CAGR of 2.2% from 2025 to 2030. Sustainable material sourcing and eco-conscious lifecycles will drive the school stationery supplies market.

Major Market Trends & Insights

  • APAC dominated the market and accounted for a 42.1% growth during the forecast period.
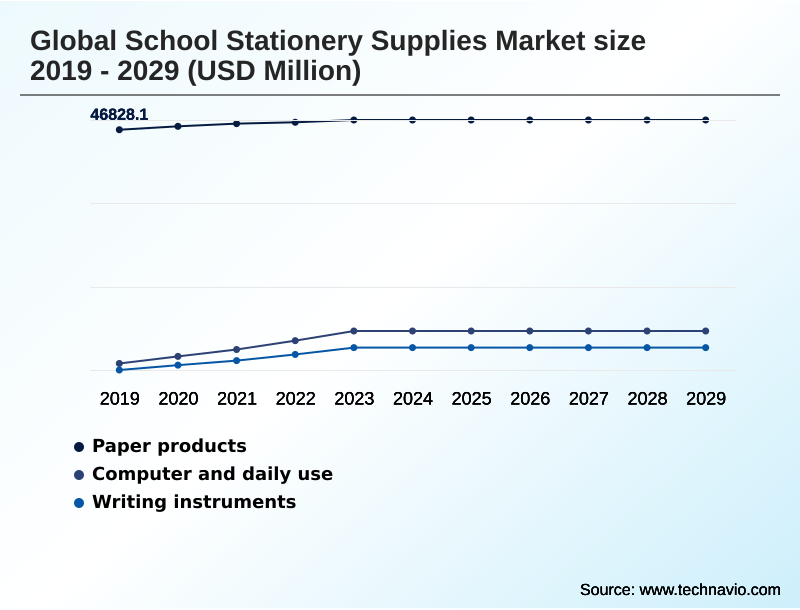
  • By Product - Paper products segment was valued at USD 48.12 billion in 2024
  • By Distribution Channel - Offline segment accounted for the largest market revenue share in 2024

Market Size & Forecast

  • Market Opportunities: USD 21.35 billion
  • Market Future Opportunities: USD 12.28 billion
  • CAGR from 2025 to 2030 : 2.2%

Market Summary

  • The school stationery supplies market is undergoing a structural transformation shaped by the imperatives of sustainability and digitalization. While the rise of educational technology challenges traditional consumables, the market is expanding through the premiumization of core supplies and the emergence of specialized creative tools.
  • This growth is supported by rising student enrollment in developing regions and a systemic shift toward personalized learning kits. As schools and parents increasingly prioritize non-toxic, sustainable, and ethically sourced materials, the landscape is being redefined by products with verified ecological benefits.
  • A key operational challenge involves supply chain optimization, where manufacturers must balance the volatile costs of raw materials like pulp and petroleum-derived resins with the demand for affordable, eco-friendly products. This requires sophisticated inventory management and diversified sourcing strategies to maintain profitability.
  • Simultaneously, the market is benefiting from smart stationery, such as notebooks compatible with digital scanning, which keeps traditional tools relevant. The convergence of sustainable material science, data-driven logistics, and digital integration will be the primary driver of market expansion, ensuring school stationery remains an essential component of the educational experience.

What will be the Size of the School Stationery Supplies Market during the forecast period?

Get Key Insights on Market Forecast (PDF) Request Free Sample

How is the School Stationery Supplies Market Segmented?

The school stationery supplies industry research report provides comprehensive data (region-wise segment analysis), with forecasts and estimates in "USD million" for the period 2026-2030, as well as historical data from 2020-2024 for the following segments.

  • Product
    • Paper products
    • Computer and daily use
    • Writing instruments
  • Distribution channel
    • Offline
    • Online
  • Price range
    • Low
    • Medium
    • High
  • Geography
    • APAC
      • China
      • Japan
      • India
    • Europe
      • Germany
      • UK
      • France
    • North America
      • US
      • Canada
      • Mexico
    • South America
      • Brazil
      • Argentina
    • Middle East and Africa
      • Saudi Arabia
      • UAE
      • South Africa
    • Rest of World (ROW)

By Product Insights

The paper products segment is estimated to witness significant growth during the forecast period.

The paper products segment is undergoing a significant transformation, driven by a market-wide pivot toward sustainable material sourcing and eco-conscious product lifecycles.

This shift prioritizes guilt-free consumption, with a growing demand for fsc-certified wood products and items made from recycled fibers over virgin paper products.

This emphasis on environmental stewardship and tactile learning has led to innovations in bio-based plastics for binders and non-toxic soy-based inks for notebooks.

A key industry benchmark was achieved as leading manufacturers reported that 88% of their paper and packaging portfolio is now fully reusable, recyclable, or compostable, reflecting the successful implementation of circular economy principles.

This transition includes the development of mono-material packaging and tactile tools designed for durability, fundamentally altering production and consumer expectations.

Request Free Sample

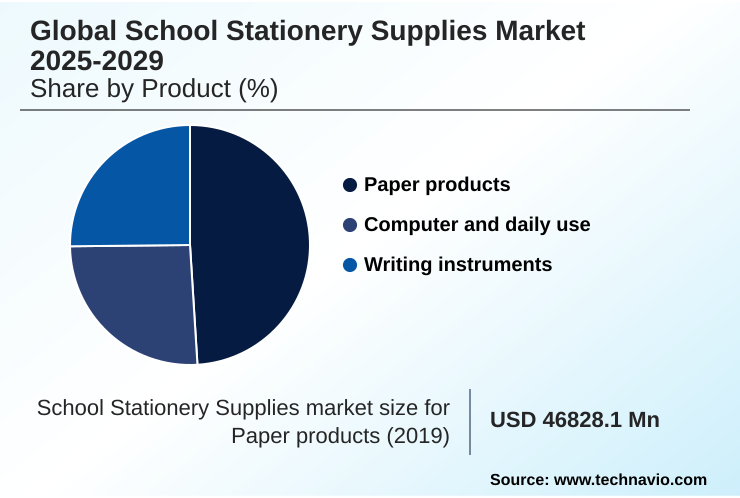
The Paper products segment was valued at USD 48.12 billion in 2024 and showed a gradual increase during the forecast period.

Request Free Sample

Regional Analysis

APAC is estimated to contribute 42.1% to the growth of the global market during the forecast period.Technavio’s analysts have elaborately explained the regional trends and drivers that shape the market during the forecast period.

See How School Stationery Supplies Market Demand is Rising in APAC Request Free Sample

The APAC region is the primary engine of the market, accounting for over 40% of global share and 42.1% of projected incremental growth. This dominance is fueled by large student populations and government-led inclusive literacy initiatives.

While this region sees high-volume demand for basic supplies, there is a burgeoning market for high-functionality items with features like smudge-proof inks and lead-rotation technology, particularly in Japan and South Korea.

In contrast, European markets emphasize sustainability, with strong demand for products made from upcycled materials and featuring non-toxic water-based inks. North America is a hub for blended learning models, driving innovation in products with augmented reality triggers.

In the Middle East, a focus on premiumization is evident in the demand for luxury packaging and stationery with unique attributes like scented inks, reflecting different paths to market maturity and addressing distinct consumer values related to educational equity and experiential retail.

Market Dynamics

Our researchers analyzed the data with 2025 as the base year, along with the key drivers, trends, and challenges. A holistic analysis of drivers will help companies refine their marketing strategies to gain a competitive advantage.

  • The future of the school stationery supplies market 2026-2030 trends is being shaped by a nuanced discourse around educational efficacy and sustainability. A key area of focus is understanding the benefits of tactile tools for cognitive development, which provides a strong counterargument to the challenges of transitioning to paperless educational models.
  • This has spurred deep analysis into the market for modular storage solutions for hybrid learning and the technologies behind cloud-enabled notebooks for students. Concurrently, the impact of biodegradable polymers on stationery manufacturing is a critical topic, alongside assessing the impact of raw material volatility, particularly the supply chain challenges for petroleum-derived resins.
  • This has accelerated the role of fsc-certified wood products in schools and the implementation of circular procurement for school districts. Firms are now required to demonstrate compliance with extended producer responsibility regulations, which includes a demand for mono-material packaging in consumer goods.
  • From a product perspective, companies are comparing smart pens versus traditional writing instruments, noting the advantages of refillable ecosystems in educational settings. Product development is increasingly focused on ergonomic designs for students with physical disabilities and the growth of aesthetic minimalism in classroom supplies.
  • This includes the integration of conductive inks in interactive paper and creating personalized learning tools for neurodivergent profiles, including multi-sensory educational supplies for early childhood.
  • This strategic shift toward sustainable and user-centric design has led to a reduction in plastic waste that is more than double the rate seen in previous years, underscoring the future of hybrid physical-digital tools in education.

What are the key market drivers leading to the rise in the adoption of School Stationery Supplies Industry?

  • The shift toward sustainable material sourcing and the adoption of eco-conscious product lifecycles are key drivers propelling market growth.

  • Key market drivers are centered on sustainable material sourcing and the premiumization of personalized learning tools.
  • The push for carbon-neutral supply chains has boosted the adoption of biodegradable polymers and other eco-friendly materials, with institutional procurement mandates for such products increasing by 15%.
  • This shift supports the development of products with inclusive design principles and ergonomic designs. The growth of physical-digital interfaces, powered by conductive inks and specialized sensors, is creating new categories like cloud-enabled notebooks.
  • This technological integration addresses the needs of students with neurodivergent learning profiles by offering multi-sensory elements.
  • However, this innovation comes at a cost, with some manufacturers considering price hikes of up to 6% to offset R&D and material expenses, indicating a strategic move toward higher-value offerings.

What are the market trends shaping the School Stationery Supplies Industry?

  • The institutionalization of sustainable materiality and the adoption of circular procurement models are emerging as a significant market trend, reshaping product lifecycles and purchasing criteria.

  • Key market trends are converging around aesthetic minimalism and smart organization systems. The demand for sensory-focused design is driving the adoption of products with soft-touch finishes and textured grips, creating a mindful learning experience. This is complemented by the rise of hyper-personalization, where omnichannel excellence in retail allows for custom products.
  • This trend was validated when a leading customization firm reported a 7% revenue increase driven by bespoke stationery. The integration of technology is evident in the popularity of digital stylus pens and notebooks with scannable page markers. Modular storage solutions are becoming essential for hybrid students.
  • Meanwhile, a push for sustainability is promoting refillable ecosystems, with online channels now being the preferred purchasing destination for 55% of K-12 shoppers, signaling a definitive shift in consumer behavior.

What challenges does the School Stationery Supplies Industry face during its growth?

  • The intensification of digital integration and competitive pressure from paperless educational models present a key challenge to industry growth.

  • The market faces significant challenges from digital integration and raw material volatility. The widespread adoption of paperless educational models has contributed to a 43% decline in demand for certain paper-based products, forcing a greater focus on enhancing tactile motor skills with specialized tools like smart pens. This shift requires investment in technologies like electromagnetic resonance technology.
  • Concurrently, price instability in petroleum-derived resins and other inputs necessitates the adoption of expensive inventory-tracking software. The push for regulatory compliance and zero-waste initiatives is driving a move toward circular procurement, favoring bio-polymers, grs-certified recycled fabrics, and recyclable components. This transition away from an eco-conscious product lifecycle based on disposability adds significant operational and financial pressure, challenging legacy business models.

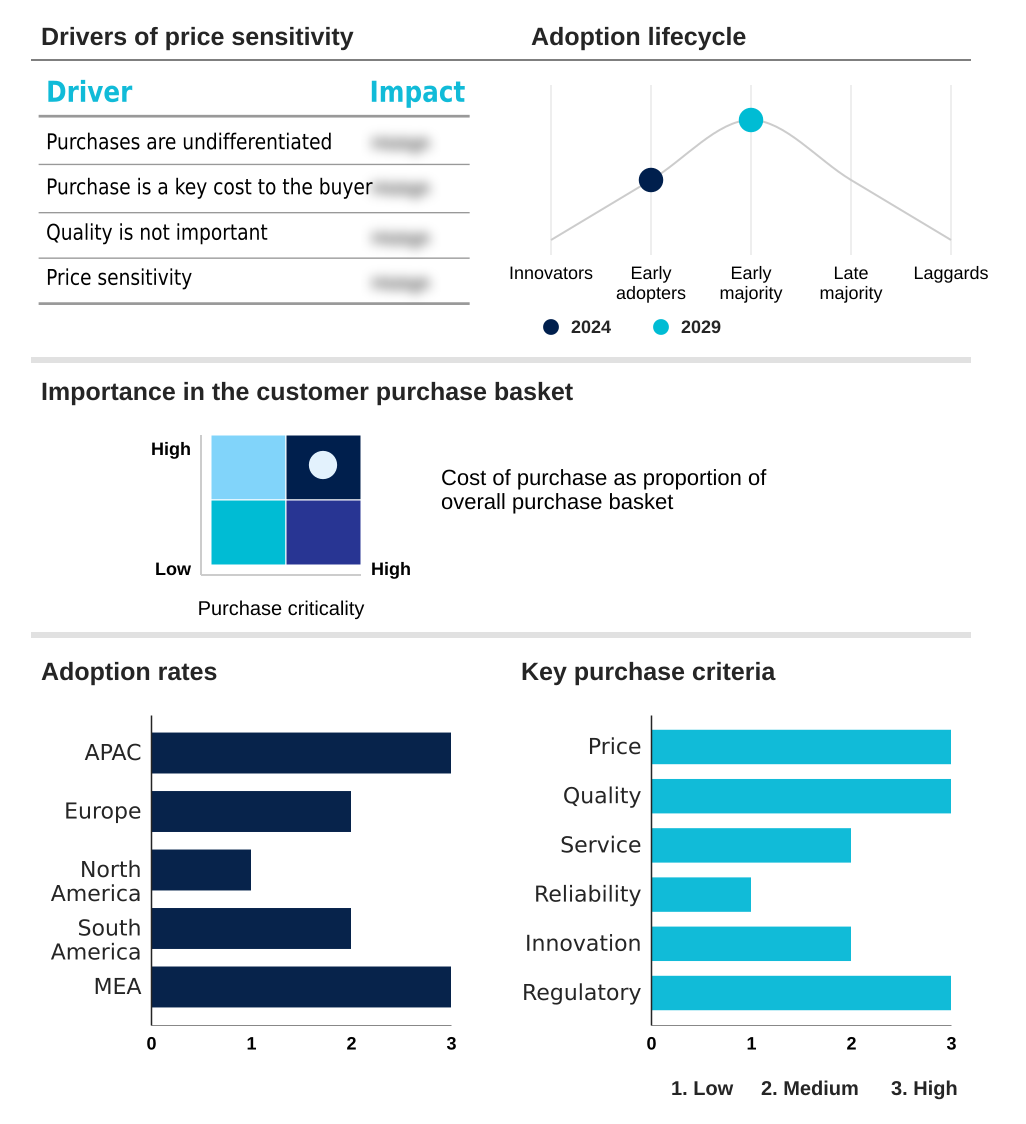
Exclusive Technavio Analysis on Customer Landscape

The school stationery supplies market forecasting report includes the adoption lifecycle of the market, covering from the innovator’s stage to the laggard’s stage. It focuses on adoption rates in different regions based on penetration. Furthermore, the school stationery supplies market report also includes key purchase criteria and drivers of price sensitivity to help companies evaluate and develop their market growth analysis strategies.

Customer Landscape of School Stationery Supplies Industry

Competitive Landscape

Companies are implementing various strategies, such as strategic alliances, school stationery supplies market forecast, partnerships, mergers and acquisitions, geographical expansion, and product/service launches, to enhance their presence in the industry.

3M Co. - Offerings center on adhesive note products and organizational tools, engineered to enhance productivity and streamline information management across various applications.

The industry research and growth report includes detailed analyses of the competitive landscape of the market and information about key companies, including:

  • 3M Co.
  • ACCO Brands Corp.
  • Avery Products Corp
  • Beifa Group
  • Crayola
  • DOMS Industries Ltd
  • Faber Castell AG
  • Hindustan Pencils Pvt. Ltd.
  • ITC Ltd.
  • Kokuyo Camlin Ltd
  • Maped Helix
  • Newell Brands Inc.
  • Onyx and Green Corp.
  • Pelikan International Corp.
  • Pentel of America Ltd.
  • PILOT Corp
  • Shanghai M and G Stationery Inc.
  • Societe Bic S.A
  • Staedtler Mars GmbH
  • Zebra Pen Corp.

Qualitative and quantitative analysis of companies has been conducted to help clients understand the wider business environment as well as the strengths and weaknesses of key industry players. Data is qualitatively analyzed to categorize companies as pure play, category-focused, industry-focused, and diversified; it is quantitatively analyzed to categorize companies as dominant, leading, strong, tentative, and weak.

Recent Development and News in School stationery supplies market

  • In March, 2025, DOMS Industries Ltd. advanced its strategic consolidation by extending the timeline for its full acquisition of Pioneer Stationery, a move aimed at enhancing its domestic manufacturing capabilities and expanding its portfolio in the premium paper stationery segment.
  • In February, 2025, Faber-Castell AG reinforced its commitment to corporate responsibility by publishing updated sustainability metrics, highlighting significant progress in achieving carbon-neutral production and increasing the use of FSC-certified wood in its products.
  • In January, 2025, Newell Brands Inc. announced a strategic acceleration of its innovation pipeline, coupled with increased advertising expenditure, to drive growth in core categories while implementing global productivity measures, including targeted workforce reductions.
  • In November, 2024, Cimpress N.V. reported a 7% year-over-year revenue increase, attributing the growth to a surge in demand for personalized and bespoke stationery products that cater to the evolving needs of hybrid learning environments.

Dive into Technavio’s robust research methodology, blending expert interviews, extensive data synthesis, and validated models for unparalleled School Stationery Supplies Market insights. See full methodology.

Market Scope
Page number 289
Base year 2025
Historic period 2020-2024
Forecast period 2026-2030
Growth momentum & CAGR Accelerate at a CAGR of 2.2%
Market growth 2026-2030 USD 12275.4 million
Market structure Fragmented
YoY growth 2025-2026(%) 2.2%
Key countries China, Japan, India, South Korea, Indonesia, Australia, Germany, UK, France, Italy, Spain, The Netherlands, US, Canada, Mexico, Brazil, Argentina, Chile, Saudi Arabia, UAE, South Africa, Egypt and Nigeria
Competitive landscape Leading Companies, Market Positioning of Companies, Competitive Strategies, and Industry Risks

Request Free Sample

Research Analyst Overview

  • The market's evolution is defined by a sophisticated push toward advanced material science and digital functionality. A primary boardroom focus is the adoption of sustainable inputs, with institutional procurement mandates for eco-friendly products increasing by 15%. This has accelerated the use of biodegradable polymers, bio-polymers, and bio-based plastics over traditional petroleum-derived resins.
  • Manufacturers are replacing virgin paper products with fsc-certified wood products and recycled fibers. The innovation extends to components, including non-toxic water-based inks, soy-based inks, and scented inks, all formulated to be smudge-proof inks. Product design now integrates ergonomic designs, tactile tools with soft-touch finishes, textured grips, and multi-sensory elements for enhanced tactile motor skills and to support inclusive design principles.
  • In technology, smart pens leveraging electromagnetic resonance technology and digital stylus pens are becoming standard. These are complemented by cloud-enabled notebooks with scannable page markers and augmented reality triggers, all powered by specialized sensors and conductive inks. Even traditional items are being reinvented, with dual-tip highlighters and mechanical pencils featuring lead-rotation technology.
  • The landscape is shifting toward refillable ecosystems with recyclable components and mono-material packaging, alongside luxury packaging made from upcycled materials, creating a circular and premium product lifecycle.

What are the Key Data Covered in this School Stationery Supplies Market Research and Growth Report?

  • What is the expected growth of the School Stationery Supplies Market between 2026 and 2030?

    • USD 12.28 billion, at a CAGR of 2.2%

  • What segmentation does the market report cover?

    • The report is segmented by Product (Paper products, Computer and daily use, and Writing instruments), Distribution Channel (Offline, and Online), Price Range (Low, Medium, and High) and Geography (APAC, Europe, North America, South America, Middle East and Africa)

  • Which regions are analyzed in the report?

    • APAC, Europe, North America, South America and Middle East and Africa

  • What are the key growth drivers and market challenges?

    • Sustainable material sourcing and eco-conscious lifecycles, Intensification of digital integration and competitive pressure of paperless educational

  • Who are the major players in the School Stationery Supplies Market?

    • 3M Co., ACCO Brands Corp., Avery Products Corp, Beifa Group, Crayola, DOMS Industries Ltd, Faber Castell AG, Hindustan Pencils Pvt. Ltd., ITC Ltd., Kokuyo Camlin Ltd, Maped Helix, Newell Brands Inc., Onyx and Green Corp., Pelikan International Corp., Pentel of America Ltd., PILOT Corp, Shanghai M and G Stationery Inc., Societe Bic S.A, Staedtler Mars GmbH and Zebra Pen Corp.

Market Research Insights

  • The market is navigating a complex dynamic where the push for paperless educational models, which has led to a 43% decline in demand for traditional paper products in some tech-forward regions, coexists with a strong consumer desire for tactile learning experiences. This duality forces a strategic pivot toward high-functionality items and premiumization.
  • The rise of omnichannel excellence is reshaping distribution, as evidenced by online retailers becoming the primary destination for 55% of K-12 supply shoppers. This shift necessitates that legacy players accelerate their digital integration to compete.
  • In this environment, raw material volatility and regulatory compliance add layers of complexity, compelling firms to adopt more resilient carbon-neutral supply chains and embrace circular economy principles to maintain a competitive edge and align with evolving consumer values around environmental stewardship.

We can help! Our analysts can customize this school stationery supplies market research report to meet your requirements.

Get in touch

1. Executive Summary

1.1 Market overview

Executive Summary - Chart on Market Overview
Executive Summary - Data Table on Market Overview
Executive Summary - Chart on Global Market Characteristics
Executive Summary - Chart on Market by Geography
Executive Summary - Chart on Market Segmentation by Product
Executive Summary - Chart on Market Segmentation by Distribution Channel
Executive Summary - Chart on Market Segmentation by Price Range
Executive Summary - Chart on Incremental Growth
Executive Summary - Data Table on Incremental Growth
Executive Summary - Chart on Company Market Positioning

2. Technavio Analysis

2.1 Analysis of price sensitivity, lifecycle, customer purchase basket, adoption rates, and purchase criteria

2.2 Criticality of inputs and Factors of differentiation

Chart on Overview on criticality of inputs and factors of differentiation

2.3 Factors of disruption

Chart on Overview on factors of disruption

2.4 Impact of drivers and challenges

Chart on Impact of drivers and challenges in 2025 and 2030

3. Market Landscape

3.1 Market ecosystem

Chart on Parent Market
Data Table on - Parent Market

3.2 Market characteristics

Chart on Market characteristics analysis

3.3 Value chain analysis

Chart on Value chain analysis

4. Market Sizing

4.1 Market definition

Data Table on Offerings of companies included in the market definition

4.2 Market segment analysis

Market segments

4.3 Market size 2025

4.4 Market outlook: Forecast for 2025-2030

Chart on Global - Market size and forecast 2025-2030 ($ million)
Data Table on Global - Market size and forecast 2025-2030 ($ million)
Chart on Global Market: Year-over-year growth 2025-2030 (%)
Data Table on Global Market: Year-over-year growth 2025-2030 (%)

5. Historic Market Size

5.1 Global School Stationery Supplies Market 2020 - 2024

Historic Market Size - Data Table on Global School Stationery Supplies Market 2020 - 2024 ($ million)

5.2 Product segment analysis 2020 - 2024

Historic Market Size - Product Segment 2020 - 2024 ($ million)

5.3 Distribution Channel segment analysis 2020 - 2024

Historic Market Size - Distribution Channel Segment 2020 - 2024 ($ million)

5.4 Price Range segment analysis 2020 - 2024

Historic Market Size - Price Range Segment 2020 - 2024 ($ million)

5.5 Geography segment analysis 2020 - 2024

Historic Market Size - Geography Segment 2020 - 2024 ($ million)

5.6 Country segment analysis 2020 - 2024

Historic Market Size - Country Segment 2020 - 2024 ($ million)

6. Qualitative Analysis

6.1 Impact of AI in global school stationery supplies market

6.2 Impact of geopolitical conflict for global school stationery supplies market

7. Five Forces Analysis

7.1 Five forces summary

Five forces analysis - Comparison between 2025 and 2030

7.2 Bargaining power of buyers

Bargaining power of buyers - Impact of key factors 2025 and 2030

7.3 Bargaining power of suppliers

Bargaining power of suppliers - Impact of key factors in 2025 and 2030

7.4 Threat of new entrants

Threat of new entrants - Impact of key factors in 2025 and 2030

7.5 Threat of substitutes

Threat of substitutes - Impact of key factors in 2025 and 2030

7.6 Threat of rivalry

Threat of rivalry - Impact of key factors in 2025 and 2030

7.7 Market condition

Chart on Market condition - Five forces 2025 and 2030

8. Market Segmentation by Product

8.1 Market segments

Chart on Product - Market share 2025-2030 (%)
Data Table on Product - Market share 2025-2030 (%)

8.2 Comparison by Product

Chart on Comparison by Product
Data Table on Comparison by Product

8.3 Paper products - Market size and forecast 2025-2030

Chart on Paper products - Market size and forecast 2025-2030 ($ million)
Data Table on Paper products - Market size and forecast 2025-2030 ($ million)
Chart on Paper products - Year-over-year growth 2025-2030 (%)
Data Table on Paper products - Year-over-year growth 2025-2030 (%)

8.4 Computer and daily use - Market size and forecast 2025-2030

Chart on Computer and daily use - Market size and forecast 2025-2030 ($ million)
Data Table on Computer and daily use - Market size and forecast 2025-2030 ($ million)
Chart on Computer and daily use - Year-over-year growth 2025-2030 (%)
Data Table on Computer and daily use - Year-over-year growth 2025-2030 (%)

8.5 Writing instruments - Market size and forecast 2025-2030

Chart on Writing instruments - Market size and forecast 2025-2030 ($ million)
Data Table on Writing instruments - Market size and forecast 2025-2030 ($ million)
Chart on Writing instruments - Year-over-year growth 2025-2030 (%)
Data Table on Writing instruments - Year-over-year growth 2025-2030 (%)

8.6 Market opportunity by Product

Market opportunity by Product ($ million)
Data Table on Market opportunity by Product ($ million)

9. Market Segmentation by Distribution Channel

9.1 Market segments

Chart on Distribution Channel - Market share 2025-2030 (%)
Data Table on Distribution Channel - Market share 2025-2030 (%)

9.2 Comparison by Distribution Channel

Chart on Comparison by Distribution Channel
Data Table on Comparison by Distribution Channel

9.3 Offline - Market size and forecast 2025-2030

Chart on Offline - Market size and forecast 2025-2030 ($ million)
Data Table on Offline - Market size and forecast 2025-2030 ($ million)
Chart on Offline - Year-over-year growth 2025-2030 (%)
Data Table on Offline - Year-over-year growth 2025-2030 (%)

9.4 Online - Market size and forecast 2025-2030

Chart on Online - Market size and forecast 2025-2030 ($ million)
Data Table on Online - Market size and forecast 2025-2030 ($ million)
Chart on Online - Year-over-year growth 2025-2030 (%)
Data Table on Online - Year-over-year growth 2025-2030 (%)

9.5 Market opportunity by Distribution Channel

Market opportunity by Distribution Channel ($ million)
Data Table on Market opportunity by Distribution Channel ($ million)

10. Market Segmentation by Price Range

10.1 Market segments

Chart on Price Range - Market share 2025-2030 (%)
Data Table on Price Range - Market share 2025-2030 (%)

10.2 Comparison by Price Range

Chart on Comparison by Price Range
Data Table on Comparison by Price Range

10.3 Low - Market size and forecast 2025-2030

Chart on Low - Market size and forecast 2025-2030 ($ million)
Data Table on Low - Market size and forecast 2025-2030 ($ million)
Chart on Low - Year-over-year growth 2025-2030 (%)
Data Table on Low - Year-over-year growth 2025-2030 (%)

10.4 Medium - Market size and forecast 2025-2030

Chart on Medium - Market size and forecast 2025-2030 ($ million)
Data Table on Medium - Market size and forecast 2025-2030 ($ million)
Chart on Medium - Year-over-year growth 2025-2030 (%)
Data Table on Medium - Year-over-year growth 2025-2030 (%)

10.5 High - Market size and forecast 2025-2030

Chart on High - Market size and forecast 2025-2030 ($ million)
Data Table on High - Market size and forecast 2025-2030 ($ million)
Chart on High - Year-over-year growth 2025-2030 (%)
Data Table on High - Year-over-year growth 2025-2030 (%)

10.6 Market opportunity by Price Range

Market opportunity by Price Range ($ million)
Data Table on Market opportunity by Price Range ($ million)

11. Customer Landscape

11.1 Customer landscape overview

Analysis of price sensitivity, lifecycle, customer purchase basket, adoption rates, and purchase criteria

12. Geographic Landscape

12.1 Geographic segmentation

Chart on Market share by geography 2025-2030 (%)
Data Table on Market share by geography 2025-2030 (%)

12.2 Geographic comparison

Chart on Geographic comparison
Data Table on Geographic comparison

12.3 APAC - Market size and forecast 2025-2030

Chart on APAC - Market size and forecast 2025-2030 ($ million)
Data Table on APAC - Market size and forecast 2025-2030 ($ million)
Chart on APAC - Year-over-year growth 2025-2030 (%)
Data Table on APAC - Year-over-year growth 2025-2030 (%)
Chart on Regional Comparison - APAC
Data Table on Regional Comparison - APAC

12.3.1 China - Market size and forecast 2025-2030

Chart on China - Market size and forecast 2025-2030 ($ million)
Data Table on China - Market size and forecast 2025-2030 ($ million)
Chart on China - Year-over-year growth 2025-2030 (%)
Data Table on China - Year-over-year growth 2025-2030 (%)

12.3.2 Japan - Market size and forecast 2025-2030

Chart on Japan - Market size and forecast 2025-2030 ($ million)
Data Table on Japan - Market size and forecast 2025-2030 ($ million)
Chart on Japan - Year-over-year growth 2025-2030 (%)
Data Table on Japan - Year-over-year growth 2025-2030 (%)

12.3.3 India - Market size and forecast 2025-2030

Chart on India - Market size and forecast 2025-2030 ($ million)
Data Table on India - Market size and forecast 2025-2030 ($ million)
Chart on India - Year-over-year growth 2025-2030 (%)
Data Table on India - Year-over-year growth 2025-2030 (%)

12.3.4 South Korea - Market size and forecast 2025-2030

Chart on South Korea - Market size and forecast 2025-2030 ($ million)
Data Table on South Korea - Market size and forecast 2025-2030 ($ million)
Chart on South Korea - Year-over-year growth 2025-2030 (%)
Data Table on South Korea - Year-over-year growth 2025-2030 (%)

12.3.5 Indonesia - Market size and forecast 2025-2030

Chart on Indonesia - Market size and forecast 2025-2030 ($ million)
Data Table on Indonesia - Market size and forecast 2025-2030 ($ million)
Chart on Indonesia - Year-over-year growth 2025-2030 (%)
Data Table on Indonesia - Year-over-year growth 2025-2030 (%)

12.3.6 Australia - Market size and forecast 2025-2030

Chart on Australia - Market size and forecast 2025-2030 ($ million)
Data Table on Australia - Market size and forecast 2025-2030 ($ million)
Chart on Australia - Year-over-year growth 2025-2030 (%)
Data Table on Australia - Year-over-year growth 2025-2030 (%)

12.4 Europe - Market size and forecast 2025-2030

Chart on Europe - Market size and forecast 2025-2030 ($ million)
Data Table on Europe - Market size and forecast 2025-2030 ($ million)
Chart on Europe - Year-over-year growth 2025-2030 (%)
Data Table on Europe - Year-over-year growth 2025-2030 (%)
Chart on Regional Comparison - Europe
Data Table on Regional Comparison - Europe

12.4.1 Germany - Market size and forecast 2025-2030

Chart on Germany - Market size and forecast 2025-2030 ($ million)
Data Table on Germany - Market size and forecast 2025-2030 ($ million)
Chart on Germany - Year-over-year growth 2025-2030 (%)
Data Table on Germany - Year-over-year growth 2025-2030 (%)

12.4.2 UK - Market size and forecast 2025-2030

Chart on UK - Market size and forecast 2025-2030 ($ million)
Data Table on UK - Market size and forecast 2025-2030 ($ million)
Chart on UK - Year-over-year growth 2025-2030 (%)
Data Table on UK - Year-over-year growth 2025-2030 (%)

12.4.3 France - Market size and forecast 2025-2030

Chart on France - Market size and forecast 2025-2030 ($ million)
Data Table on France - Market size and forecast 2025-2030 ($ million)
Chart on France - Year-over-year growth 2025-2030 (%)
Data Table on France - Year-over-year growth 2025-2030 (%)

12.4.4 Italy - Market size and forecast 2025-2030

Chart on Italy - Market size and forecast 2025-2030 ($ million)
Data Table on Italy - Market size and forecast 2025-2030 ($ million)
Chart on Italy - Year-over-year growth 2025-2030 (%)
Data Table on Italy - Year-over-year growth 2025-2030 (%)

12.4.5 Spain - Market size and forecast 2025-2030

Chart on Spain - Market size and forecast 2025-2030 ($ million)
Data Table on Spain - Market size and forecast 2025-2030 ($ million)
Chart on Spain - Year-over-year growth 2025-2030 (%)
Data Table on Spain - Year-over-year growth 2025-2030 (%)

12.4.6 The Netherlands - Market size and forecast 2025-2030

Chart on The Netherlands - Market size and forecast 2025-2030 ($ million)
Data Table on The Netherlands - Market size and forecast 2025-2030 ($ million)
Chart on The Netherlands - Year-over-year growth 2025-2030 (%)
Data Table on The Netherlands - Year-over-year growth 2025-2030 (%)

12.5 North America - Market size and forecast 2025-2030

Chart on North America - Market size and forecast 2025-2030 ($ million)
Data Table on North America - Market size and forecast 2025-2030 ($ million)
Chart on North America - Year-over-year growth 2025-2030 (%)
Data Table on North America - Year-over-year growth 2025-2030 (%)
Chart on Regional Comparison - North America
Data Table on Regional Comparison - North America

12.5.1 US - Market size and forecast 2025-2030

Chart on US - Market size and forecast 2025-2030 ($ million)
Data Table on US - Market size and forecast 2025-2030 ($ million)
Chart on US - Year-over-year growth 2025-2030 (%)
Data Table on US - Year-over-year growth 2025-2030 (%)

12.5.2 Canada - Market size and forecast 2025-2030

Chart on Canada - Market size and forecast 2025-2030 ($ million)
Data Table on Canada - Market size and forecast 2025-2030 ($ million)
Chart on Canada - Year-over-year growth 2025-2030 (%)
Data Table on Canada - Year-over-year growth 2025-2030 (%)

12.5.3 Mexico - Market size and forecast 2025-2030

Chart on Mexico - Market size and forecast 2025-2030 ($ million)
Data Table on Mexico - Market size and forecast 2025-2030 ($ million)
Chart on Mexico - Year-over-year growth 2025-2030 (%)
Data Table on Mexico - Year-over-year growth 2025-2030 (%)

12.6 South America - Market size and forecast 2025-2030

Chart on South America - Market size and forecast 2025-2030 ($ million)
Data Table on South America - Market size and forecast 2025-2030 ($ million)
Chart on South America - Year-over-year growth 2025-2030 (%)
Data Table on South America - Year-over-year growth 2025-2030 (%)
Chart on Regional Comparison - South America
Data Table on Regional Comparison - South America

12.6.1 Brazil - Market size and forecast 2025-2030

Chart on Brazil - Market size and forecast 2025-2030 ($ million)
Data Table on Brazil - Market size and forecast 2025-2030 ($ million)
Chart on Brazil - Year-over-year growth 2025-2030 (%)
Data Table on Brazil - Year-over-year growth 2025-2030 (%)

12.6.2 Argentina - Market size and forecast 2025-2030

Chart on Argentina - Market size and forecast 2025-2030 ($ million)
Data Table on Argentina - Market size and forecast 2025-2030 ($ million)
Chart on Argentina - Year-over-year growth 2025-2030 (%)
Data Table on Argentina - Year-over-year growth 2025-2030 (%)

12.6.3 Chile - Market size and forecast 2025-2030

Chart on Chile - Market size and forecast 2025-2030 ($ million)
Data Table on Chile - Market size and forecast 2025-2030 ($ million)
Chart on Chile - Year-over-year growth 2025-2030 (%)
Data Table on Chile - Year-over-year growth 2025-2030 (%)

12.7 Middle East and Africa - Market size and forecast 2025-2030

Chart on Middle East and Africa - Market size and forecast 2025-2030 ($ million)
Data Table on Middle East and Africa - Market size and forecast 2025-2030 ($ million)
Chart on Middle East and Africa - Year-over-year growth 2025-2030 (%)
Data Table on Middle East and Africa - Year-over-year growth 2025-2030 (%)
Chart on Regional Comparison - Middle East and Africa
Data Table on Regional Comparison - Middle East and Africa

12.7.1 Saudi Arabia - Market size and forecast 2025-2030

Chart on Saudi Arabia - Market size and forecast 2025-2030 ($ million)
Data Table on Saudi Arabia - Market size and forecast 2025-2030 ($ million)
Chart on Saudi Arabia - Year-over-year growth 2025-2030 (%)
Data Table on Saudi Arabia - Year-over-year growth 2025-2030 (%)

12.7.2 UAE - Market size and forecast 2025-2030

Chart on UAE - Market size and forecast 2025-2030 ($ million)
Data Table on UAE - Market size and forecast 2025-2030 ($ million)
Chart on UAE - Year-over-year growth 2025-2030 (%)
Data Table on UAE - Year-over-year growth 2025-2030 (%)

12.7.3 South Africa - Market size and forecast 2025-2030

Chart on South Africa - Market size and forecast 2025-2030 ($ million)
Data Table on South Africa - Market size and forecast 2025-2030 ($ million)
Chart on South Africa - Year-over-year growth 2025-2030 (%)
Data Table on South Africa - Year-over-year growth 2025-2030 (%)

12.7.4 Egypt - Market size and forecast 2025-2030

Chart on Egypt - Market size and forecast 2025-2030 ($ million)
Data Table on Egypt - Market size and forecast 2025-2030 ($ million)
Chart on Egypt - Year-over-year growth 2025-2030 (%)
Data Table on Egypt - Year-over-year growth 2025-2030 (%)

12.7.5 Nigeria - Market size and forecast 2025-2030

Chart on Nigeria - Market size and forecast 2025-2030 ($ million)
Data Table on Nigeria - Market size and forecast 2025-2030 ($ million)
Chart on Nigeria - Year-over-year growth 2025-2030 (%)
Data Table on Nigeria - Year-over-year growth 2025-2030 (%)

12.8 Market opportunity by geography

Market opportunity by geography ($ million)
Data Tables on Market opportunity by geography ($ million)

13. Drivers, Challenges, and Opportunity

13.1 Market drivers

Sustainable material sourcing and eco-conscious lifecycles
Personalized learning tools and AI-integrated digital hybrids
Inclusive literacy initiatives and multi-sensory educational supplies

13.2 Market challenges

Intensification of digital integration and competitive pressure of paperless educational
Escalation of raw material volatility and financial risk of crude-linked input
Proliferation of regulatory compliance and economic burden of sustainable material

13.3 Impact of drivers and challenges

Impact of drivers and challenges in 2025 and 2030

13.4 Market opportunities

Institutionalization of sustainable materiality and circular procurement
Growth of aesthetic minimalism and sensory-focused design
Integration of hybrid physical-digital tools and smart organization

14. Competitive Landscape

14.1 Overview

14.2

Overview on criticality of inputs and factors of differentiation

14.3 Landscape disruption

Overview on factors of disruption

14.4 Industry risks

Impact of key risks on business

15. Competitive Analysis

15.1 Companies profiled

Companies covered

15.2 Company ranking index

15.3 Market positioning of companies

Matrix on companies position and classification

15.4 3M Co.

3M Co. - Overview
3M Co. - Business segments
3M Co. - Key news
3M Co. - Key offerings
3M Co. - Segment focus
SWOT

15.5 ACCO Brands Corp.

ACCO Brands Corp. - Overview
ACCO Brands Corp. - Business segments
ACCO Brands Corp. - Key offerings
ACCO Brands Corp. - Segment focus
SWOT

15.6 Avery Products Corp

Avery Products Corp - Overview
Avery Products Corp - Product / Service
Avery Products Corp - Key offerings
SWOT

15.7 Beifa Group

Beifa Group - Overview
Beifa Group - Product / Service
Beifa Group - Key offerings
SWOT

15.8 DOMS Industries Ltd

DOMS Industries Ltd - Overview
DOMS Industries Ltd - Business segments
DOMS Industries Ltd - Key offerings
DOMS Industries Ltd - Segment focus
SWOT

15.9 Faber Castell AG

Faber Castell AG - Overview
Faber Castell AG - Product / Service
Faber Castell AG - Key offerings
SWOT

15.10 Hindustan Pencils Pvt. Ltd.

Hindustan Pencils Pvt. Ltd. - Overview
Hindustan Pencils Pvt. Ltd. - Product / Service
Hindustan Pencils Pvt. Ltd. - Key offerings
SWOT

15.11 ITC Ltd.

ITC Ltd. - Overview
ITC Ltd. - Business segments
ITC Ltd. - Key offerings
ITC Ltd. - Segment focus
SWOT

15.12 Kokuyo Camlin Ltd

Kokuyo Camlin Ltd - Overview
Kokuyo Camlin Ltd - Product / Service
Kokuyo Camlin Ltd - Key offerings
SWOT

15.13 Maped Helix

Maped Helix - Overview
Maped Helix - Product / Service
Maped Helix - Key offerings
SWOT

15.14 Newell Brands Inc.

Newell Brands Inc. - Overview
Newell Brands Inc. - Business segments
Newell Brands Inc. - Key offerings
Newell Brands Inc. - Segment focus
SWOT

15.15 Pelikan International Corp.

Pelikan International Corp. - Overview
Pelikan International Corp. - Product / Service
Pelikan International Corp. - Key offerings
SWOT

15.16 Shanghai M and G Stationery Inc.

Shanghai M and G Stationery Inc. - Overview
Shanghai M and G Stationery Inc. - Product / Service
Shanghai M and G Stationery Inc. - Key offerings
SWOT

15.17 Societe Bic S.A

Societe Bic S.A - Overview
Societe Bic S.A - Product / Service
Societe Bic S.A - Key offerings
SWOT

15.18 Zebra Pen Corp.

Zebra Pen Corp. - Overview
Zebra Pen Corp. - Product / Service
Zebra Pen Corp. - Key offerings
SWOT

16. Appendix

16.1 Scope of the report

Market definition
Objectives
Notes and caveats

16.2 Inclusions and exclusions checklist

Inclusions checklist
Exclusions checklist

16.3 Currency conversion rates for US$

16.4 Research methodology

16.5 Data procurement

Information sources

16.6 Data validation

16.7 Validation techniques employed for market sizing

16.8 Data synthesis

16.9 360 degree market analysis

16.10 List of abbreviations

Research Methodology

Technavio presents a detailed picture of the market by way of study, synthesis, and summation of data from multiple sources. The analysts have presented the various facets of the market with a particular focus on identifying the key industry influencers. The data thus presented is comprehensive, reliable, and the result of extensive research, both primary and secondary.

INFORMATION SOURCES

Primary sources

  • Manufacturers and suppliers
  • Channel partners
  • Industry experts
  • Strategic decision makers

Secondary sources

  • Industry journals and periodicals
  • Government data
  • Financial reports of key industry players
  • Historical data
  • Press releases

DATA ANALYSIS

Data Synthesis

  • Collation of data
  • Estimation of key figures
  • Analysis of derived insights

Data Validation

  • Triangulation with data models
  • Reference against proprietary databases
  • Corroboration with industry experts

REPORT WRITING

Qualitative

  • Market drivers
  • Market challenges
  • Market trends
  • Five forces analysis

Quantitative

  • Market size and forecast
  • Market segmentation
  • Geographical insights
  • Competitive landscape

Interested in this report?

Get your sample now to see our research methodology and insights!

Download Now

Frequently Asked Questions

School Stationery Supplies market growth will increase by USD 12275.4 million during 2026-2030.

The School Stationery Supplies market is expected to grow at a CAGR of 2.2% during 2026-2030.

School Stationery Supplies market is segmented by Product (Paper products, Computer and daily use, Writing instruments) Distribution channel (Offline, Online) Price range (Low, Medium, High)

3M Co., ACCO Brands Corp., Avery Products Corp, Beifa Group, Crayola, DOMS Industries Ltd, Faber Castell AG, Hindustan Pencils Pvt. Ltd., ITC Ltd., Kokuyo Camlin Ltd, Maped Helix, Newell Brands Inc., Onyx and Green Corp., Pelikan International Corp., Pentel of America Ltd., PILOT Corp, Shanghai M and G Stationery Inc., Societe Bic S.A, Staedtler Mars GmbH, Zebra Pen Corp. are a few of the key vendors in the School Stationery Supplies market.

APAC will register the highest growth rate of 42.1% among the other regions. Therefore, the School Stationery Supplies market in APAC is expected to garner significant business opportunities for the vendors during the forecast period.

China, Japan, India, South Korea, Indonesia, Australia, Germany, UK, France, Italy, Spain, The Netherlands, US, Canada, Mexico, Brazil, Argentina, Chile, Saudi Arabia, UAE, South Africa, Egypt, Nigeria

  • Sustainable material sourcing and eco-conscious lifecycles is the driving factor this market.

The School Stationery Supplies market vendors should focus on grabbing business opportunities from the Product segment as it accounted for the largest market share in the base year.
RIA - Research AI Assistant
Ask RIA