Scope 3 Emissions Tracking Tools Market Size and Growth Forecast 2026-2030
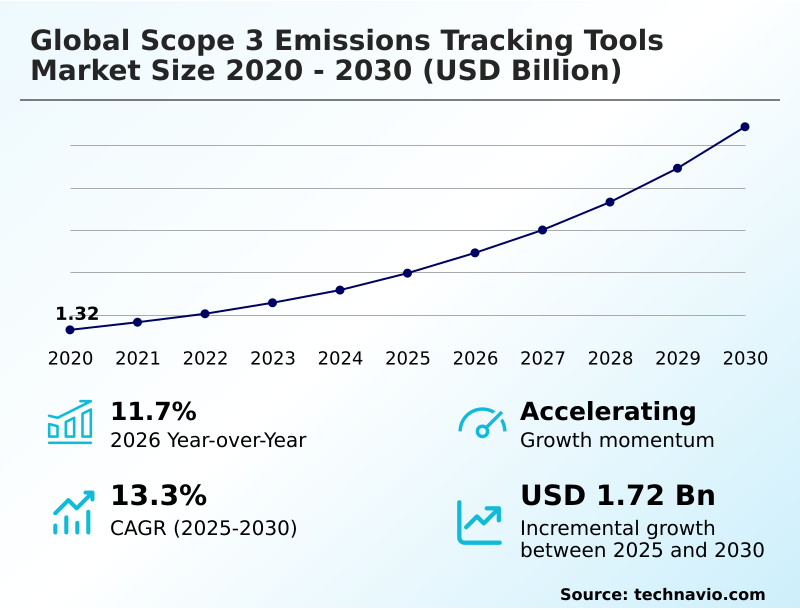
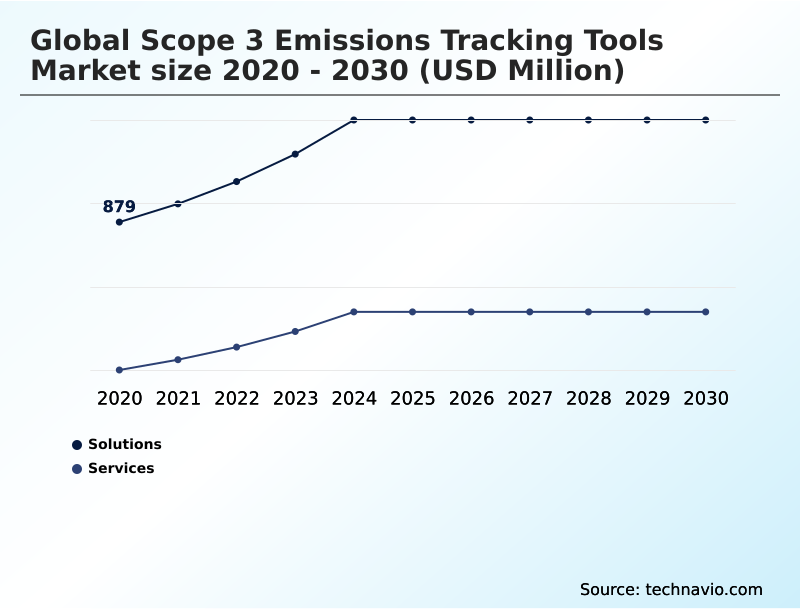
The Scope 3 Emissions Tracking Tools Market size was valued at USD 1.99 billion in 2025 growing at a CAGR of 13.3% during the forecast period 2026-2030.
North America accounts for 34.2% of incremental growth during the forecast period. The Solutions segment by Component was valued at USD 1.18 billion in 2024, while the Large enterprises segment holds the largest revenue share by End-user.
The market is projected to grow by USD 2.40 billion from 2020 to 2030, with USD 1.72 billion of the growth expected during the forecast period of 2025 to 2030.
Get Key Insights on Market Forecast (PDF) Request Free Sample
Scope 3 Emissions Tracking Tools Market Overview
The Scope 3 Emissions Tracking Tools market is fundamentally shaped by the transition from voluntary ESG goals to mandatory disclosures under frameworks like the EU's Corporate Sustainability Reporting Directive (CSRD) and SEC climate rules. This shift compels organizations to adopt robust carbon accounting platforms for GHG protocol compliance and to develop credible decarbonization pathways. For instance, a consumer packaged goods company uses a supplier engagement portal to automate data collection for its agricultural inputs, improving the accuracy of its product lifecycle assessment. This move from high-level spend-based calculation to activity-based data is critical, as regions like North America contribute over 34% of incremental market growth, driven by investor demand for verifiable environmental impact data. The integration of AI-driven carbon data analytics is enabling more precise supply chain decarbonization and better climate risk analytics, turning compliance into a strategic advantage. Effective sustainability management software is now essential for navigating the complexities of value chain emissions and maintaining market access.
Drivers, Trends, and Challenges in the Scope 3 Emissions Tracking Tools Market
The urgent need for compliance with the Corporate Sustainability Reporting Directive is compelling enterprises to seek out the best scope 3 emissions tracking tools, moving beyond spreadsheets toward integrated software. This is particularly true for financial services firms, where scope 3 reporting software for financial institutions is essential for calculating the carbon footprint of investment portfolios.
The core challenge involves automating supplier data collection for carbon, which requires integrating carbon accounting into ERP systems to get granular data on metrics like scope 3 category 1 purchased goods and services. For a manufacturing firm, this means using product lifecycle assessment software tools to track inputs from sourcing to end-of-life.
The use of AI in scope 3 emissions calculation is proving vital for filling data gaps and improving the accuracy of GHG protocol for scope 3 emissions, overcoming some challenges in scope 3 data accuracy. For example, a logistics company can now better calculate scope 3 business travel emissions with real-time supply chain emissions tracking.
The market is maturing, with a clear preference for platforms that enable supply chain decarbonization and offer robust scope 3 supplier engagement strategies, rather than just reporting, and a move toward cloud based scope 3 emissions software is evident, with some solutions reducing reporting discrepancies by more than 30% compared to manual methods.
This shift is critical for companies aiming to implement effective carbon reduction strategies, especially in the context of scope 3 emissions calculation for manufacturing, which often constitutes the largest part of a company's footprint. The demand for scope 3 emissions reporting for SMEs is also growing as they are pulled into the reporting ecosystem by their larger partners.
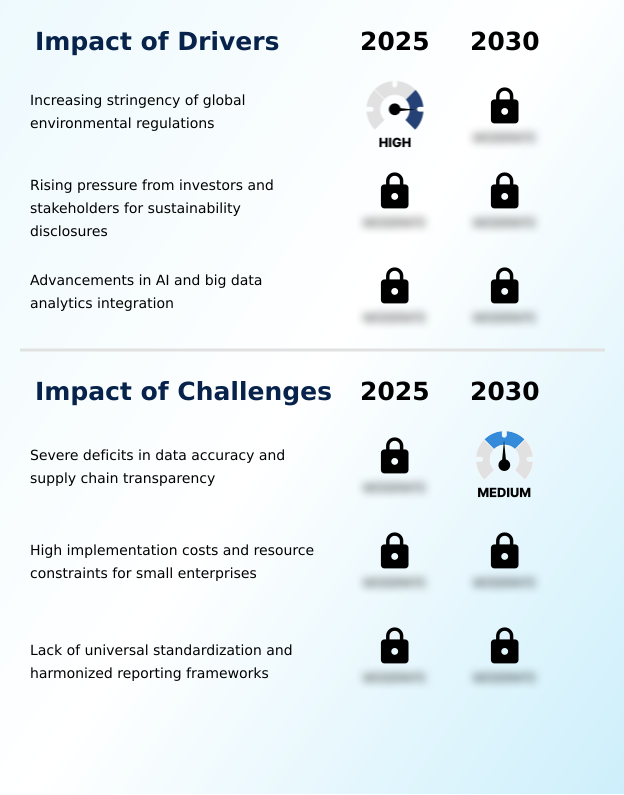
Primary Growth Driver: The increasing stringency of global environmental regulations is a key driver for the adoption of advanced tracking tools.
Market adoption is primarily driven by intensifying regulatory pressure, with frameworks like the EU's corporate sustainability reporting directive making comprehensive value chain emissions disclosure mandatory. This forces companies to seek GHG protocol compliance through auditable sustainability management software.
Investor demand for transparent sustainability performance metrics and robust climate risk analytics is another major force, as capital allocation is increasingly tied to ESG performance.
The technological maturity of AI-driven carbon data platforms is also critical, enabling accurate analysis and the creation of credible decarbonization pathways.
With regions like APAC growing at over 14%, the need for scalable tools to manage global supply chain decarbonization and comply with rules like the Carbon Border Adjustment Mechanism is paramount for maintaining market access.
Emerging Market Trend: A significant trend involves the market's shift away from generic emission factors. Organizations now demand highly specialized, industry-specific databases and customization for more precise carbon accounting.
A key trend is the move toward industry-specific emission factors, which improves carbon footprint modeling accuracy by replacing generic data. Platforms are now offering supplier engagement portals to facilitate automated data collection directly from partners, enhancing supply chain transparency and enabling better product carbon footprinting.
This is coupled with the seamless procurement integration of carbon accounting software into existing ERP systems, allowing for real-time decision-making. For instance, a procurement manager can now see the environmental impact alongside cost during sourcing.
Another development is the focus on supplier collaboration and capacity building, where platforms provide tools to help smaller suppliers with their GHG inventory, fostering a more resilient and decarbonized value chain.
Key Industry Challenge: Severe deficits in data accuracy and a lack of supply chain transparency present a key challenge affecting market growth.
A primary market challenge is the poor quality of primary supplier data and a general lack of supply chain transparency beyond tier 1 and tier 2 suppliers. This forces a reliance on less accurate spend-based calculation methods, which can misrepresent the true environmental impact data.
The absence of a single, harmonized reporting standard beyond the foundational GHG Protocol creates complexity, as companies must navigate differing requirements for climate disclosure rules globally. Furthermore, the high implementation cost of a full-fledged carbon accounting platform remains a significant barrier for many SMEs, even as they are pressured by larger clients to provide GHG inventory data.
Overcoming the challenge of data verification is essential for the market to move from estimation to precise management.
Explore Full Market Dynamics Analysis Request Free Sample
Scope 3 Emissions Tracking Tools Market Segmentation
The scope 3 emissions tracking tools industry research report provides comprehensive data including region-wise segment analysis, with forecasts and analysis for the period 2026-2030, as well as historical data from 2020-2024 for the following segments.
Component Segment Analysis
The solutions segment is estimated to witness significant growth during the forecast period.
The solutions segment is defined by software platforms, data analytics engines, and APIs that organizations use to manage value chain emissions.
The complexity of the 15 distinct Scope 3 categories is a primary driver, compelling a shift from manual, error-prone spreadsheets to automated systems.
Advanced solutions now feature integration with ERP and SCM systems for real-time data ingestion, with this segment accounting for over 65% of the market in 2024.
The integration of AI and machine learning into carbon accounting software helps fill gaps where primary supplier data is unavailable, improving the accuracy of carbon footprint modeling.
Demand is further bolstered by the need for auditable data trails for environmental social governance reporting, making advanced sustainability management software a critical investment for regulatory compliance.
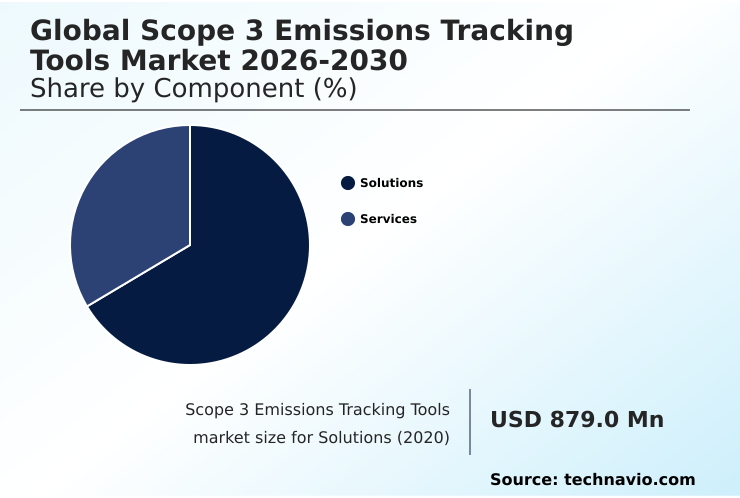
The Solutions segment was valued at USD 1.18 billion in 2024 and showed a gradual increase during the forecast period.
Scope 3 Emissions Tracking Tools Market by Region: North America Leads with 34.2% Growth Share
North America is estimated to contribute 34.2% to the growth of the global market during the forecast period.
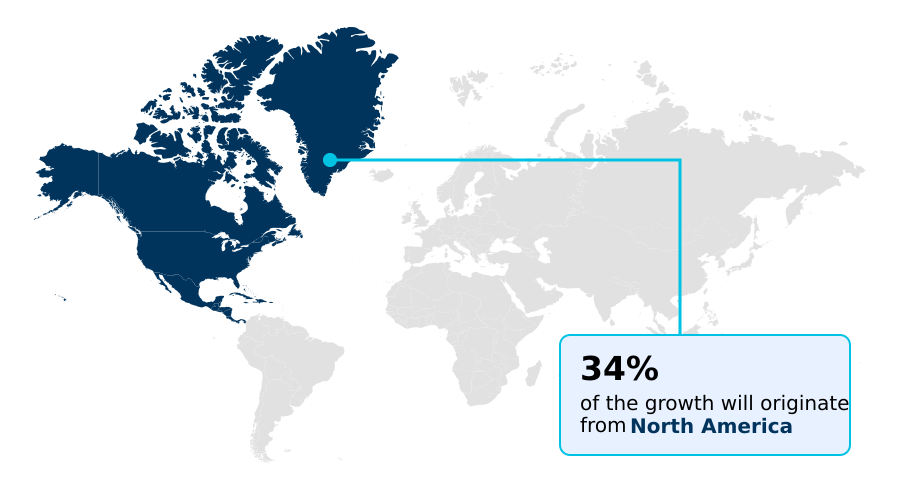
The geographic landscape is dominated by North America and Europe, which together account for over 60% of the market's incremental growth, a direct result of stringent regulations like the Corporate Sustainability Reporting Directive and heightened investor pressure for detailed ESG reporting automation.
In North America, the focus is on mitigating supply chain risk.
Meanwhile, the APAC region, with a growth rate exceeding 14%, is driven by its role as a global manufacturing hub where suppliers must adopt sophisticated carbon data management tools to comply with Western clients' decarbonization pathways and policies such as the Carbon Border Adjustment Mechanism.
This export-driven pressure compels the adoption of platforms that ensure supply chain transparency and facilitate regulatory compliance reporting across diverse jurisdictions, making localized emission factor databases a key differentiator.
Customer Landscape Analysis for the Scope 3 Emissions Tracking Tools Market
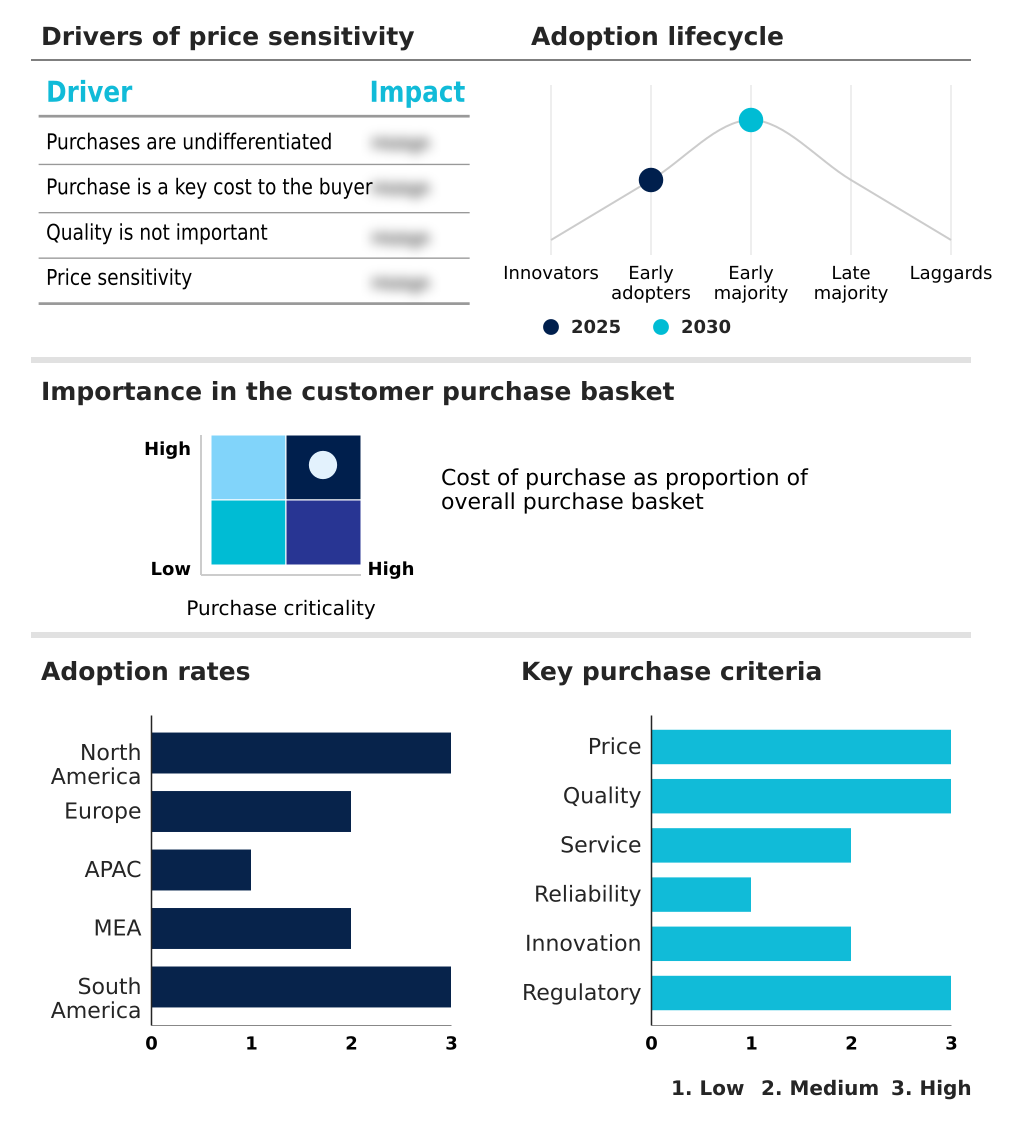
The scope 3 emissions tracking tools market forecasting report includes the adoption lifecycle of the market, covering from the innovator’s stage to the laggard’s stage. It focuses on adoption rates in different regions based on penetration. Furthermore, the scope 3 emissions tracking tools market report also includes key purchase criteria and drivers of price sensitivity to help companies evaluate and develop their market growth analysis strategies.
Competitive Landscape of the Scope 3 Emissions Tracking Tools Market
Companies are implementing various strategies, such as strategic alliances, partnerships, mergers and acquisitions, geographical expansion, and product/service launches, to enhance their presence in the scope 3 emissions tracking tools market industry.
Breathe ESG Pvt. Ltd. - Key offerings focus on enterprise-grade sustainability management software, providing tools for carbon accounting, ESG data management, and automating supply chain emissions reporting to meet regulatory requirements.
The industry research and growth report includes detailed analyses of the competitive landscape of the market and information about key companies, including:
- Breathe ESG Pvt. Ltd.
- Carbmee
- ComplianceQuest
- Diligent Corp.
- Greenly
- IBM Corp.
- Intercontinental Exchange Inc.
- Jupiter Intelligence. Inc
- Makersite
- Microsoft Corp.
- Oracle Corp.
- Persefoni AI Inc.
- Pulsora
- Salesforce Inc.
- SAP SE
- SINAI
- Sphera Solutions Inc.
- Sweep
- UL LLC
- Watershed Technology Inc.
Qualitative and quantitative analysis of companies has been conducted to help clients understand the wider business environment as well as the strengths and weaknesses of key industry players. Data is qualitatively analyzed to categorize companies as pure play, category-focused, industry-focused, and diversified; it is quantitatively analyzed to categorize companies as dominant, leading, strong, tentative, and weak.
Recent Developments in the Scope 3 Emissions Tracking Tools Market
- In October 2025, Diginex Limited launched diginexGHG, an AI-enabled corporate carbon footprint solution designed to streamline Scope 1, 2, and 3 emissions accounting to assist companies in meeting expanding ESG disclosure requirements.
- In November 2025, Worldly significantly expanded its Product Impact Calculator, enabling carbon footprint modeling across more than 400,000 products and strengthening Scope 3 estimation capabilities for the apparel, footwear, and consumer goods sectors.
- In December 2025, Watershed, in collaboration with Stanford University, assumed stewardship of a key US federal supply chain emissions database, ensuring continued access to high-quality emissions factors critical for Scope 3 calculations.
- In January 2026, Diginex Limited completed the USD 64 million acquisition of Plan A, a Germany-based carbon accounting and decarbonization software provider, enhancing its end-to-end ESG reporting capabilities.
Research Analyst Overview: Scope 3 Emissions Tracking Tools Market
The shift from voluntary ESG goals to mandatory reporting under regulations such as the SEC's climate disclosure rules has elevated carbon accounting software from a niche tool to a core component of corporate risk management.
Boardroom decisions on capital allocation now hinge on auditable decarbonization pathways, which are impossible without robust supply chain decarbonization strategies and tools that ensure GHG protocol compliance. A key enabler is the use of AI-driven carbon data platforms for automated data collection, which drastically improves the accuracy of environmental impact data over traditional methods.
Given that the solutions segment accounts for over 65% of the market, the strategic focus is on acquiring advanced sustainability management software capable of detailed product lifecycle assessment and real-time emissions monitoring.
This investment in a comprehensive carbon accounting platform is no longer discretionary; for enterprises with complex value chains, it is a prerequisite for managing climate risk analytics and maintaining investor confidence.
Dive into Technavio’s robust research methodology, blending expert interviews, extensive data synthesis, and validated models for unparalleled Scope 3 Emissions Tracking Tools Market insights. See full methodology.
| Market Scope | |
|---|---|
| Page number | 293 |
| Base year | 2025 |
| Historic period | 2020-2024 |
| Forecast period | 2026-2030 |
| Growth momentum & CAGR | Accelerate at a CAGR of 13.3% |
| Market growth 2026-2030 | USD 1724.9 million |
| Market structure | Fragmented |
| YoY growth 2025-2026(%) | 11.7% |
| Key countries | US, Canada, Mexico, Germany, UK, France, Italy, The Netherlands, Spain, China, Japan, India, Australia, South Korea, Indonesia, Saudi Arabia, UAE, South Africa, Israel, Turkey, Brazil, Argentina and Colombia |
| Competitive landscape | Leading Companies, Market Positioning of Companies, Competitive Strategies, and Industry Risks |
Scope 3 Emissions Tracking Tools Market: Key Questions Answered in This Report
-
What is the expected growth of the Scope 3 Emissions Tracking Tools Market between 2026 and 2030?
-
The Scope 3 Emissions Tracking Tools Market is expected to grow by USD 1.72 billion during 2026-2030, registering a CAGR of 13.3%. Year-over-year growth in 2026 is estimated at 11.7%%. This acceleration is shaped by increasing stringency of global environmental regulations, which is intensifying demand across multiple end-use verticals covered in the report.
-
-
What segmentation does the market report cover?
-
The report is segmented by Component (Solutions, and Services), End-user (Large enterprises, and SMEs), Deployment (Cloud, On-premises, and Hybrid) and Geography (North America, Europe, APAC, Middle East and Africa, South America). Among these, the Solutions segment is estimated to witness significant growth during the forecast period, driven by rising adoption across key application areas. Each segment includes detailed qualitative and quantitative analysis, along with historical data from 2020-2024 and forecasts through 2030 with year-over-year growth rates.
-
-
Which regions are analyzed in the report?
-
The report covers North America, Europe, APAC, Middle East and Africa and South America. North America is estimated to contribute 34.2% to market growth during the forecast period. Country-level analysis includes US, Canada, Mexico, Germany, UK, France, Italy, The Netherlands, Spain, China, Japan, India, Australia, South Korea, Indonesia, Saudi Arabia, UAE, South Africa, Israel, Turkey, Brazil, Argentina and Colombia, with dedicated market size tables and year-over-year growth for each.
-
-
What are the key growth drivers and market challenges?
-
The primary driver is increasing stringency of global environmental regulations, which is accelerating investment and industry demand. The main challenge is severe deficits in data accuracy and supply chain transparency, creating operational barriers for key market participants. The report quantifies the impact of each driver and challenge across 2026 and 2030 with comparative analysis.
-
-
Who are the major players in the Scope 3 Emissions Tracking Tools Market?
-
Key vendors include Breathe ESG Pvt. Ltd., Carbmee, ComplianceQuest, Diligent Corp., Greenly, IBM Corp., Intercontinental Exchange Inc., Jupiter Intelligence. Inc, Makersite, Microsoft Corp., Oracle Corp., Persefoni AI Inc., Pulsora, Salesforce Inc., SAP SE, SINAI, Sphera Solutions Inc., Sweep, UL LLC and Watershed Technology Inc.. The report provides qualitative and quantitative analysis categorizing companies as dominant, leading, strong, tentative, and weak based on their market positioning. Company profiles include business segment analysis, SWOT assessment, key offerings, and recent strategic developments.
-
Scope 3 Emissions Tracking Tools Market Research Insights
The market dynamic is shifting from high-level estimation to granular measurement, driven by regulatory frameworks like the EU's Corporate Sustainability Reporting Directive (CSRD) that mandate auditable sustainability disclosures. While spend-based calculation offered a baseline, the need for accurate activity-based calculation is now paramount for identifying carbon hotspots across tier 1 and tier 2 suppliers.
For example, a global retailer now requires its top suppliers to provide primary supplier data through an integrated platform, enabling precise tracking of upstream and downstream emissions.
This focus on data verification is critical as SMEs, representing a faster-growing adopter segment, are increasingly required to report their environmental performance to maintain their position in corporate value chains, pushing the whole ecosystem towards greater supply chain transparency.
We can help! Our analysts can customize this scope 3 emissions tracking tools market research report to meet your requirements.
 RIA -
RIA - 
