Procurement Software Market Analysis North America, Europe, APAC, South America, Middle East and Africa - US, Germany, Canada, UK, China, France, Italy, India, Japan, South Korea - Size and Forecast 2025-2029

Procurement Software Market Analysis North America, Europe, APAC, South America, Middle East and Africa - US, Germany, Canada, UK, China, France, Italy, India, Japan, South Korea - Size and Forecast 2025-2029

Published: Jan 2025 210 Pages SKU: IRTNTR75135

Market Overview at a Glance

$6.66 B
Market Opportunity
11.3%
CAGR
10.3
YoY growth 2024-2025(%)

Procurement Software Market Size 2025-2029

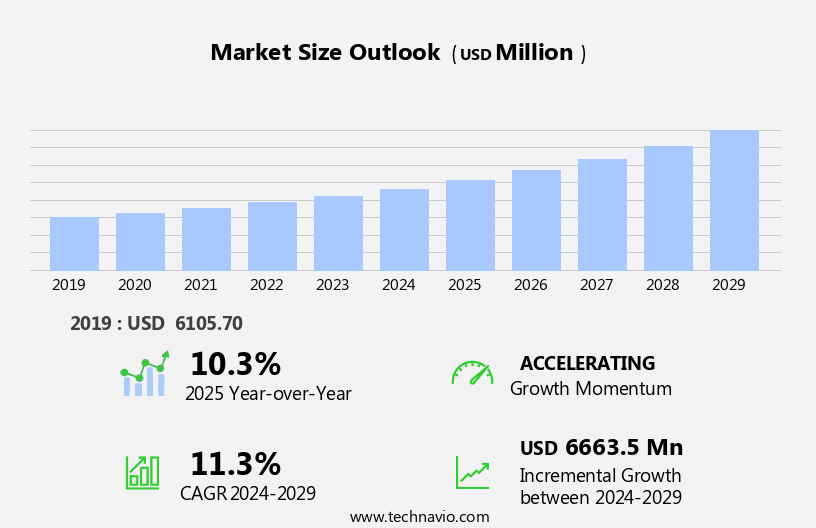
The procurement software market size is forecast to increase by USD 6.66 billion, at a CAGR of 11.3% between 2024 and 2029.

  • The market is experiencing significant growth, driven by the expanding e-commerce and organized retail industries. These sectors' increasing reliance on efficient and automated procurement processes is fueling market expansion. Additionally, the integration of Artificial Intelligence (AI) in procurement is revolutionizing the way businesses manage their supply chains. This technological advancement enables more accurate forecasting, streamlined workflows, and enhanced supplier relationship management. However, the market's growth is not without challenges. The complexity of integrating procurement software with existing systems and supplier onboarding processes presents significant obstacles.
  • Companies must invest time and resources to ensure seamless implementation and adoption of these solutions. Despite these challenges, the potential benefits of implementing procurement software, including cost savings, increased efficiency, and improved supplier relationships, make it an attractive investment for businesses seeking to optimize their operations and gain a competitive edge.

What will be the Size of the Procurement Software Market during the forecast period?

Procurement Software Market Size

Explore in-depth regional segment analysis with market size data - historical 2019-2023 and forecasts 2025-2029 - in the full report.  
Request Free Sample

The market continues to evolve, with dynamic market activities unfolding across various sectors. Centralized procurement solutions enable organizations to streamline their procurement processes, integrating API for seamless data exchange and enhancing collaboration. Procurement automation and artificial intelligence (AI) are transforming workflows, enabling real-time tracking, automated approvals, and improved compliance. Supplier performance management is a critical component, ensuring effective relationships and reducing risk. On-premise solutions offer data security and customization, while cloud-based solutions provide accessibility and scalability. Training and support are essential for user adoption, with custom reports and data analytics facilitating better decision-making. Inventory management, demand planning, and purchase order management are integrated functions, ensuring spend visibility and efficiency gains.

RFX management streamlines the request for proposal process, while contract lifecycle management enhances negotiation and compliance. Data security, machine learning (ML), and user experience (UX) are key considerations, with multi-currency support and real-time tracking enhancing global procurement capabilities. Blockchain technology and supplier relationship management offer additional benefits, while reporting dashboards and strategic sourcing drive cost savings. The market's continuous dynamism is reflected in the ongoing adoption of advanced features, including legal review, change management, spend analysis, supply chain visibility, invoice processing, mobile procurement, and offline functionality. These innovations enable organizations to optimize their procurement processes, reducing costs and improving operational efficiency.

How is this Procurement Software Industry segmented?

The procurement software industry research report provides comprehensive data (region-wise segment analysis), with forecasts and estimates in "USD million" for the period 2025-2029, as well as historical data from 2019-2023 for the following segments.

  • Deployment
    • Cloud-based
    • On-premises
  • End-user
    • Retail and e-commerce
    • Healthcare and pharmaceuticals
    • Manufacturing and automotive
    • IT and telecom
    • Others
  • Geography
    • North America
      • US
      • Canada
    • Europe
      • France
      • Germany
      • Italy
      • UK
    • APAC
      • China
      • India
      • Japan
      • South Korea
    • Rest of World (ROW)

    By Deployment Insights

    The cloud-based segment is estimated to witness significant growth during the forecast period.

    Procurement software solutions have gained significant traction in the business world, with many companies, such as BirchStreet Systems and Coupa Software, offering cloud-based alternatives. These solutions automate and streamline procurement processes, providing numerous benefits. Workflow automation and company portals facilitate efficient communication and collaboration between buyers and suppliers. Business intelligence tools enable data-driven decision-making through advanced data analytics and reporting. Legal review, change management, and spend analysis ensure compliance and control over procurement activities. Supply chain visibility, custom reports, and workflow customization offer greater transparency and flexibility. Centralized procurement, API integration, and enhanced collaboration reduce manual processes and errors.

    Procurement automation, artificial intelligence, and machine learning technologies further optimize processes and improve efficiency. Cloud-based solutions offer cost savings, as they eliminate the need for on-premises hardware and software installations. Real-time tracking, multi-currency support, and mobile accessibility ensure flexibility and convenience. Contract lifecycle management, risk management, and requisition management streamline the entire procurement process. Moreover, data security, supplier relationship management, and multi-lingual support cater to the evolving needs of global businesses. Reporting dashboards, strategic sourcing, and blockchain technology enhance transparency and security. User experience, category management, and data visualization facilitate better decision-making. Overall, procurement software solutions continue to evolve, offering significant benefits to businesses of all sizes.

    Procurement Software Market Size

    Request Free Sample

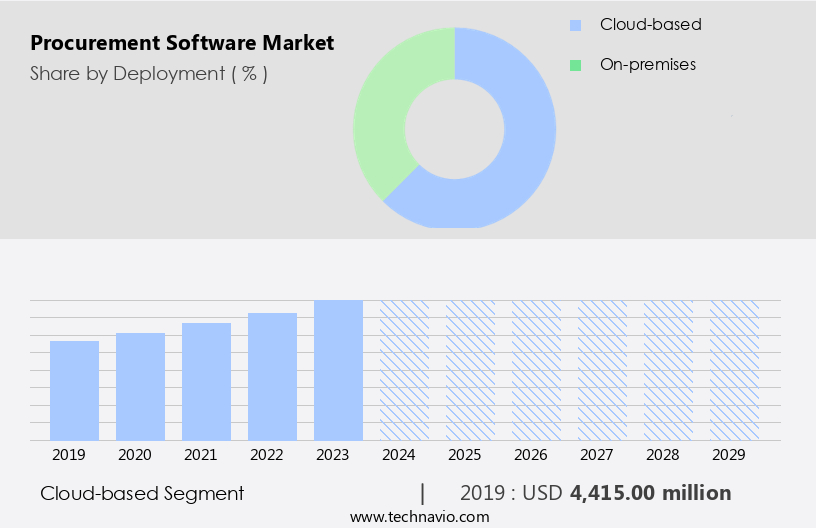
    The Cloud-based segment was valued at USD 4.42 billion in 2019 and showed a gradual increase during the forecast period.

    Regional Analysis

    North America is estimated to contribute 37% to the growth of the global market during the forecast period.Technavio’s analysts have elaborately explained the regional trends and drivers that shape the market during the forecast period.

    Procurement Software Market Share by Geography

     Request Free Sample

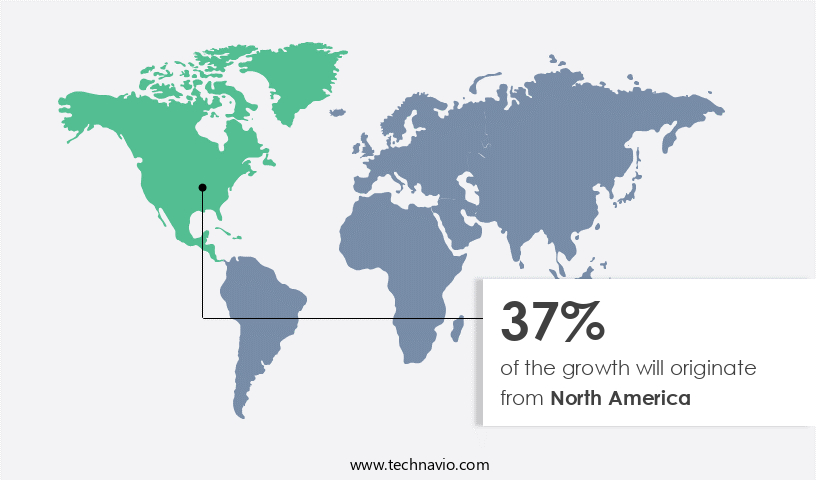
    In The market, North America holds a prominent position with a substantial market share. Key players and a vast consumer base characterize this region. Notable advancements in digitalization and technological innovations have fueled the market's expansion in North America. Procurement automation, the widespread adoption of cloud-based procurement solutions, and the necessity for effective supply chain management are primary growth drivers. Large enterprises in North America, many of which are early adopters, have integrated procurement software to optimize their procurement processes, minimize costs, and boost operational efficiency. Procurement software solutions in this region offer features such as workflow automation, company portals, business intelligence, legal review, change management, spend analysis, supply chain visibility, custom reports, workflow customization, data analytics, invoice processing, mobile procurement, offline functionality, spend visibility, centralized procurement, API integration, enhanced collaboration, procurement automation, artificial intelligence, supplier performance management, on-premise solutions, training and support, purchase order management, inventory management, demand planning, automated approvals, efficiency gains, RFX management, contract lifecycle management, reduced risk, reporting and analytics, improved compliance, global procurement, contract negotiation, data security, mobile accessibility, system integration, machine learning, supplier relationship management, multi-lingual support, reporting dashboards, strategic sourcing, blockchain technology, user experience, real-time tracking, multi-currency support, user adoption, category management, data visualization, better decision-making, risk management, requisition management, and cost savings.

    These features cater to the evolving needs of businesses, ensuring seamless procurement processes and enhanced collaboration between stakeholders.

    Market Dynamics

    Our researchers analyzed the data with 2024 as the base year, along with the key drivers, trends, and challenges. A holistic analysis of drivers will help companies refine their marketing strategies to gain a competitive advantage.

    In the dynamic and evolving business landscape, the market plays a pivotal role in streamlining and optimizing organizational spending. Procurement solutions enable companies to automate and manage the entire procurement process, from requisition to invoice processing. Key features include supplier management, contract management, workflow automation, and real-time reporting. These tools facilitate efficient communication between buyers and suppliers, ensuring compliance with regulations and policies. Additionally, they offer robust analytics capabilities, enabling data-driven decision-making and cost savings. Procurement software solutions cater to various industries, including manufacturing, healthcare, education, and finance, providing customizable options to meet unique business needs. By leveraging these technologies, organizations can enhance operational efficiency, reduce costs, and improve supplier relationships.

    What are the key market drivers leading to the rise in the adoption of Procurement Software Industry?

    • The e-commerce and organized retail sectors are primary growth drivers in the market, with their continued expansion significantly contributing to its development. 

    • Procurement software plays a crucial role in streamlining business operations for organizations, particularly those in the retail sector. This technology automates workflows, enabling seamless communication between buyers and suppliers through company portals. Business intelligence (BI) capabilities offer data analytics for effective spend analysis and supply chain visibility. Legal reviews and change management tools ensure compliance and efficiency. Custom reports and workflow customization cater to unique business requirements.
    • Data analytics and invoice processing are integral features, providing valuable insights for decision-making. Mobile procurement and offline functionality offer flexibility and convenience. Spend visibility is essential for controlling costs and optimizing resources. Procurement software is a valuable investment for businesses seeking to enhance operational efficiency, reduce costs, and improve supplier relationships.

    What are the market trends shaping the Procurement Software Industry?

    • The integration of artificial intelligence (AI) into procurement processes is a current market trend. This advanced technology enhances efficiency and accuracy in various aspects of procurement, including supplier selection, contract management, and order processing.

    • The digital transformation of businesses is driving the adoption of real-time solutions, including centralized procurement systems, to gain a competitive edge in the market. Procurement software is a critical component of this transformation, offering features such as API integration, enhanced collaboration, and procurement automation. Artificial intelligence (AI) is increasingly being incorporated into these systems, enabling virtual agents and chatbots, suggestive web searches, pattern recognition, machine translation, and automatic scheduling. This integration enhances the efficiency and accuracy of procurement processes, providing enterprises with a centralized view of their business-associated information and activities.
    • Additionally, supplier performance management, purchase order management, inventory management, demand planning, automated approvals, and RFX management are essential procurement functions that these systems offer. Training and support are also crucial to ensure the successful implementation and utilization of these solutions.

    What challenges does the Procurement Software Industry face during its growth?

    • The integration complexity and supplier onboarding process are significant challenges that hinder industry growth by adding to operational complexities. 

    • Procurement software plays a crucial role in managing the complexities of global procurement for businesses. Cloud-based solutions have gained popularity due to their flexibility and ease of use. These systems offer features such as contract lifecycle management, reduced risk through improved compliance, reporting and analytics, and supplier relationship management. However, the integration of procurement software with existing systems and suppliers can pose challenges. Compatibility issues with outdated technologies in current systems can complicate the installation process, necessitating modifications. Furthermore, varying technological capabilities among suppliers can lead to delays in onboarding and hinder overall efficiency.
    • Other essential features include data security, mobile accessibility, system integration, machine learning, and multi-lingual support. Reporting dashboards provide valuable insights into spending patterns and trends, enhancing decision-making capabilities. Procurement software solutions offer significant benefits, but addressing the integration complexities is essential for successful implementation.

    Exclusive Customer Landscape

    The procurement software market forecasting report includes the adoption lifecycle of the market, covering from the innovator’s stage to the laggard’s stage. It focuses on adoption rates in different regions based on penetration. Furthermore, the procurement software market report also includes key purchase criteria and drivers of price sensitivity to help companies evaluate and develop their market growth analysis strategies.
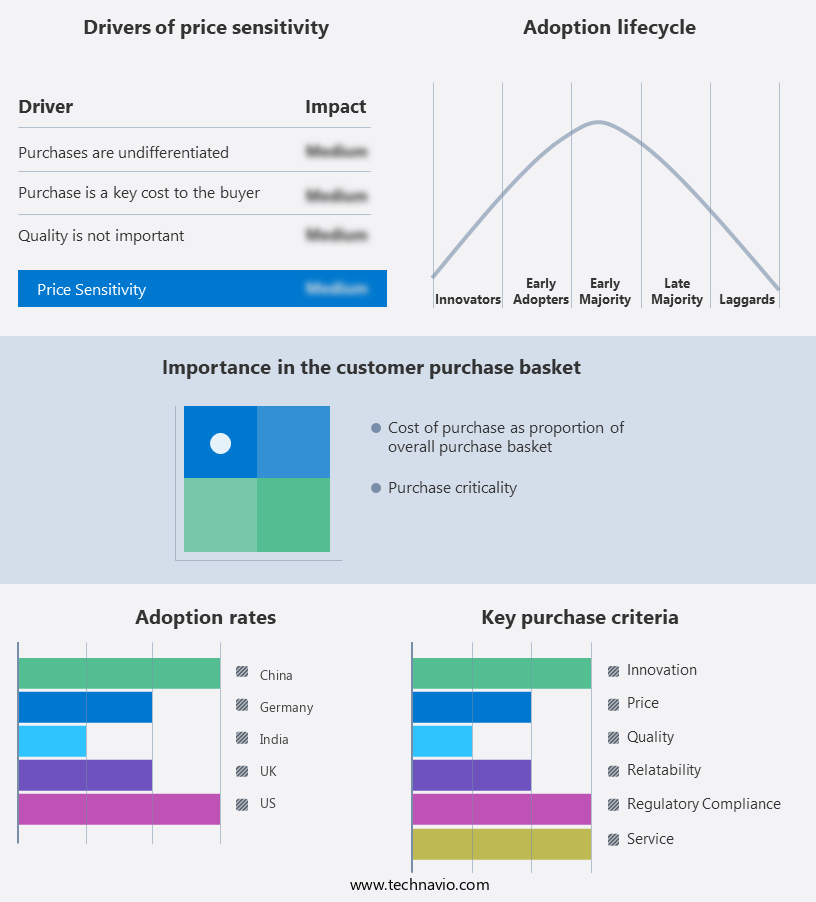
    Procurement Software Market Share by Geography

     Customer Landscape

    Key Companies & Market Insights

    Companies are implementing various strategies, such as strategic alliances, procurement software market forecast, partnerships, mergers and acquisitions, geographical expansion, and product/service launches, to enhance their presence in the industry.

    Basware Corp. - Procurement processes are optimized through Basware e-Procurement software, a leading solution streamlining purchasing workflows. This innovative technology enhances efficiency, reduces costs, and ensures compliance, making it an essential tool for modern businesses.

    The industry research and growth report includes detailed analyses of the competitive landscape of the market and information about key companies, including:

    • Basware Corp.
    • BirchStreet Systems Inc.
    • Coupa Software Inc.
    • Elcom System Ltd.
    • Enaviya Information Technology Pvt. Ltd.
    • Epicor Software Corp.
    • Ginni Systems Ltd.
    • Infor Inc.
    • International Business Machines Corp.
    • Ivalua Inc.
    • JAGGAER LLC
    • Microsoft Corp.
    • NB Ventures Inc.
    • Oracle Corp.
    • ORO Labs Inc.
    • SAP SE
    • ScienceSoft USA Corp.
    • SunSmart Technologies Pvt. Ltd.
    • SutiSoft Inc.
    • Tata Consultancy Services Ltd.
    • Tropic Technologies Inc.
    • Workday Inc.
    • Zycus Inc.

    Qualitative and quantitative analysis of companies has been conducted to help clients understand the wider business environment as well as the strengths and weaknesses of key industry players. Data is qualitatively analyzed to categorize companies as pure play, category-focused, industry-focused, and diversified; it is quantitatively analyzed to categorize companies as dominant, leading, strong, tentative, and weak.

    Recent Development and News in Procurement Software Market

    • In January 2024, Icertis, a leading provider of Contract Intelligence (CI) and Contract Lifecycle Management (CLM) solutions, announced the launch of its new Procurement Module, expanding its product offerings beyond contract management (Source: Icertis Press Release). This module aims to streamline procurement processes by automating workflows, enhancing supplier management, and providing real-time insights.
    • In March 2024, Coupa Software, a major player in business spend management, entered into a strategic partnership with Microsoft to integrate Coupa's solutions with Microsoft Dynamics 365 Finance and Operations (Source: Coupa Press Release). This collaboration enables seamless data flow between the two platforms, enhancing financial management and procurement capabilities for mutual customers.
    • In May 2025, Jaggaer, a global leader in Source-to-Pay (S2P) solutions, completed its acquisition of BravoSolution, a leading provider of strategic sourcing and supplier risk management solutions (Source: Jaggaer Press Release). This acquisition strengthens Jaggaer's S2P capabilities, expanding its offerings and enhancing its position in the market.
    • In the same month, Basware, a leading provider of networked source-to-pay solutions, secured a significant investment of €120 million from Nordic Capital, a European private equity firm (Source: Basware Press Release). The investment will support Basware's growth strategy, including product development, geographic expansion, and strategic acquisitions.

    Research Analyst Overview

    • The market is experiencing significant transformation, driven by digitalization and the integration of advanced analytics techniques. Sentiment analysis and text analytics are increasingly used to enhance supplier relationship management, while ethical sourcing and social responsibility are prioritized for supply chain transparency. Lean management and agile development are adopted for streamlined procurement processes, and knowledge management systems facilitate continuous improvement. Network effects and collaboration tools foster communication channels among stakeholders, enabling real-time information sharing and decision support. Change management and project management tools ensure smooth implementation of new procurement solutions. Regression analysis and time series analysis provide valuable insights for predictive modeling and economies of scale.
    • Cognitive computing and virtual assistants automate routine tasks, while automated alerts and decision support systems enable proactive risk management. Six sigma methodologies and data mining techniques optimize procurement processes, and diversity and inclusion initiatives contribute to a more effective and inclusive supply chain. Predictive analytics and cloud computing further enhance procurement intelligence and enable real-time data access.

    Dive into Technavio’s robust research methodology, blending expert interviews, extensive data synthesis, and validated models for unparalleled Procurement Software Market insights. See full methodology.

    Market Scope

    Report Coverage

    Details

    Page number

    210

    Base year

    2024

    Historic period

    2019-2023

    Forecast period

    2025-2029

    Growth momentum & CAGR

    Accelerate at a CAGR of 11.3%

    Market growth 2025-2029

    USD 6663.5 million

    Market structure

    Fragmented

    YoY growth 2024-2025(%)

    10.3

    Key countries

    US, Germany, Canada, UK, China, France, Italy, India, Japan, and South Korea

    Competitive landscape

    Leading Companies, Market Positioning of Companies, Competitive Strategies, and Industry Risks

    Request Free Sample

    What are the Key Data Covered in this Procurement Software Market Research and Growth Report?

    • CAGR of the Procurement Software industry during the forecast period
    • Detailed information on factors that will drive the growth and forecasting between 2025 and 2029
    • Precise estimation of the size of the market and its contribution of the industry in focus to the parent market
    • Accurate predictions about upcoming growth and trends and changes in consumer behaviour
    • Growth of the market across North America, Europe, APAC, South America, and Middle East and Africa
    • Thorough analysis of the market’s competitive landscape and detailed information about companies
    • Comprehensive analysis of factors that will challenge the procurement software market growth of industry companies

    We can help! Our analysts can customize this procurement software market research report to meet your requirements.

    Get in touch


    1 Executive Summary

    • 1.1 Market overview
      • Executive Summary - Chart on Market Overview
      • Executive Summary - Data Table on Market Overview
      • Executive Summary - Chart on Global Market Characteristics
      • Executive Summary - Chart on Market by Geography
      • Executive Summary - Chart on Market Segmentation by Deployment
      • Executive Summary - Chart on Market Segmentation by End-user
      • Executive Summary - Chart on Incremental Growth
      • Executive Summary - Data Table on Incremental Growth
      • Executive Summary - Chart on Company Market Positioning

    2 Technavio Analysis

    • 2.1 Analysis of price sensitivity, lifecycle, customer purchase basket, adoption rates, and purchase criteria
      • Analysis of price sensitivity, lifecycle, customer purchase basket, adoption rates, and purchase criteria
    • 2.2 Criticality of inputs and Factors of differentiation
      • Overview on criticality of inputs and factors of differentiation
    • 2.3 Factors of disruption
      • Overview on factors of disruption
    • 2.4 Impact of drivers and challenges
      • Impact of drivers and challenges in 2024 and 2029

    3 Market Landscape

    • 3.1 Market ecosystem
      • Parent Market
      • Data Table on - Parent Market
    • 3.2 Market characteristics
      • Market characteristics analysis
    • 3.3 Value chain analysis
      • Value chain analysis

    4 Market Sizing

    • 4.1 Market definition
      • Offerings of companies included in the market definition
    • 4.2 Market segment analysis
      • Market segments
    • 4.3 Market size 2024
      • 4.4 Market outlook: Forecast for 2024-2029
        • Chart on Global - Market size and forecast 2024-2029 ($ million)
        • Data Table on Global - Market size and forecast 2024-2029 ($ million)
        • Chart on Global Market: Year-over-year growth 2024-2029 (%)
        • Data Table on Global Market: Year-over-year growth 2024-2029 (%)

      5 Historic Market Size

      • 5.1 Global Procurement Software Market 2019 - 2023
        • Historic Market Size - Data Table on Global Procurement Software Market 2019 - 2023 ($ million)
      • 5.2 Deployment segment analysis 2019 - 2023
        • Historic Market Size - Deployment Segment 2019 - 2023 ($ million)
      • 5.3 End-user segment analysis 2019 - 2023
        • Historic Market Size - End-user Segment 2019 - 2023 ($ million)
      • 5.4 Geography segment analysis 2019 - 2023
        • Historic Market Size - Geography Segment 2019 - 2023 ($ million)
      • 5.5 Country segment analysis 2019 - 2023
        • Historic Market Size - Country Segment 2019 - 2023 ($ million)

      6 Qualitative Analysis

      • 6.1 Impact of AI in the global procurement software market

        7 Five Forces Analysis

        • 7.1 Five forces summary
          • Five forces analysis - Comparison between 2024 and 2029
        • 7.2 Bargaining power of buyers
          • Bargaining power of buyers - Impact of key factors 2024 and 2029
        • 7.3 Bargaining power of suppliers
          • Bargaining power of suppliers - Impact of key factors in 2024 and 2029
        • 7.4 Threat of new entrants
          • Threat of new entrants - Impact of key factors in 2024 and 2029
        • 7.5 Threat of substitutes
          • Threat of substitutes - Impact of key factors in 2024 and 2029
        • 7.6 Threat of rivalry
          • Threat of rivalry - Impact of key factors in 2024 and 2029
        • 7.7 Market condition
          • Chart on Market condition - Five forces 2024 and 2029

        8 Market Segmentation by Deployment

        • 8.1 Market segments
          • Chart on Deployment - Market share 2024-2029 (%)
          • Data Table on Deployment - Market share 2024-2029 (%)
        • 8.2 Comparison by Deployment
          • Chart on Comparison by Deployment
          • Data Table on Comparison by Deployment
        • 8.3 Cloud-based - Market size and forecast 2024-2029
          • Chart on Cloud-based - Market size and forecast 2024-2029 ($ million)
          • Data Table on Cloud-based - Market size and forecast 2024-2029 ($ million)
          • Chart on Cloud-based - Year-over-year growth 2024-2029 (%)
          • Data Table on Cloud-based - Year-over-year growth 2024-2029 (%)
        • 8.4 On-premises - Market size and forecast 2024-2029
          • Chart on On-premises - Market size and forecast 2024-2029 ($ million)
          • Data Table on On-premises - Market size and forecast 2024-2029 ($ million)
          • Chart on On-premises - Year-over-year growth 2024-2029 (%)
          • Data Table on On-premises - Year-over-year growth 2024-2029 (%)
        • 8.5 Market opportunity by Deployment
          • Market opportunity by Deployment ($ million)
          • Data Table on Market opportunity by Deployment ($ million)

        9 Market Segmentation by End-user

        • 9.1 Market segments
          • Chart on End-user - Market share 2024-2029 (%)
          • Data Table on End-user - Market share 2024-2029 (%)
        • 9.2 Comparison by End-user
          • Chart on Comparison by End-user
          • Data Table on Comparison by End-user
        • 9.3 Retail and e-commerce - Market size and forecast 2024-2029
          • Chart on Retail and e-commerce - Market size and forecast 2024-2029 ($ million)
          • Data Table on Retail and e-commerce - Market size and forecast 2024-2029 ($ million)
          • Chart on Retail and e-commerce - Year-over-year growth 2024-2029 (%)
          • Data Table on Retail and e-commerce - Year-over-year growth 2024-2029 (%)
        • 9.4 Healthcare and pharmaceuticals - Market size and forecast 2024-2029
          • Chart on Healthcare and pharmaceuticals - Market size and forecast 2024-2029 ($ million)
          • Data Table on Healthcare and pharmaceuticals - Market size and forecast 2024-2029 ($ million)
          • Chart on Healthcare and pharmaceuticals - Year-over-year growth 2024-2029 (%)
          • Data Table on Healthcare and pharmaceuticals - Year-over-year growth 2024-2029 (%)
        • 9.5 Manufacturing and automotive - Market size and forecast 2024-2029
          • Chart on Manufacturing and automotive - Market size and forecast 2024-2029 ($ million)
          • Data Table on Manufacturing and automotive - Market size and forecast 2024-2029 ($ million)
          • Chart on Manufacturing and automotive - Year-over-year growth 2024-2029 (%)
          • Data Table on Manufacturing and automotive - Year-over-year growth 2024-2029 (%)
        • 9.6 IT and telecom - Market size and forecast 2024-2029
          • Chart on IT and telecom - Market size and forecast 2024-2029 ($ million)
          • Data Table on IT and telecom - Market size and forecast 2024-2029 ($ million)
          • Chart on IT and telecom - Year-over-year growth 2024-2029 (%)
          • Data Table on IT and telecom - Year-over-year growth 2024-2029 (%)
        • 9.7 Others - Market size and forecast 2024-2029
          • Chart on Others - Market size and forecast 2024-2029 ($ million)
          • Data Table on Others - Market size and forecast 2024-2029 ($ million)
          • Chart on Others - Year-over-year growth 2024-2029 (%)
          • Data Table on Others - Year-over-year growth 2024-2029 (%)
        • 9.8 Market opportunity by End-user
          • Market opportunity by End-user ($ million)
          • Data Table on Market opportunity by End-user ($ million)

        10 Customer Landscape

        • 10.1 Customer landscape overview
          • Analysis of price sensitivity, lifecycle, customer purchase basket, adoption rates, and purchase criteria

        11 Geographic Landscape

        • 11.1 Geographic segmentation
          • Chart on Market share by geography 2024-2029 (%)
          • Data Table on Market share by geography 2024-2029 (%)
        • 11.2 Geographic comparison
          • Chart on Geographic comparison
          • Data Table on Geographic comparison
        • 11.3 North America - Market size and forecast 2024-2029
          • Chart on North America - Market size and forecast 2024-2029 ($ million)
          • Data Table on North America - Market size and forecast 2024-2029 ($ million)
          • Chart on North America - Year-over-year growth 2024-2029 (%)
          • Data Table on North America - Year-over-year growth 2024-2029 (%)
        • 11.4 Europe - Market size and forecast 2024-2029
          • Chart on Europe - Market size and forecast 2024-2029 ($ million)
          • Data Table on Europe - Market size and forecast 2024-2029 ($ million)
          • Chart on Europe - Year-over-year growth 2024-2029 (%)
          • Data Table on Europe - Year-over-year growth 2024-2029 (%)
        • 11.5 APAC - Market size and forecast 2024-2029
          • Chart on APAC - Market size and forecast 2024-2029 ($ million)
          • Data Table on APAC - Market size and forecast 2024-2029 ($ million)
          • Chart on APAC - Year-over-year growth 2024-2029 (%)
          • Data Table on APAC - Year-over-year growth 2024-2029 (%)
        • 11.6 South America - Market size and forecast 2024-2029
          • Chart on South America - Market size and forecast 2024-2029 ($ million)
          • Data Table on South America - Market size and forecast 2024-2029 ($ million)
          • Chart on South America - Year-over-year growth 2024-2029 (%)
          • Data Table on South America - Year-over-year growth 2024-2029 (%)
        • 11.7 Middle East and Africa - Market size and forecast 2024-2029
          • Chart on Middle East and Africa - Market size and forecast 2024-2029 ($ million)
          • Data Table on Middle East and Africa - Market size and forecast 2024-2029 ($ million)
          • Chart on Middle East and Africa - Year-over-year growth 2024-2029 (%)
          • Data Table on Middle East and Africa - Year-over-year growth 2024-2029 (%)
        • 11.8 US - Market size and forecast 2024-2029
          • Chart on US - Market size and forecast 2024-2029 ($ million)
          • Data Table on US - Market size and forecast 2024-2029 ($ million)
          • Chart on US - Year-over-year growth 2024-2029 (%)
          • Data Table on US - Year-over-year growth 2024-2029 (%)
        • 11.9 Canada - Market size and forecast 2024-2029
          • Chart on Canada - Market size and forecast 2024-2029 ($ million)
          • Data Table on Canada - Market size and forecast 2024-2029 ($ million)
          • Chart on Canada - Year-over-year growth 2024-2029 (%)
          • Data Table on Canada - Year-over-year growth 2024-2029 (%)
        • 11.10 Germany - Market size and forecast 2024-2029
          • Chart on Germany - Market size and forecast 2024-2029 ($ million)
          • Data Table on Germany - Market size and forecast 2024-2029 ($ million)
          • Chart on Germany - Year-over-year growth 2024-2029 (%)
          • Data Table on Germany - Year-over-year growth 2024-2029 (%)
        • 11.11 UK - Market size and forecast 2024-2029
          • Chart on UK - Market size and forecast 2024-2029 ($ million)
          • Data Table on UK - Market size and forecast 2024-2029 ($ million)
          • Chart on UK - Year-over-year growth 2024-2029 (%)
          • Data Table on UK - Year-over-year growth 2024-2029 (%)
        • 11.12 China - Market size and forecast 2024-2029
          • Chart on China - Market size and forecast 2024-2029 ($ million)
          • Data Table on China - Market size and forecast 2024-2029 ($ million)
          • Chart on China - Year-over-year growth 2024-2029 (%)
          • Data Table on China - Year-over-year growth 2024-2029 (%)
        • 11.13 France - Market size and forecast 2024-2029
          • Chart on France - Market size and forecast 2024-2029 ($ million)
          • Data Table on France - Market size and forecast 2024-2029 ($ million)
          • Chart on France - Year-over-year growth 2024-2029 (%)
          • Data Table on France - Year-over-year growth 2024-2029 (%)
        • 11.14 India - Market size and forecast 2024-2029
          • Chart on India - Market size and forecast 2024-2029 ($ million)
          • Data Table on India - Market size and forecast 2024-2029 ($ million)
          • Chart on India - Year-over-year growth 2024-2029 (%)
          • Data Table on India - Year-over-year growth 2024-2029 (%)
        • 11.15 Italy - Market size and forecast 2024-2029
          • Chart on Italy - Market size and forecast 2024-2029 ($ million)
          • Data Table on Italy - Market size and forecast 2024-2029 ($ million)
          • Chart on Italy - Year-over-year growth 2024-2029 (%)
          • Data Table on Italy - Year-over-year growth 2024-2029 (%)
        • 11.16 Japan - Market size and forecast 2024-2029
          • Chart on Japan - Market size and forecast 2024-2029 ($ million)
          • Data Table on Japan - Market size and forecast 2024-2029 ($ million)
          • Chart on Japan - Year-over-year growth 2024-2029 (%)
          • Data Table on Japan - Year-over-year growth 2024-2029 (%)
        • 11.17 South Korea - Market size and forecast 2024-2029
          • Chart on South Korea - Market size and forecast 2024-2029 ($ million)
          • Data Table on South Korea - Market size and forecast 2024-2029 ($ million)
          • Chart on South Korea - Year-over-year growth 2024-2029 (%)
          • Data Table on South Korea - Year-over-year growth 2024-2029 (%)
        • 11.18 Market opportunity by geography
          • Market opportunity by geography ($ million)
          • Data Tables on Market opportunity by geography ($ million)

        12 Drivers, Challenges, and Opportunity/Restraints

        • 12.1 Market drivers
          • 12.2 Market challenges
            • 12.3 Impact of drivers and challenges
              • Impact of drivers and challenges in 2024 and 2029
            • 12.4 Market opportunities/restraints

              13 Competitive Landscape

              • 13.1 Overview
                • 13.2 Competitive Landscape
                  • Overview on criticality of inputs and factors of differentiation
                • 13.3 Landscape disruption
                  • Overview on factors of disruption
                • 13.4 Industry risks
                  • Impact of key risks on business

                14 Competitive Analysis

                • 14.1 Companies profiled
                  • Companies covered
                • 14.2 Company ranking index
                  • Company ranking index
                • 14.3 Market positioning of companies
                  • Matrix on companies position and classification
                • 14.4 Basware Corp.
                  • Basware Corp. - Overview
                  • Basware Corp. - Product / Service
                  • Basware Corp. - Key offerings
                  • SWOT
                • 14.5 Coupa Software Inc.
                  • Coupa Software Inc. - Overview
                  • Coupa Software Inc. - Product / Service
                  • Coupa Software Inc. - Key offerings
                  • SWOT
                • 14.6 Elcom System Ltd.
                  • Elcom System Ltd. - Overview
                  • Elcom System Ltd. - Product / Service
                  • Elcom System Ltd. - Key offerings
                  • SWOT
                • 14.7 Epicor Software Corp.
                  • Epicor Software Corp. - Overview
                  • Epicor Software Corp. - Product / Service
                  • Epicor Software Corp. - Key news
                  • Epicor Software Corp. - Key offerings
                  • SWOT
                • 14.8 Ginni Systems Ltd.
                  • Ginni Systems Ltd. - Overview
                  • Ginni Systems Ltd. - Product / Service
                  • Ginni Systems Ltd. - Key offerings
                  • SWOT
                • 14.9 Infor Inc.
                  • Infor Inc. - Overview
                  • Infor Inc. - Product / Service
                  • Infor Inc. - Key news
                  • Infor Inc. - Key offerings
                  • SWOT
                • 14.10 International Business Machines Corp.
                  • International Business Machines Corp. - Overview
                  • International Business Machines Corp. - Business segments
                  • International Business Machines Corp. - Key news
                  • International Business Machines Corp. - Key offerings
                  • International Business Machines Corp. - Segment focus
                  • SWOT
                • 14.11 Ivalua Inc.
                  • Ivalua Inc. - Overview
                  • Ivalua Inc. - Product / Service
                  • Ivalua Inc. - Key offerings
                  • SWOT
                • 14.12 JAGGAER LLC
                  • JAGGAER LLC - Overview
                  • JAGGAER LLC - Product / Service
                  • JAGGAER LLC - Key offerings
                  • SWOT
                • 14.13 Microsoft Corp.
                  • Microsoft Corp. - Overview
                  • Microsoft Corp. - Business segments
                  • Microsoft Corp. - Key news
                  • Microsoft Corp. - Key offerings
                  • Microsoft Corp. - Segment focus
                  • SWOT
                • 14.14 Oracle Corp.
                  • Oracle Corp. - Overview
                  • Oracle Corp. - Business segments
                  • Oracle Corp. - Key news
                  • Oracle Corp. - Key offerings
                  • Oracle Corp. - Segment focus
                  • SWOT
                • 14.15 SAP SE
                  • SAP SE - Overview
                  • SAP SE - Business segments
                  • SAP SE - Key news
                  • SAP SE - Key offerings
                  • SAP SE - Segment focus
                  • SWOT
                • 14.16 SunSmart Technologies Pvt. Ltd.
                  • SunSmart Technologies Pvt. Ltd. - Overview
                  • SunSmart Technologies Pvt. Ltd. - Product / Service
                  • SunSmart Technologies Pvt. Ltd. - Key offerings
                  • SWOT
                • 14.17 Tata Consultancy Services Ltd.
                  • Tata Consultancy Services Ltd. - Overview
                  • Tata Consultancy Services Ltd. - Business segments
                  • Tata Consultancy Services Ltd. - Key news
                  • Tata Consultancy Services Ltd. - Key offerings
                  • Tata Consultancy Services Ltd. - Segment focus
                  • SWOT
                • 14.18 Zycus Inc.
                  • Zycus Inc. - Overview
                  • Zycus Inc. - Product / Service
                  • Zycus Inc. - Key offerings
                  • SWOT

                15 Appendix

                • 15.1 Scope of the report
                  • 15.2 Inclusions and exclusions checklist
                    • Inclusions checklist
                    • Exclusions checklist
                  • 15.3 Currency conversion rates for US$
                    • Currency conversion rates for US$
                  • 15.4 Research methodology
                    • Research methodology
                  • 15.5 Data procurement
                    • Information sources
                  • 15.6 Data validation
                    • Data validation
                  • 15.7 Validation techniques employed for market sizing
                    • Validation techniques employed for market sizing
                  • 15.8 Data synthesis
                    • Data synthesis
                  • 15.9 360 degree market analysis
                    • 360 degree market analysis
                  • 15.10 List of abbreviations
                    • List of abbreviations

                  Research Methodology

                  Technavio presents a detailed picture of the market by way of study, synthesis, and summation of data from multiple sources. The analysts have presented the various facets of the market with a particular focus on identifying the key industry influencers. The data thus presented is comprehensive, reliable, and the result of extensive research, both primary and secondary.

                  INFORMATION SOURCES

                  Primary sources

                  • Manufacturers and suppliers
                  • Channel partners
                  • Industry experts
                  • Strategic decision makers

                  Secondary sources

                  • Industry journals and periodicals
                  • Government data
                  • Financial reports of key industry players
                  • Historical data
                  • Press releases

                  DATA ANALYSIS

                  Data Synthesis

                  • Collation of data
                  • Estimation of key figures
                  • Analysis of derived insights

                  Data Validation

                  • Triangulation with data models
                  • Reference against proprietary databases
                  • Corroboration with industry experts

                  REPORT WRITING

                  Qualitative

                  • Market drivers
                  • Market challenges
                  • Market trends
                  • Five forces analysis

                  Quantitative

                  • Market size and forecast
                  • Market segmentation
                  • Geographical insights
                  • Competitive landscape

                  Interested in this report?

                  Get your sample now to see our research methodology and insights!

                  Download Now

                  Frequently Asked Questions

                  Procurement Software market growth will increase by $ 6663.5 mn during 2025-2029.

                  The Procurement Software market is expected to grow at a CAGR of 11.3% during 2025-2029.

                  Procurement Software market is segmented by Deployment( Cloud-based, On-premises) End-user( Retail and e-commerce, Healthcare and pharmaceuticals, Manufacturing and automotive, IT and telecom, Others)

                  Basware Corp., BirchStreet Systems Inc., Coupa Software Inc., Elcom System Ltd., Enaviya Information Technology Pvt. Ltd., Epicor Software Corp., Ginni Systems Ltd., Infor Inc., International Business Machines Corp., Ivalua Inc., JAGGAER LLC, Microsoft Corp., NB Ventures Inc., Oracle Corp., ORO Labs Inc., SAP SE, ScienceSoft USA Corp., SunSmart Technologies Pvt. Ltd., SutiSoft Inc., Tata Consultancy Services Ltd., Tropic Technologies Inc., Workday Inc., Zycus Inc. are a few of the key vendors in the Procurement Software market.

                  North America will register the highest growth rate of 37% among the other regions. Therefore, the Procurement Software market in North America is expected to garner significant business opportunities for the vendors during the forecast period.

                  US, Germany, Canada, UK, China, France, Italy, India, Japan, South Korea

                  • Growth in e-commerce and organized retail industryOrganized retail refers to a chain of retail stores that are either entirely owned or franchised or managed by a single corporate entity. The organized retail sector accounts for a dominant share of overall retail sales in countries such as the US and Canada. Packaged products is the driving factor this market.
                  • especially in the fast-moving consumer goods (FMCG) segment (products such as drinks is the driving factor this market.
                  • fruits is the driving factor this market.
                  • and grocery items) is the driving factor this market.
                  • constitute a key component of organized retail sales. The US currently leads the global organized retail segment because of the presence of extremely diversified retail chains such as Walmart Inc (Walmart) is the driving factor this market.
                  • Costco Wholesale Corp (Costco Wholesale) is the driving factor this market.
                  • The Kroger Co (Kroger) is the driving factor this market.
                  • and Target Brands Inc (Target Brands). Procurement of supplies or materials is one of the most important aspects of the retail industry. Procurement software will help enterprises reduce the risks associated with the supply base by integrating data is the driving factor this market.
                  • contract management is the driving factor this market.
                  • and supplier management. This is the driving factor this market.
                  • in turn is the driving factor this market.
                  • will lead to an increase in demand for procurement software during the forecast period. In addition is the driving factor this market.
                  • the growth of the e-commerce sector has a direct impact on the global procurement software market. Consumers prefer shopping online over brick-and-mortar stores. The growth of the e-commerce sector globally is primarily attributed to the adoption of technologies such as smartphones and omnichannel commerce. Enterprises in the e-commerce sector use procurement software to avail products from suppliers. Procurement software will help them in supplier management. Thus is the driving factor this market.
                  • the growth of the e-commerce sector will increase the demand for procurement software is the driving factor this market.
                  • which will drive the growth of the global procurement market during the forecast period. is the driving factor this market.

                  The Procurement Software market vendors should focus on grabbing business opportunities from the Cloud-based segment as it accounted for the largest market share in the base year.