Second Life EV Battery Market Analysis, Size, and Forecast 2026-2030: APAC (China, Japan, and South Korea), North America (US, Canada, and Mexico), Europe (Germany, France, and UK), Middle East and Africa (Saudi Arabia, UAE, and South Africa), South America (Brazil, Argentina, and Colombia), and Rest of World (ROW)

Second Life EV Battery Market Analysis, Size, and Forecast 2026-2030:
APAC (China, Japan, and South Korea), North America (US, Canada, and Mexico), Europe (Germany, France, and UK), Middle East and Africa (Saudi Arabia, UAE, and South Africa), South America (Brazil, Argentina, and Colombia), and Rest of World (ROW)

Published: May 2026 308 Pages SKU: IRTNTR81490

Market Overview at a Glance

$1.93 B
Market Opportunity
24.7%
CAGR 2025 - 2030
60.2%
APAC Growth
$413 Mn
LFP segment 2024

Second Life EV Battery Market Size 2026-2030

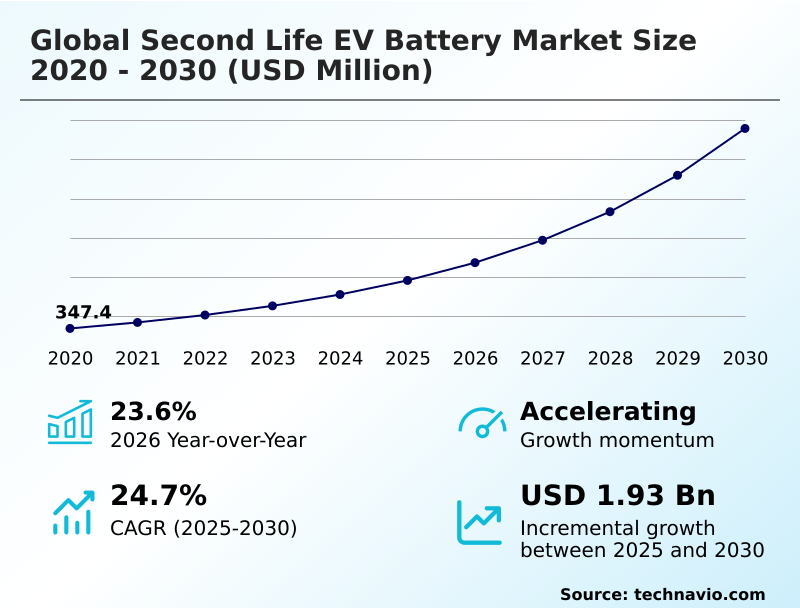
The second life ev battery market size is valued to increase by USD 1.93 billion, at a CAGR of 24.7% from 2025 to 2030. Escalating demand for economical energy storage solutions will drive the second life ev battery market.

Major Market Trends & Insights

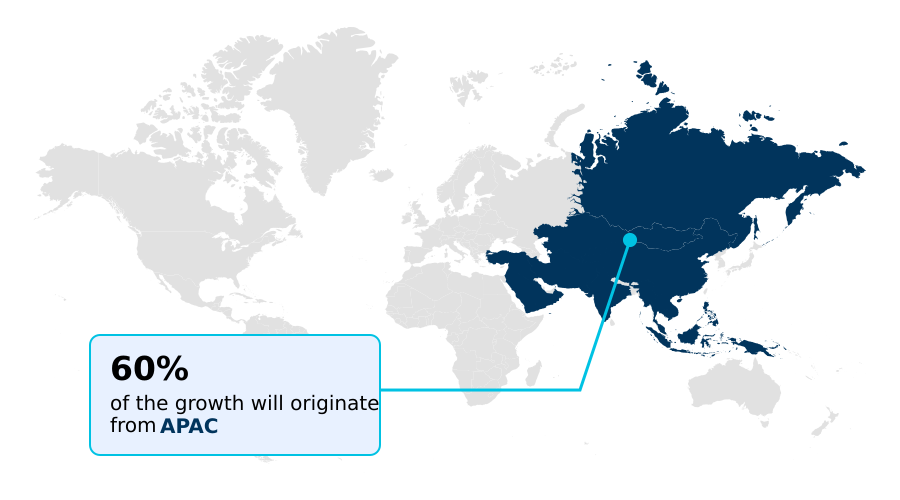
  • APAC dominated the market and accounted for a 60.2% growth during the forecast period.
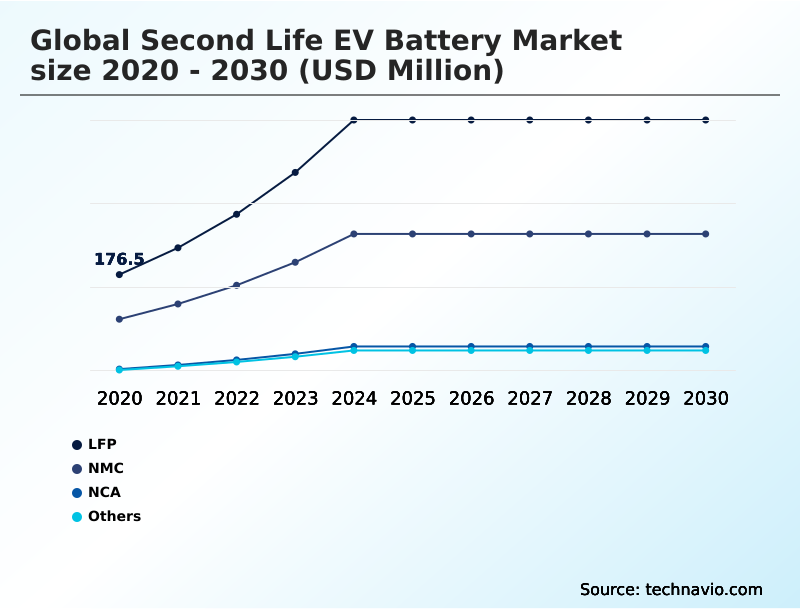
  • By Type - LFP segment was valued at USD 413 million in 2024
  • By Application - Utilities and grid operators segment accounted for the largest market revenue share in 2024

Market Size & Forecast

  • Market Opportunities: USD 2.55 billion
  • Market Future Opportunities: USD 1.93 billion
  • CAGR from 2025 to 2030 : 24.7%

Market Summary

  • The second life EV battery market is a structured ecosystem for refurbishing and redeploying lithium-ion batteries from electric vehicles for stationary applications. A core driver is the escalating demand for economical energy storage, where repurposed batteries offer a cost-effective alternative to new units for grid stabilization and renewable energy integration.
  • This market is defined by its commitment to circular economy principles, extending asset lifespans before resource-intensive material recovery is necessary. Key trends include the integration of digital battery passport systems, leveraging AI and blockchain to enhance transparency and accurately track battery state of health, which is critical for valuation and safety.
  • However, the industry faces challenges from the technical heterogeneity among battery chemistries and form factors, which complicates the battery repurposing and battery remanufacturing processes. Proprietary battery management systems further hinder universal diagnostic efforts. For instance, a logistics firm can implement a behind-the-meter storage system using second-life batteries to power its warehouse operations.
  • By charging the system during off-peak hours and discharging during peak times, the firm avoids high demand charges, significantly reducing operational energy costs and improving its environmental credentials without the high capital outlay for a new system.

What will be the Size of the Second Life EV Battery Market during the forecast period?

Get Key Insights on Market Forecast (PDF) Get Free Sample

How is the Second Life EV Battery Market Segmented?

The second life ev battery industry research report provides comprehensive data (region-wise segment analysis), with forecasts and estimates in "USD million" for the period 2026-2030, as well as historical data from 2020-2024 for the following segments.

  • Type
    • LFP
    • NMC
    • NCA
    • Others
  • Application
    • Utilities and grid operators
    • Commercial and industrial users
    • Telecom and infrastructure
    • Residential users
    • Others
  • Product
    • Repurpose
    • Refurbishment
    • Reuse
  • Geography
    • APAC
      • China
      • Japan
      • South Korea
    • North America
      • US
      • Canada
      • Mexico
    • Europe
      • Germany
      • France
      • UK
    • Middle East and Africa
      • Saudi Arabia
      • UAE
      • South Africa
    • South America
      • Brazil
      • Argentina
      • Colombia
    • Rest of World (ROW)

By Type Insights

The lfp segment is estimated to witness significant growth during the forecast period.

The lithium iron phosphate (LFP) segment is a cornerstone of the market, prized for its superior thermal safety and extended cycle life, which are critical for stationary energy storage.

As automotive manufacturers adopt LFP for mass-market vehicles, a substantial volume of decommissioned units enters the secondary market. These batteries, typically retaining approximately 80% of their original capacity, provide a cost-effective solution for various second life battery applications.

The battery repurposing process for LFP is streamlined due to the stability of prismatic cells, facilitating easier battery grading and sorting. This supports circular economy principles by maximizing asset utility before final battery remanufacturing.

The inherent resilience of LFP chemistry simplifies repurposed battery diagnostics and cell-level testing, solidifying its dominant position in effective end-of-life battery management.

Get Free Sample

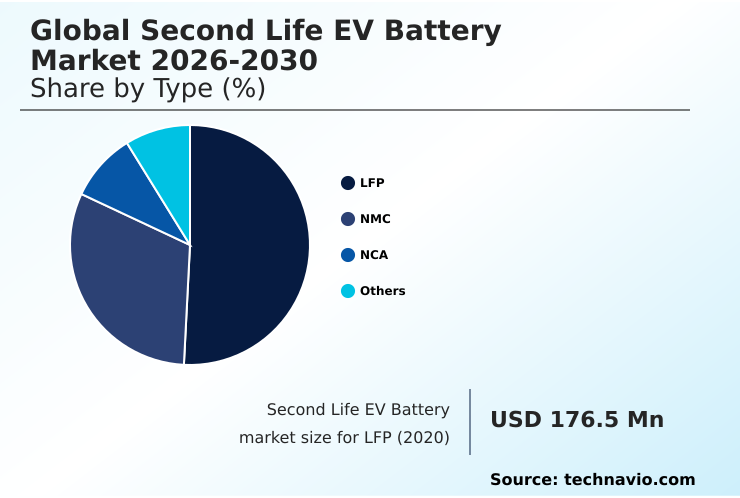
The LFP segment was valued at USD 413 million in 2024 and showed a gradual increase during the forecast period.

Get Free Sample

Regional Analysis

APAC is estimated to contribute 60.2% to the growth of the global market during the forecast period.Technavio’s analysts have elaborately explained the regional trends and drivers that shape the market during the forecast period.

See How Second Life EV Battery Market Demand is Rising in APAC Get Free Sample

The geographic landscape is dominated by the APAC region, which accounts for over 60% of the market's incremental growth, driven by its massive supply of retired batteries.

In this region, advanced battery degradation modeling improves the accuracy of residual value calculation for stationary energy storage assets. A key enabler is the development of a closed-loop supply chain supported by government-led second-life battery certification programs.

These initiatives, which include rigorous state of safety assessment protocols, have accelerated the deployment of microgrid power solutions. In North America and Europe, the focus is on professionalizing battery module assembly and battery pack disassembly processes.

Here, sophisticated analysis of battery state of health has led to a 25% improvement in sorting efficiency, enhancing the profitability of energy arbitrage and supporting the growth of battery swapping technology.

Market Dynamics

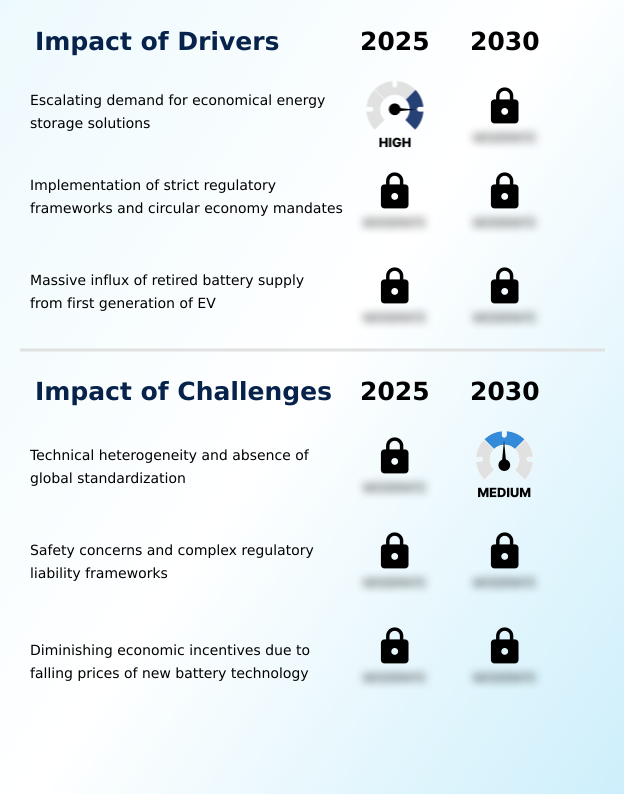
Our researchers analyzed the data with 2025 as the base year, along with the key drivers, trends, and challenges. A holistic analysis of drivers will help companies refine their marketing strategies to gain a competitive advantage.

  • The long-term viability of the global second life EV battery market 2026-2030 hinges on addressing several complex factors. The impact of battery chemistry on second life value is a primary consideration, as is the overall cost of second life EV battery systems compared to new alternatives.
  • Stakeholders must navigate evolving safety standards for repurposed EV batteries to build trust, particularly for the second life EV battery for residential use segment. A direct comparison of second life EV battery vs new battery performance reveals nuanced trade-offs in longevity and energy density.
  • Success requires innovative business models for second life EV batteries, which must account for the crucial role of BMS in second life battery safety. For example, the LFP battery second life cycle performance is often more predictable than other chemistries.
  • A core operational challenge is diagnosing state of health in used EV batteries, a process complicated by inconsistent regulatory frameworks for second life batteries. Integrating second life batteries with solar PV is a major opportunity, but challenges in EV battery refurbishment process remain. Proper end-of-life management for EV battery packs is essential for demonstrating the economic viability of battery repurposing.
  • Furthermore, developing effective thermal management for second life storage is critical, especially for second life battery applications in telecom. The rise of containerized storage solutions using EV batteries simplifies deployment, but the underlying supply chain logistics for used EV batteries are complex.
  • Using AI and machine learning in battery grading, supported by blockchain for EV battery traceability, offers a path forward. Implementing a digital traceability system reduces asset verification time by more than 50% compared to traditional manual inspection protocols, streamlining supply chain operations.

What are the key market drivers leading to the rise in the adoption of Second Life EV Battery Industry?

  • The escalating demand for economical energy storage solutions serves as a key driver for the second life EV battery market.

  • The primary driver is the compelling economic case for repurposed assets within the framework of circular economy principles. Utility-scale battery storage projects leveraging second-life units report capital cost reductions of up to 35% compared to new installations.
  • This cost advantage is critical for applications like peak shaving and providing ancillary grid services, where financial viability is paramount.
  • Concurrently, government mandates and incentives, including feed-in tariffs, are compelling stakeholders to optimize the entire battery value chain through improved EV battery traceability and lifecycle assessment.
  • Advanced lithium-ion battery diagnostics and efficient thermal management systems enable a 20% increase in the operational lifespan for behind-the-meter storage, enhancing their role in voltage support. Remanufacturing process optimization further solidifies the financial appeal of these assets.

What are the market trends shaping the Second Life EV Battery Industry?

  • An emerging market trend is the proliferation of artificial intelligence and blockchain technologies, which are being leveraged to enhance transparency throughout the battery lifecycle.

  • The market is witnessing a transformative shift toward advanced digital technologies and modular designs. The adoption of a digital battery passport, for instance, has improved asset traceability for extended producer responsibility mandates, reducing verification overhead by up to 60%.
  • Similarly, AI-driven state of charge estimation within advanced battery management systems now allows for a 15% improvement in optimizing nickel manganese cobalt cells for renewable energy buffering. This trend is complemented by the move toward modular energy storage and containerized energy storage solutions.
  • These plug-and-play stationary storage systems enable rapid deployment for decentralized energy networks, cutting installation time by 40% and offering scalable energy storage as a service for grid stabilization and grid frequency regulation.

What challenges does the Second Life EV Battery Industry face during its growth?

  • The technical heterogeneity of battery designs, coupled with the absence of global standardization, presents a key challenge to the market's growth.

  • A significant market challenge is the lack of standardization across battery designs, including nickel cobalt aluminum packs utilizing diverse pouch cells and cylindrical cells. This heterogeneity increases refurbishment complexity, elevating operational costs by an estimated 30% and complicating automotive OEM partnerships.
  • The proprietary nature of cell balancing algorithms and the data from electrochemical impedance spectroscopy tests are often inaccessible, creating barriers to effective repurposing. Moreover, the threat of thermal runaway necessitates rigorous, costly testing, impacting the viability of energy arbitrage strategies.
  • As the price of new batteries declines, the economic incentive for repurposing diminishes, with new units sometimes offering a 15% better price-to-performance ratio for applications like capacity firming services. This dynamic pressures the industry to innovate in areas beyond material recovery to maintain a competitive edge.

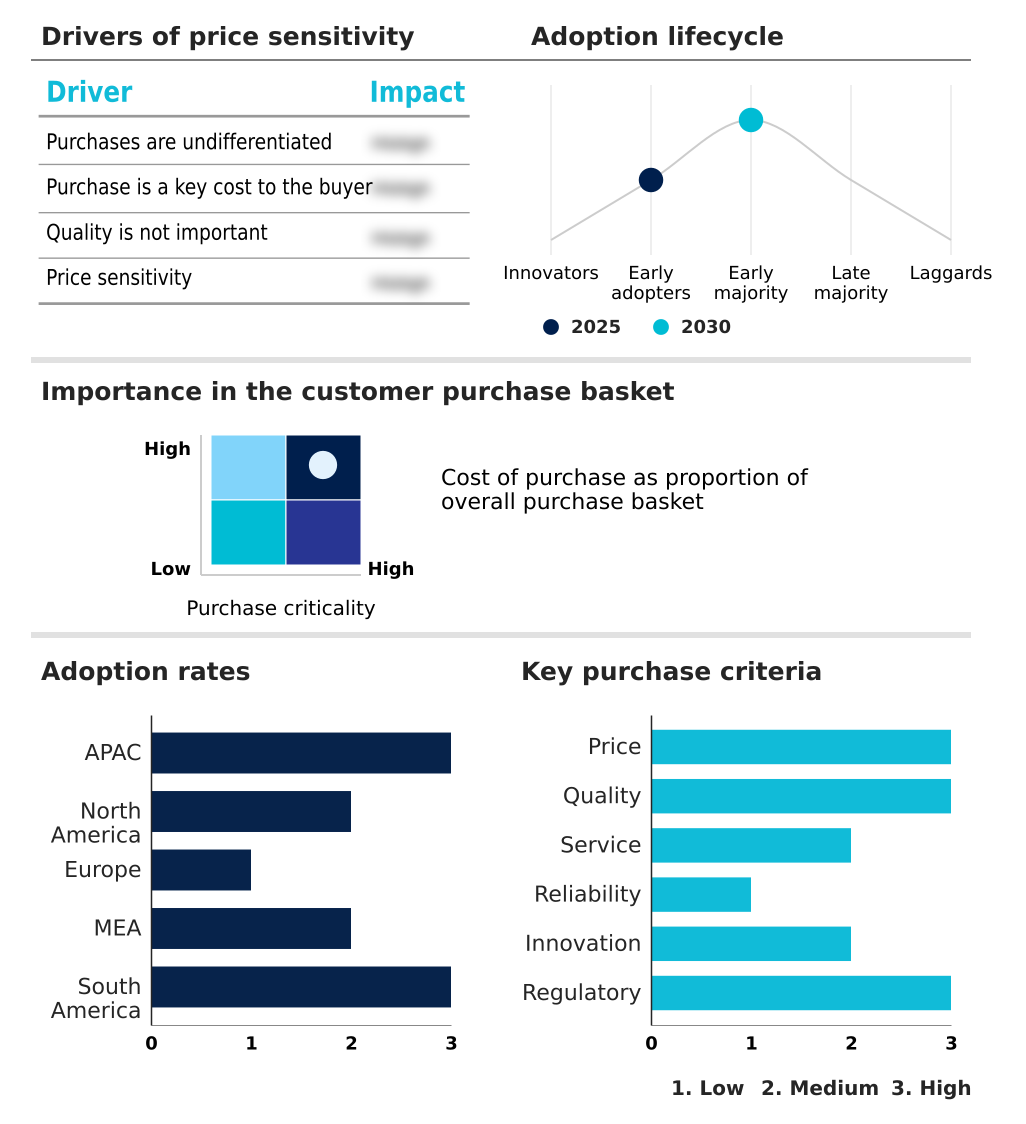
Exclusive Technavio Analysis on Customer Landscape

The second life ev battery market forecasting report includes the adoption lifecycle of the market, covering from the innovator’s stage to the laggard’s stage. It focuses on adoption rates in different regions based on penetration. Furthermore, the second life ev battery market report also includes key purchase criteria and drivers of price sensitivity to help companies evaluate and develop their market growth analysis strategies.

Customer Landscape of Second Life EV Battery Industry

Competitive Landscape

Companies are implementing various strategies, such as strategic alliances, second life ev battery market forecast, partnerships, mergers and acquisitions, geographical expansion, and product/service launches, to enhance their presence in the industry.

AB Volvo - Repurposed electric vehicle battery packs are integrated into utility-scale energy storage systems, supporting grid and commercial solar-plus-storage projects for enhanced stability and reliability.

The industry research and growth report includes detailed analyses of the competitive landscape of the market and information about key companies, including:

  • AB Volvo
  • B2U Storage Inc.
  • BeePlanet Factory
  • Circunomics GmbH
  • Connected Energy Ltd
  • ECO STOR GmbH
  • Enel X Italia S.r.l.
  • Envision Group
  • Kempower Oyj
  • Lohum Cleantech Pvt. Ltd.
  • Micropower Group
  • Moment Energy
  • Octillion Power Systems
  • Powervault Ltd
  • Relectrify Pty Ltd
  • Rivian Automotive Inc.
  • RWE AG
  • Tesla Inc.
  • Valmet Automotive Group
  • Zenobe Energy Limited

Qualitative and quantitative analysis of companies has been conducted to help clients understand the wider business environment as well as the strengths and weaknesses of key industry players. Data is qualitatively analyzed to categorize companies as pure play, category-focused, industry-focused, and diversified; it is quantitatively analyzed to categorize companies as dominant, leading, strong, tentative, and weak.

Recent Development and News in Second life ev battery market

  • In June 2025, Enel X S.r.l. launched a ten-megawatt-hour battery energy storage system in Italy, exclusively utilizing second-life batteries sourced from decommissioned electric vehicle fleets.
  • In September 2025, Moon Power, a subsidiary of Porsche, introduced RE:LIFE, a modular storage system designed to use second-life electric vehicle batteries from standardized platforms for solar energy storage.
  • In May 2025, Battery X Metals Inc. completed the installation of a modular energy storage system for a large-scale industrial processing plant in North America using refurbished lithium-iron phosphate cells.
  • In June 2025, Stellantis N.V. announced its formal participation in the PIONEER project, which is focused on deploying second-life batteries to support advanced mobility infrastructure and microgrids.

Dive into Technavio’s robust research methodology, blending expert interviews, extensive data synthesis, and validated models for unparalleled Second Life EV Battery Market insights. See full methodology.

Market Scope
Page number 308
Base year 2025
Historic period 2020-2024
Forecast period 2026-2030
Growth momentum & CAGR Accelerate at a CAGR of 24.7%
Market growth 2026-2030 USD 1934.3 million
Market structure Fragmented
YoY growth 2025-2026(%) 23.6%
Key countries China, Japan, South Korea, India, Australia, Indonesia, US, Canada, Mexico, Germany, France, UK, Italy, Spain, The Netherlands, Saudi Arabia, UAE, South Africa, Israel, Turkey, Brazil, Argentina and Colombia
Competitive landscape Leading Companies, Market Positioning of Companies, Competitive Strategies, and Industry Risks

Request Free Sample

Research Analyst Overview

  • The second life EV battery market's evolution is defined by the transition of assets from automotive use to roles in stationary energy storage. A critical trend influencing boardroom strategy is the adoption of the digital battery passport, a technology that directly addresses compliance with emerging end-of-life vehicle directive regulations and provides transparent data for asset valuation.
  • This detailed tracking of battery state of health, using techniques like electrochemical impedance spectroscopy, is essential for a functional closed-loop supply chain. Advanced diagnostics now achieve over 98% accuracy in assessing degradation, a significant improvement that solidifies the financial case for battery repurposing and battery remanufacturing.
  • This market balances various chemistries, from lithium iron phosphate to nickel manganese cobalt and nickel cobalt aluminum, each presenting unique characteristics for cell balancing and thermal management systems to prevent thermal runaway.
  • As the industry scales, standardization across prismatic cells, pouch cells, and cylindrical cells remains a goal to optimize battery module assembly and enable services like grid stabilization, peak shaving, and energy arbitrage, all underpinned by circular economy principles.

What are the Key Data Covered in this Second Life EV Battery Market Research and Growth Report?

  • What is the expected growth of the Second Life EV Battery Market between 2026 and 2030?

    • USD 1.93 billion, at a CAGR of 24.7%

  • What segmentation does the market report cover?

    • The report is segmented by Type (LFP, NMC, NCA, and Others), Application (Utilities and grid operators, Commercial and industrial users, Telecom and infrastructure, Residential users, and Others), Product (Repurpose, Refurbishment, and Reuse) and Geography (APAC, North America, Europe, Middle East and Africa, South America)

  • Which regions are analyzed in the report?

    • APAC, North America, Europe, Middle East and Africa and South America

  • What are the key growth drivers and market challenges?

    • Escalating demand for economical energy storage solutions, Technical heterogeneity and absence of global standardization

  • Who are the major players in the Second Life EV Battery Market?

    • AB Volvo, B2U Storage Inc., BeePlanet Factory, Circunomics GmbH, Connected Energy Ltd, ECO STOR GmbH, Enel X Italia S.r.l., Envision Group, Kempower Oyj, Lohum Cleantech Pvt. Ltd., Micropower Group, Moment Energy, Octillion Power Systems, Powervault Ltd, Relectrify Pty Ltd, Rivian Automotive Inc., RWE AG, Tesla Inc., Valmet Automotive Group and Zenobe Energy Limited

Market Research Insights

  • Market dynamics are increasingly shaped by strategic automotive OEM partnerships and the push for a comprehensive battery value chain. The adoption of advanced repurposed battery diagnostics has enabled a 40% reduction in testing and grading time, significantly improving throughput for refurbishment centers. This efficiency gain enhances the financial viability of second life battery applications.
  • Furthermore, commercial and industrial users leveraging these systems for behind-the-meter storage are reporting an average reduction of 25% in peak electricity demand charges. As regulations around extended producer responsibility become stricter, a focus on the entire lifecycle assessment is compelling organizations to seek sustainable end-of-life battery management solutions, making repurposed assets a central component of modern energy strategies.

We can help! Our analysts can customize this second life ev battery market research report to meet your requirements.

Get in touch

1. Executive Summary

1.1 Market overview

Executive Summary - Chart on Market Overview
Executive Summary - Data Table on Market Overview
Executive Summary - Chart on Global Market Characteristics
Executive Summary - Chart on Market by Geography
Executive Summary - Chart on Market Segmentation by Type
Executive Summary - Chart on Market Segmentation by Application
Executive Summary - Chart on Market Segmentation by Product
Executive Summary - Chart on Incremental Growth
Executive Summary - Data Table on Incremental Growth
Executive Summary - Chart on Company Market Positioning

2. Technavio Analysis

2.1 Analysis of price sensitivity, lifecycle, customer purchase basket, adoption rates, and purchase criteria

2.2 Criticality of inputs and Factors of differentiation

Chart on Overview on criticality of inputs and factors of differentiation

2.3 Factors of disruption

Chart on Overview on factors of disruption

2.4 Impact of drivers and challenges

Chart on Impact of drivers and challenges in 2025 and 2030

3. Market Landscape

3.1 Market ecosystem

Chart on Parent Market
Data Table on - Parent Market

3.2 Market characteristics

Chart on Market characteristics analysis

3.3 Value chain analysis

Chart on Value chain analysis

4. Market Sizing

4.1 Market definition

Data Table on Offerings of companies included in the market definition

4.2 Market segment analysis

Market segments

4.3 Market size 2025

4.4 Market outlook: Forecast for 2025-2030

Chart on Global - Market size and forecast 2025-2030 ($ million)
Data Table on Global - Market size and forecast 2025-2030 ($ million)
Chart on Global Market: Year-over-year growth 2025-2030 (%)
Data Table on Global Market: Year-over-year growth 2025-2030 (%)

5. Historic Market Size

5.1 Global Second Life EV Battery Market 2020 - 2024

Historic Market Size - Data Table on Global Second Life EV Battery Market 2020 - 2024 ($ million)

5.2 Type segment analysis 2020 - 2024

Historic Market Size - Type Segment 2020 - 2024 ($ million)

5.3 Application segment analysis 2020 - 2024

Historic Market Size - Application Segment 2020 - 2024 ($ million)

5.4 Product segment analysis 2020 - 2024

Historic Market Size - Product Segment 2020 - 2024 ($ million)

5.5 Geography segment analysis 2020 - 2024

Historic Market Size - Geography Segment 2020 - 2024 ($ million)

5.6 Country segment analysis 2020 - 2024

Historic Market Size - Country Segment 2020 - 2024 ($ million)

6. Qualitative Analysis

6.1 Impact of AI on Global Second Life EV Battery Market

6.2 Impact of geopolitical conflicts on Global Second Life EV Battery Market

7. Five Forces Analysis

7.1 Five forces summary

Five forces analysis - Comparison between 2025 and 2030

7.2 Bargaining power of buyers

Bargaining power of buyers - Impact of key factors 2025 and 2030

7.3 Bargaining power of suppliers

Bargaining power of suppliers - Impact of key factors in 2025 and 2030

7.4 Threat of new entrants

Threat of new entrants - Impact of key factors in 2025 and 2030

7.5 Threat of substitutes

Threat of substitutes - Impact of key factors in 2025 and 2030

7.6 Threat of rivalry

Threat of rivalry - Impact of key factors in 2025 and 2030

7.7 Market condition

Chart on Market condition - Five forces 2025 and 2030

8. Market Segmentation by Type

8.1 Market segments

Chart on Type - Market share 2025-2030 (%)
Data Table on Type - Market share 2025-2030 (%)

8.2 Comparison by Type

Chart on Comparison by Type
Data Table on Comparison by Type

8.3 LFP - Market size and forecast 2025-2030

Chart on LFP - Market size and forecast 2025-2030 ($ million)
Data Table on LFP - Market size and forecast 2025-2030 ($ million)
Chart on LFP - Year-over-year growth 2025-2030 (%)
Data Table on LFP - Year-over-year growth 2025-2030 (%)

8.4 NMC - Market size and forecast 2025-2030

Chart on NMC - Market size and forecast 2025-2030 ($ million)
Data Table on NMC - Market size and forecast 2025-2030 ($ million)
Chart on NMC - Year-over-year growth 2025-2030 (%)
Data Table on NMC - Year-over-year growth 2025-2030 (%)

8.5 NCA - Market size and forecast 2025-2030

Chart on NCA - Market size and forecast 2025-2030 ($ million)
Data Table on NCA - Market size and forecast 2025-2030 ($ million)
Chart on NCA - Year-over-year growth 2025-2030 (%)
Data Table on NCA - Year-over-year growth 2025-2030 (%)

8.6 Others - Market size and forecast 2025-2030

Chart on Others - Market size and forecast 2025-2030 ($ million)
Data Table on Others - Market size and forecast 2025-2030 ($ million)
Chart on Others - Year-over-year growth 2025-2030 (%)
Data Table on Others - Year-over-year growth 2025-2030 (%)

8.7 Market opportunity by Type

Market opportunity by Type ($ million)
Data Table on Market opportunity by Type ($ million)

9. Market Segmentation by Application

9.1 Market segments

Chart on Application - Market share 2025-2030 (%)
Data Table on Application - Market share 2025-2030 (%)

9.2 Comparison by Application

Chart on Comparison by Application
Data Table on Comparison by Application

9.3 Utilities and grid operators - Market size and forecast 2025-2030

Chart on Utilities and grid operators - Market size and forecast 2025-2030 ($ million)
Data Table on Utilities and grid operators - Market size and forecast 2025-2030 ($ million)
Chart on Utilities and grid operators - Year-over-year growth 2025-2030 (%)
Data Table on Utilities and grid operators - Year-over-year growth 2025-2030 (%)

9.4 Commercial and industrial users - Market size and forecast 2025-2030

Chart on Commercial and industrial users - Market size and forecast 2025-2030 ($ million)
Data Table on Commercial and industrial users - Market size and forecast 2025-2030 ($ million)
Chart on Commercial and industrial users - Year-over-year growth 2025-2030 (%)
Data Table on Commercial and industrial users - Year-over-year growth 2025-2030 (%)

9.5 Telecom and infrastructure - Market size and forecast 2025-2030

Chart on Telecom and infrastructure - Market size and forecast 2025-2030 ($ million)
Data Table on Telecom and infrastructure - Market size and forecast 2025-2030 ($ million)
Chart on Telecom and infrastructure - Year-over-year growth 2025-2030 (%)
Data Table on Telecom and infrastructure - Year-over-year growth 2025-2030 (%)

9.6 Residential users - Market size and forecast 2025-2030

Chart on Residential users - Market size and forecast 2025-2030 ($ million)
Data Table on Residential users - Market size and forecast 2025-2030 ($ million)
Chart on Residential users - Year-over-year growth 2025-2030 (%)
Data Table on Residential users - Year-over-year growth 2025-2030 (%)

9.7 Others - Market size and forecast 2025-2030

Chart on Others - Market size and forecast 2025-2030 ($ million)
Data Table on Others - Market size and forecast 2025-2030 ($ million)
Chart on Others - Year-over-year growth 2025-2030 (%)
Data Table on Others - Year-over-year growth 2025-2030 (%)

9.8 Market opportunity by Application

Market opportunity by Application ($ million)
Data Table on Market opportunity by Application ($ million)

10. Market Segmentation by Product

10.1 Market segments

Chart on Product - Market share 2025-2030 (%)
Data Table on Product - Market share 2025-2030 (%)

10.2 Comparison by Product

Chart on Comparison by Product
Data Table on Comparison by Product

10.3 Repurpose - Market size and forecast 2025-2030

Chart on Repurpose - Market size and forecast 2025-2030 ($ million)
Data Table on Repurpose - Market size and forecast 2025-2030 ($ million)
Chart on Repurpose - Year-over-year growth 2025-2030 (%)
Data Table on Repurpose - Year-over-year growth 2025-2030 (%)

10.4 Refurbishment - Market size and forecast 2025-2030

Chart on Refurbishment - Market size and forecast 2025-2030 ($ million)
Data Table on Refurbishment - Market size and forecast 2025-2030 ($ million)
Chart on Refurbishment - Year-over-year growth 2025-2030 (%)
Data Table on Refurbishment - Year-over-year growth 2025-2030 (%)

10.5 Reuse - Market size and forecast 2025-2030

Chart on Reuse - Market size and forecast 2025-2030 ($ million)
Data Table on Reuse - Market size and forecast 2025-2030 ($ million)
Chart on Reuse - Year-over-year growth 2025-2030 (%)
Data Table on Reuse - Year-over-year growth 2025-2030 (%)

10.6 Market opportunity by Product

Market opportunity by Product ($ million)
Data Table on Market opportunity by Product ($ million)

11. Customer Landscape

11.1 Customer landscape overview

Analysis of price sensitivity, lifecycle, customer purchase basket, adoption rates, and purchase criteria

12. Geographic Landscape

12.1 Geographic segmentation

Chart on Market share by geography 2025-2030 (%)
Data Table on Market share by geography 2025-2030 (%)

12.2 Geographic comparison

Chart on Geographic comparison
Data Table on Geographic comparison

12.3 APAC - Market size and forecast 2025-2030

Chart on APAC - Market size and forecast 2025-2030 ($ million)
Data Table on APAC - Market size and forecast 2025-2030 ($ million)
Chart on APAC - Year-over-year growth 2025-2030 (%)
Data Table on APAC - Year-over-year growth 2025-2030 (%)
Chart on Regional Comparison - APAC
Data Table on Regional Comparison - APAC

12.3.1 China - Market size and forecast 2025-2030

Chart on China - Market size and forecast 2025-2030 ($ million)
Data Table on China - Market size and forecast 2025-2030 ($ million)
Chart on China - Year-over-year growth 2025-2030 (%)
Data Table on China - Year-over-year growth 2025-2030 (%)

12.3.2 Japan - Market size and forecast 2025-2030

Chart on Japan - Market size and forecast 2025-2030 ($ million)
Data Table on Japan - Market size and forecast 2025-2030 ($ million)
Chart on Japan - Year-over-year growth 2025-2030 (%)
Data Table on Japan - Year-over-year growth 2025-2030 (%)

12.3.3 South Korea - Market size and forecast 2025-2030

Chart on South Korea - Market size and forecast 2025-2030 ($ million)
Data Table on South Korea - Market size and forecast 2025-2030 ($ million)
Chart on South Korea - Year-over-year growth 2025-2030 (%)
Data Table on South Korea - Year-over-year growth 2025-2030 (%)

12.3.4 India - Market size and forecast 2025-2030

Chart on India - Market size and forecast 2025-2030 ($ million)
Data Table on India - Market size and forecast 2025-2030 ($ million)
Chart on India - Year-over-year growth 2025-2030 (%)
Data Table on India - Year-over-year growth 2025-2030 (%)

12.3.5 Australia - Market size and forecast 2025-2030

Chart on Australia - Market size and forecast 2025-2030 ($ million)
Data Table on Australia - Market size and forecast 2025-2030 ($ million)
Chart on Australia - Year-over-year growth 2025-2030 (%)
Data Table on Australia - Year-over-year growth 2025-2030 (%)

12.3.6 Indonesia - Market size and forecast 2025-2030

Chart on Indonesia - Market size and forecast 2025-2030 ($ million)
Data Table on Indonesia - Market size and forecast 2025-2030 ($ million)
Chart on Indonesia - Year-over-year growth 2025-2030 (%)
Data Table on Indonesia - Year-over-year growth 2025-2030 (%)

12.4 North America - Market size and forecast 2025-2030

Chart on North America - Market size and forecast 2025-2030 ($ million)
Data Table on North America - Market size and forecast 2025-2030 ($ million)
Chart on North America - Year-over-year growth 2025-2030 (%)
Data Table on North America - Year-over-year growth 2025-2030 (%)
Chart on Regional Comparison - North America
Data Table on Regional Comparison - North America

12.4.1 US - Market size and forecast 2025-2030

Chart on US - Market size and forecast 2025-2030 ($ million)
Data Table on US - Market size and forecast 2025-2030 ($ million)
Chart on US - Year-over-year growth 2025-2030 (%)
Data Table on US - Year-over-year growth 2025-2030 (%)

12.4.2 Canada - Market size and forecast 2025-2030

Chart on Canada - Market size and forecast 2025-2030 ($ million)
Data Table on Canada - Market size and forecast 2025-2030 ($ million)
Chart on Canada - Year-over-year growth 2025-2030 (%)
Data Table on Canada - Year-over-year growth 2025-2030 (%)

12.4.3 Mexico - Market size and forecast 2025-2030

Chart on Mexico - Market size and forecast 2025-2030 ($ million)
Data Table on Mexico - Market size and forecast 2025-2030 ($ million)
Chart on Mexico - Year-over-year growth 2025-2030 (%)
Data Table on Mexico - Year-over-year growth 2025-2030 (%)

12.5 Europe - Market size and forecast 2025-2030

Chart on Europe - Market size and forecast 2025-2030 ($ million)
Data Table on Europe - Market size and forecast 2025-2030 ($ million)
Chart on Europe - Year-over-year growth 2025-2030 (%)
Data Table on Europe - Year-over-year growth 2025-2030 (%)
Chart on Regional Comparison - Europe
Data Table on Regional Comparison - Europe

12.5.1 Germany - Market size and forecast 2025-2030

Chart on Germany - Market size and forecast 2025-2030 ($ million)
Data Table on Germany - Market size and forecast 2025-2030 ($ million)
Chart on Germany - Year-over-year growth 2025-2030 (%)
Data Table on Germany - Year-over-year growth 2025-2030 (%)

12.5.2 France - Market size and forecast 2025-2030

Chart on France - Market size and forecast 2025-2030 ($ million)
Data Table on France - Market size and forecast 2025-2030 ($ million)
Chart on France - Year-over-year growth 2025-2030 (%)
Data Table on France - Year-over-year growth 2025-2030 (%)

12.5.3 UK - Market size and forecast 2025-2030

Chart on UK - Market size and forecast 2025-2030 ($ million)
Data Table on UK - Market size and forecast 2025-2030 ($ million)
Chart on UK - Year-over-year growth 2025-2030 (%)
Data Table on UK - Year-over-year growth 2025-2030 (%)

12.5.4 Italy - Market size and forecast 2025-2030

Chart on Italy - Market size and forecast 2025-2030 ($ million)
Data Table on Italy - Market size and forecast 2025-2030 ($ million)
Chart on Italy - Year-over-year growth 2025-2030 (%)
Data Table on Italy - Year-over-year growth 2025-2030 (%)

12.5.5 Spain - Market size and forecast 2025-2030

Chart on Spain - Market size and forecast 2025-2030 ($ million)
Data Table on Spain - Market size and forecast 2025-2030 ($ million)
Chart on Spain - Year-over-year growth 2025-2030 (%)
Data Table on Spain - Year-over-year growth 2025-2030 (%)

12.5.6 The Netherlands - Market size and forecast 2025-2030

Chart on The Netherlands - Market size and forecast 2025-2030 ($ million)
Data Table on The Netherlands - Market size and forecast 2025-2030 ($ million)
Chart on The Netherlands - Year-over-year growth 2025-2030 (%)
Data Table on The Netherlands - Year-over-year growth 2025-2030 (%)

12.6 Middle East and Africa - Market size and forecast 2025-2030

Chart on Middle East and Africa - Market size and forecast 2025-2030 ($ million)
Data Table on Middle East and Africa - Market size and forecast 2025-2030 ($ million)
Chart on Middle East and Africa - Year-over-year growth 2025-2030 (%)
Data Table on Middle East and Africa - Year-over-year growth 2025-2030 (%)
Chart on Regional Comparison - Middle East and Africa
Data Table on Regional Comparison - Middle East and Africa

12.6.1 Saudi Arabia - Market size and forecast 2025-2030

Chart on Saudi Arabia - Market size and forecast 2025-2030 ($ million)
Data Table on Saudi Arabia - Market size and forecast 2025-2030 ($ million)
Chart on Saudi Arabia - Year-over-year growth 2025-2030 (%)
Data Table on Saudi Arabia - Year-over-year growth 2025-2030 (%)

12.6.2 UAE - Market size and forecast 2025-2030

Chart on UAE - Market size and forecast 2025-2030 ($ million)
Data Table on UAE - Market size and forecast 2025-2030 ($ million)
Chart on UAE - Year-over-year growth 2025-2030 (%)
Data Table on UAE - Year-over-year growth 2025-2030 (%)

12.6.3 South Africa - Market size and forecast 2025-2030

Chart on South Africa - Market size and forecast 2025-2030 ($ million)
Data Table on South Africa - Market size and forecast 2025-2030 ($ million)
Chart on South Africa - Year-over-year growth 2025-2030 (%)
Data Table on South Africa - Year-over-year growth 2025-2030 (%)

12.6.4 Israel - Market size and forecast 2025-2030

Chart on Israel - Market size and forecast 2025-2030 ($ million)
Data Table on Israel - Market size and forecast 2025-2030 ($ million)
Chart on Israel - Year-over-year growth 2025-2030 (%)
Data Table on Israel - Year-over-year growth 2025-2030 (%)

12.6.5 Turkey - Market size and forecast 2025-2030

Chart on Turkey - Market size and forecast 2025-2030 ($ million)
Data Table on Turkey - Market size and forecast 2025-2030 ($ million)
Chart on Turkey - Year-over-year growth 2025-2030 (%)
Data Table on Turkey - Year-over-year growth 2025-2030 (%)

12.7 South America - Market size and forecast 2025-2030

Chart on South America - Market size and forecast 2025-2030 ($ million)
Data Table on South America - Market size and forecast 2025-2030 ($ million)
Chart on South America - Year-over-year growth 2025-2030 (%)
Data Table on South America - Year-over-year growth 2025-2030 (%)
Chart on Regional Comparison - South America
Data Table on Regional Comparison - South America

12.7.1 Brazil - Market size and forecast 2025-2030

Chart on Brazil - Market size and forecast 2025-2030 ($ million)
Data Table on Brazil - Market size and forecast 2025-2030 ($ million)
Chart on Brazil - Year-over-year growth 2025-2030 (%)
Data Table on Brazil - Year-over-year growth 2025-2030 (%)

12.7.2 Argentina - Market size and forecast 2025-2030

Chart on Argentina - Market size and forecast 2025-2030 ($ million)
Data Table on Argentina - Market size and forecast 2025-2030 ($ million)
Chart on Argentina - Year-over-year growth 2025-2030 (%)
Data Table on Argentina - Year-over-year growth 2025-2030 (%)

12.7.3 Colombia - Market size and forecast 2025-2030

Chart on Colombia - Market size and forecast 2025-2030 ($ million)
Data Table on Colombia - Market size and forecast 2025-2030 ($ million)
Chart on Colombia - Year-over-year growth 2025-2030 (%)
Data Table on Colombia - Year-over-year growth 2025-2030 (%)

12.8 Market opportunity by geography

Market opportunity by geography ($ million)
Data Tables on Market opportunity by geography ($ million)

13. Drivers, Challenges, and Opportunity

13.1 Market drivers

Escalating demand for economical energy storage solutions
Implementation of strict regulatory frameworks and circular economy mandates
Massive influx of retired battery supply from first generation of EV

13.2 Market challenges

Technical heterogeneity and absence of global standardization
Safety concerns and complex regulatory liability frameworks
Diminishing economic incentives due to falling prices of new battery technology

13.3 Impact of drivers and challenges

Impact of drivers and challenges in 2025 and 2030

13.4 Market opportunities

Proliferation of AI and blockchain for enhanced battery lifecycle transparency
Standardization of modular and containerized energy storage architectures
Strategic expansion of original equipment manufacturer and utility partnerships

14. Competitive Landscape

14.1 Overview

14.2

Overview on criticality of inputs and factors of differentiation

14.3 Landscape disruption

Overview on factors of disruption

14.4 Industry risks

Impact of key risks on business

15. Competitive Analysis

15.1 Companies profiled

Companies covered

15.2 Company ranking index

15.3 Market positioning of companies

Matrix on companies position and classification

15.4 AB Volvo

AB Volvo - Overview
AB Volvo - Business segments
AB Volvo - Key news
AB Volvo - Key offerings
AB Volvo - Segment focus
SWOT

15.5 B2U Storage Inc.

B2U Storage Inc. - Overview
B2U Storage Inc. - Product / Service
B2U Storage Inc. - Key offerings
SWOT

15.6 BeePlanet Factory

BeePlanet Factory - Overview
BeePlanet Factory - Product / Service
BeePlanet Factory - Key offerings
SWOT

15.7 Circunomics GmbH

Circunomics GmbH - Overview
Circunomics GmbH - Product / Service
Circunomics GmbH - Key offerings
SWOT

15.8 Connected Energy Ltd

Connected Energy Ltd - Overview
Connected Energy Ltd - Product / Service
Connected Energy Ltd - Key offerings
SWOT

15.9 Enel X Italia S.r.l.

Enel X Italia S.r.l. - Overview
Enel X Italia S.r.l. - Product / Service
Enel X Italia S.r.l. - Key offerings
SWOT

15.10 Envision Group

Envision Group - Overview
Envision Group - Product / Service
Envision Group - Key offerings
SWOT

15.11 Kempower Oyj

Kempower Oyj - Overview
Kempower Oyj - Product / Service
Kempower Oyj - Key offerings
SWOT

15.12 Lohum Cleantech Pvt. Ltd.

Lohum Cleantech Pvt. Ltd. - Overview
Lohum Cleantech Pvt. Ltd. - Product / Service
Lohum Cleantech Pvt. Ltd. - Key offerings
SWOT

15.13 Micropower Group

Micropower Group - Overview
Micropower Group - Product / Service
Micropower Group - Key offerings
SWOT

15.14 Moment Energy

Moment Energy - Overview
Moment Energy - Product / Service
Moment Energy - Key offerings
SWOT

15.15 Octillion Power Systems

Octillion Power Systems - Overview
Octillion Power Systems - Product / Service
Octillion Power Systems - Key offerings
SWOT

15.16 Powervault Ltd

Powervault Ltd - Overview
Powervault Ltd - Product / Service
Powervault Ltd - Key offerings
SWOT

15.17 Relectrify Pty Ltd

Relectrify Pty Ltd - Overview
Relectrify Pty Ltd - Product / Service
Relectrify Pty Ltd - Key offerings
SWOT

15.18 Tesla Inc.

Tesla Inc. - Overview
Tesla Inc. - Business segments
Tesla Inc. - Key offerings
Tesla Inc. - Segment focus
SWOT

16. Appendix

16.1 Scope of the report

Market definition
Objectives
Notes and caveats

16.2 Inclusions and exclusions checklist

Inclusions checklist
Exclusions checklist

16.3 Currency conversion rates for US$

16.4 Research methodology

16.5 Data procurement

Information sources

16.6 Data validation

16.7 Validation techniques employed for market sizing

16.8 Data synthesis

16.9 360 degree market analysis

16.10 List of abbreviations

Research Methodology

Technavio presents a detailed picture of the market by way of study, synthesis, and summation of data from multiple sources. The analysts have presented the various facets of the market with a particular focus on identifying the key industry influencers. The data thus presented is comprehensive, reliable, and the result of extensive research, both primary and secondary.

INFORMATION SOURCES

Primary sources

  • Manufacturers and suppliers
  • Channel partners
  • Industry experts
  • Strategic decision makers

Secondary sources

  • Industry journals and periodicals
  • Government data
  • Financial reports of key industry players
  • Historical data
  • Press releases

DATA ANALYSIS

Data Synthesis

  • Collation of data
  • Estimation of key figures
  • Analysis of derived insights

Data Validation

  • Triangulation with data models
  • Reference against proprietary databases
  • Corroboration with industry experts

REPORT WRITING

Qualitative

  • Market drivers
  • Market challenges
  • Market trends
  • Five forces analysis

Quantitative

  • Market size and forecast
  • Market segmentation
  • Geographical insights
  • Competitive landscape

Interested in this report?

Get your sample now to see our research methodology and insights!

Download Now

Frequently Asked Questions

Second Life EV Battery market growth will increase by USD 1934.3 million during 2026-2030.

The Second Life EV Battery market is expected to grow at a CAGR of 24.7% during 2026-2030.

Second Life EV Battery market is segmented by Type (LFP, NMC, NCA, Others) Application (Utilities and grid operators, Commercial and industrial users, Telecom and infrastructure, Residential users, Others) Product (Repurpose, Refurbishment, Reuse)

AB Volvo, B2U Storage Inc., BeePlanet Factory, Circunomics GmbH, Connected Energy Ltd, ECO STOR GmbH, Enel X Italia S.r.l., Envision Group, Kempower Oyj, Lohum Cleantech Pvt. Ltd., Micropower Group, Moment Energy, Octillion Power Systems, Powervault Ltd, Relectrify Pty Ltd, Rivian Automotive Inc., RWE AG, Tesla Inc., Valmet Automotive Group, Zenobe Energy Limited are a few of the key vendors in the Second Life EV Battery market.

APAC will register the highest growth rate of 60.2% among the other regions. Therefore, the Second Life EV Battery market in APAC is expected to garner significant business opportunities for the vendors during the forecast period.

China, Japan, South Korea, India, Australia, Indonesia, US, Canada, Mexico, Germany, France, UK, Italy, Spain, The Netherlands, Saudi Arabia, UAE, South Africa, Israel, Turkey, Brazil, Argentina, Colombia

  • Escalating demand for economical energy storage solutions is the driving factor this market.

The Second Life EV Battery market vendors should focus on grabbing business opportunities from the Type segment as it accounted for the largest market share in the base year.
RIA - Research AI Assistant
Ask RIA