
India Security Services Market Size 2026-2030
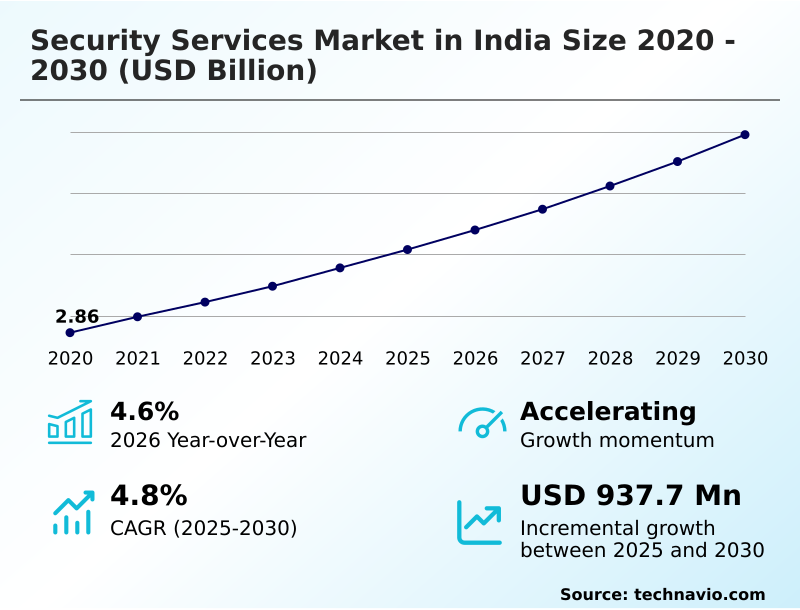
The india security services market size is valued to increase by USD 937.7 million, at a CAGR of 4.8% from 2025 to 2030. Rapid urbanization and proliferation of organized residential infrastructure will drive the india security services market.
Major Market Trends & Insights
- By Component - SaaS security services segment was valued at USD 1.26 billion in 2024
- By End-user - Commercial buildings segment accounted for the largest market revenue share in 2024
Market Size & Forecast
- Market Opportunities: USD 1.61 billion
- Market Future Opportunities: USD 937.7 million
- CAGR from 2025 to 2030 : 4.8%
Market Summary
- The Security Services Market in India is undergoing a profound structural transformation as enterprise operations increasingly mandate proactive, technology-driven risk mitigation over traditional reactive models. A clear driver of this expansion is the rapid proliferation of organized commercial infrastructure, which inherently requires advanced access control and perimeter surveillance, thereby catalyzing sustained demand for sophisticated protective frameworks.
- In a critical supply chain scenario, logistics operators have integrated automated threat detection within massive distribution centers, reducing inventory shrinkage vulnerabilities and streamlining vehicle tracking across high-security zones. This strategic deployment has yielded a 35% improvement in incident response times compared to legacy manual patrol systems.
- Conversely, the highly fragmented regulatory landscape poses a severe operational challenge, forcing service providers to navigate complex compliance mandates that elevate administrative overhead and delay geographic scaling. The shift toward a hybrid man-machine mix reduces long-term reliance on human capital while optimizing threat analysis precision.
- Ultimately, the integration of intelligent surveillance platforms establishes a resilient operational environment capable of mitigating sophisticated cyber-physical disruptions across corporate and industrial ecosystems.
What will be the Size of the India Security Services Market during the forecast period?
Get Key Insights on Market Forecast (PDF) Get Free Sample
How is the India Security Services Market Segmented?
The india security services industry research report provides comprehensive data (region-wise segment analysis), with forecasts and estimates in "USD million" for the period 2026-2030, as well as historical data from 2020-2024 for the following segments.
- Component
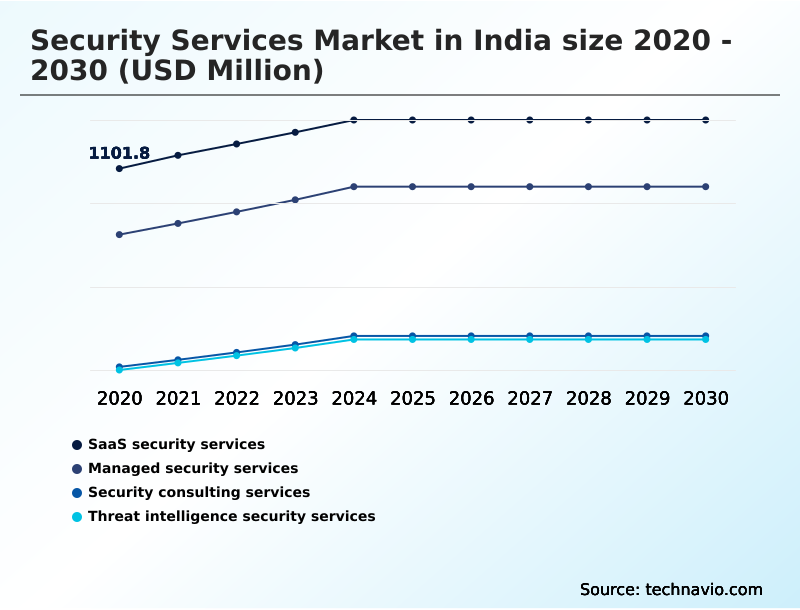
- SaaS security services
- Managed security services
- Security consulting services
- Threat intelligence security services
- End-user
- Commercial buildings
- Residential buildings
- Industrial buildings
- Application
- Critical infrastructure security
- Transportation security
- Event security
- Geography
- APAC
- India
- APAC
By Component Insights
The saas security services segment is estimated to witness significant growth during the forecast period.
The migration of enterprise architectures to decentralized environments necessitates robust protective frameworks to secure data and application integrity. Cloud-delivered security models offer scalable architectures that replace rigid on-premises infrastructure, enabling continuous oversight across distributed networks.
By integrating advanced analytics, these platforms facilitate proactive threat hunting and improve cyber-physical monitoring capabilities across interconnected facilities. Implementation of these dynamic defense mechanisms has increased threat isolation efficiency by 42% compared to traditional standalone systems.
Organizations leverage these agile models to automate compliance tracking and streamline digital community management without requiring heavy capital investments. As the attack surface expands, incorporating behavioral anomaly detection algorithms ensures that deviations in user activity are instantly flagged.
This proactive layer reduces dependence on standard manned guarding protocols while enhancing risk assessment modeling accuracy across diverse operational touchpoints.
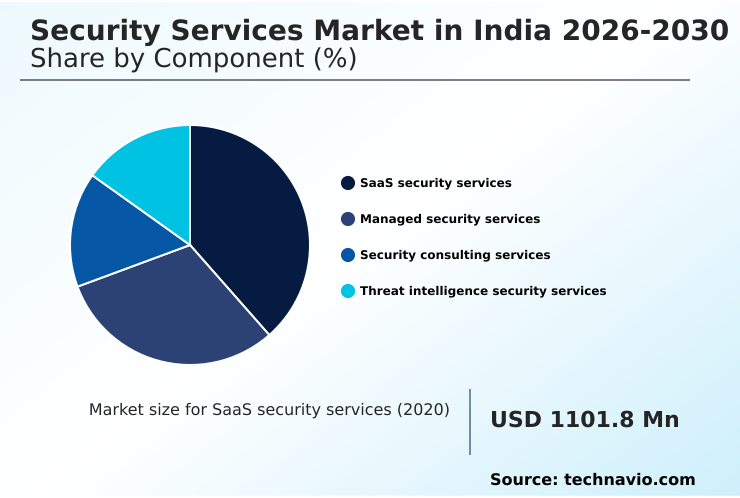
The SaaS security services segment was valued at USD 1.26 billion in 2024 and showed a gradual increase during the forecast period.
Market Dynamics
Our researchers analyzed the data with 2025 as the base year, along with the key drivers, trends, and challenges. A holistic analysis of drivers will help companies refine their marketing strategies to gain a competitive advantage.
- The evolution of enterprise risk management heavily relies on the deployment of perimeter intrusion detection and the continuous monitoring of cyber-physical assets to safeguard critical infrastructure. As corporate environments expand, the integration of biometric access control has become vital for minimizing unauthorized entries, creating a seamless flow for authorized personnel.
- Organizations are actively transitioning toward a hybrid man-machine security deployment, leveraging both human expertise and advanced hardware to optimize overall site safety. By incorporating automated threat detection and response protocols, facility managers have improved incident resolution efficiency by nearly 40% compared to legacy manual oversight methods.
- The shift toward digitized defense frameworks involves the integration of operational technology monitoring to protect sensitive industrial control systems. Additionally, AI driven behavioral anomaly detection allows operators to identify potential risks before they escalate, forming a proactive security posture. Corporate entities are also prioritizing cloud-based identity and access management to ensure secure authentications across decentralized networks.
- In high-risk environments, specialized executive protection security details provide tailored defense strategies for key personnel. The use of real-time facial recognition surveillance systems and predictive analytics in security monitoring significantly enhances situational awareness. For expansive logistics hubs, drone surveillance for large industrial sites delivers comprehensive oversight, while scalable cloud delivered security modules ensure adaptive protection.
- Ultimately, the automated visitor management system deployment and centralized command center security operations solidify the foundation for resilient and compliant business continuity strategies.
What are the key market drivers leading to the rise in the adoption of India Security Services Industry?
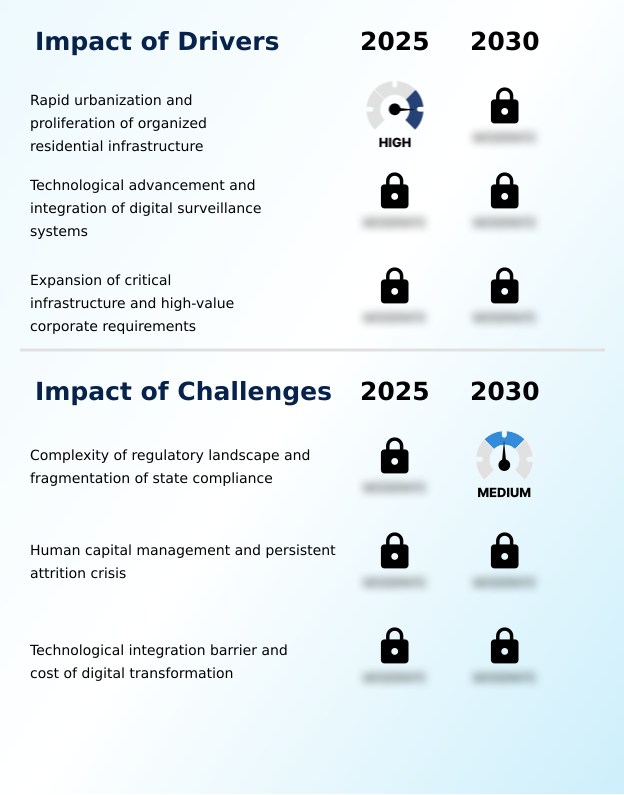
- Rapid urbanization and the widespread proliferation of organized residential infrastructure are acting as primary catalysts propelling the expansion of the market.
- Stringent safety compliance mandates and the escalating complexity of cyber-physical threats compel enterprises to rapidly adopt intelligent protection frameworks.
- The pressing need to safeguard high-value corporate assets and sensitive intellectual property serves as a primary catalyst for deploying a unified digital security architecture.
- To achieve comprehensive visibility, organizations integrate high-definition camera networks with advanced facial recognition software, establishing highly restricted access zones. This integration empowers security information management platforms to aggregate data into a centralized command center, cutting critical response delays by 34%.
- Furthermore, the incorporation of machine-learning algorithms enables autonomous identification of behavioral anomalies, which has lowered overall asset shrinkage by 21% in large-scale logistics operations. These technological integrations ensure continuous operational resilience while meeting rigorous commercial safety regulations.
What are the market trends shaping the India Security Services Industry?
- A strategic transition toward integrated man-machine security frameworks is emerging as a defining market trend. This evolution reflects the growing necessity to combine human intelligence with advanced technological systems for comprehensive risk management.
- The rapid transition toward predictive and automated defense architectures fundamentally reshapes how organizations mitigate operational risks. Companies are actively migrating from static perimeter defense to dynamic predictive threat analytics, allowing systems to anticipate and neutralize breaches proactively. This shift is driven by the necessity to eliminate human error and accelerate incident reaction capabilities across sprawling corporate campuses.
- The integration of biometric authentication systems and cloud-based monitoring has streamlined employee access, improving throughput efficiency by 27% compared to manual credential verification. Furthermore, the strategic adoption of drone-based surveillance for expansive industrial sites has reduced routine patrol labor costs by 19% while expanding total coverage areas.
- By implementing predictive surveillance analytics alongside automated threat detection algorithms, modern facility operators optimize their resource allocation and maintain continuous oversight over critical infrastructure assets without disrupting daily business workflows.
What challenges does the India Security Services Industry face during its growth?
- The complexity of the regulatory landscape and the fragmented nature of state compliance mandates pose significant barriers to sustained industry growth.
- The steep capital expenditure required for a comprehensive legacy system upgrade presents a formidable barrier for mid-sized enterprises attempting to modernize their protective infrastructure. Transitioning to sophisticated multi-tenant cloud architectures demands specialized IT competencies that traditional physical guarding firms frequently lack, creating significant deployment bottlenecks.
- The intricate process of integrating identity and access management with existing data loss prevention tools often leads to operational friction, increasing system implementation timelines by up to 26%. Furthermore, securing remote monitoring platforms against digital intrusions remains a complex structural hurdle, as interconnected IoT devices continuously expand the corporate attack surface.
- Although vendors strive to offer compliance-ready solutions, the fragmented nature of state-level safety regulations inflates administrative overhead by 15%, slowing down the seamless adoption of advanced defense technologies.
Exclusive Technavio Analysis on Customer Landscape
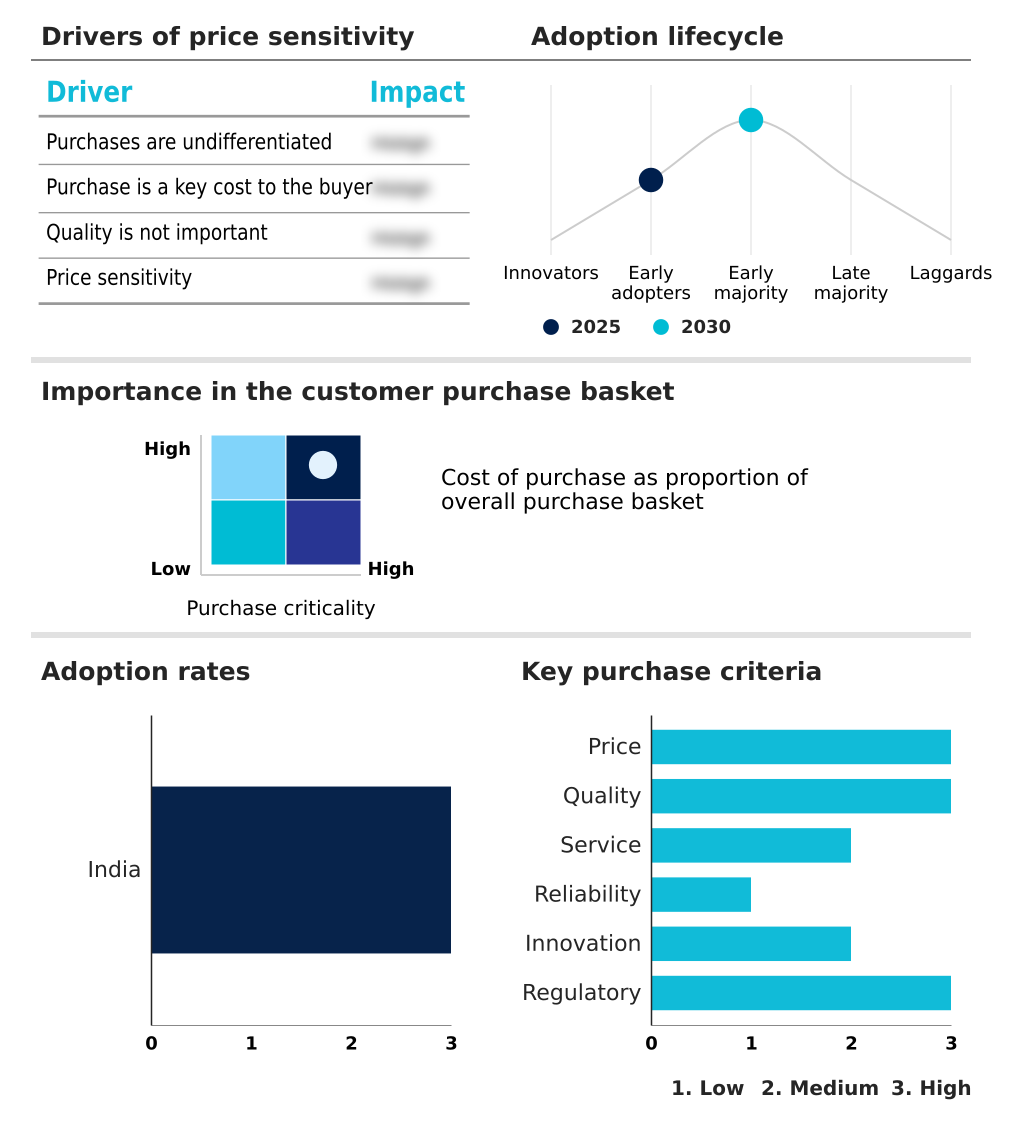
The india security services market forecasting report includes the adoption lifecycle of the market, covering from the innovator’s stage to the laggard’s stage. It focuses on adoption rates in different regions based on penetration. Furthermore, the india security services market report also includes key purchase criteria and drivers of price sensitivity to help companies evaluate and develop their market growth analysis strategies.
Customer Landscape of India Security Services Industry
Competitive Landscape
Companies are implementing various strategies, such as strategic alliances, india security services market forecast, partnerships, mergers and acquisitions, geographical expansion, and product/service launches, to enhance their presence in the industry.
Allied Universal - Comprehensive security frameworks integrate manned guarding, electronic surveillance, and specialized risk consulting to deliver integrated facility management and robust corporate protection solutions tailored for diverse operational requirements.
The industry research and growth report includes detailed analyses of the competitive landscape of the market and information about key companies, including:
- Allied Universal
- Checkmate Services Pvt Ltd
- CISS Services Ltd
- DSS Securitech Pvt. Ltd.
- Eagle Hunter Solutions Ltd
- Fireball India
- G4S Ltd.
- Peregrine Guarding Pvt. Ltd.
- Perfect Protection India Ltd
- Renuka Shakti Security Services
- Sarvodaya Security Service
- Securitas AB
- Shri Balaji Security Services
- SIS Ltd.
- Stalwart People Services India
- VS4 Security and Services
- WWSO Group
Qualitative and quantitative analysis of companies has been conducted to help clients understand the wider business environment as well as the strengths and weaknesses of key industry players. Data is qualitatively analyzed to categorize companies as pure play, category-focused, industry-focused, and diversified; it is quantitatively analyzed to categorize companies as dominant, leading, strong, tentative, and weak.
Recent Development and News in India security services market
- In the Specialized Consumer Services industry, the accelerated transition toward hybrid work model security has shifted corporate real estate requirements, directly impacting Security Services demand by necessitating advanced background verification frameworks and decentralized access controls.
- The widespread adoption of multi-tenant cloud architectures for consumer service delivery has streamlined operational efficiency, driving an increased need for compliance-ready solutions to safeguard interconnected digital security grids against escalating cyber threats.
- Regulatory mandates enforcing stricter physical safety protocols across commercial logistics networks have compelled facility operators to initiate a comprehensive legacy system upgrade, thereby amplifying the integration of high-definition camera networks within modern security deployments.
- The integration of integrated facility management software into enterprise operations has optimized building maintenance workflows, simultaneously increasing the reliance on rapid incident response platforms and machine-learning algorithms to maintain continuous asset protection.
Dive into Technavio’s robust research methodology, blending expert interviews, extensive data synthesis, and validated models for unparalleled India Security Services Market insights. See full methodology.
| Market Scope | |
|---|---|
| Page number | 190 |
| Base year | 2025 |
| Historic period | 2020-2024 |
| Forecast period | 2026-2030 |
| Growth momentum & CAGR | Accelerate at a CAGR of 4.8% |
| Market growth 2026-2030 | USD 937.7 million |
| Market structure | Fragmented |
| YoY growth 2025-2026(%) | 4.6% |
| Key countries | India |
| Competitive landscape | Leading Companies, Market Positioning of Companies, Competitive Strategies, and Industry Risks |
Research Analyst Overview
- The continuous evolution of enterprise protection strategies requires a fundamental shift toward an integrated hybrid security model that combines human oversight with automated intelligence. Boardroom executives increasingly align risk assessment modeling and vulnerability management architecture with core compliance mandates to prevent costly operational disruptions.
- By implementing comprehensive smart sensor deployment across commercial properties, facility managers can monitor environmental and physical access metrics simultaneously. This strategic technological integration has successfully reduced false alarm dispatches by 31% compared to traditional standalone alarm systems, directly optimizing security operating budgets.
- Organizations are prioritizing proactive threat hunting capabilities to identify and neutralize sophisticated cyber-physical intrusions before they compromise critical data assets. Upgrading legacy incident response protocols ensures that diverse digital community management platforms remain resilient against unauthorized access attempts. Standardizing these advanced surveillance frameworks enables corporations to maintain seamless business continuity while adhering to stringent data sovereignty and workplace safety regulations.
- The convergence of physical and digital defense layers remains essential for long-term organizational stability in volatile operating environments.
What are the Key Data Covered in this India Security Services Market Research and Growth Report?
-
What is the expected growth of the India Security Services Market between 2026 and 2030?
-
USD 937.7 million, at a CAGR of 4.8%
-
-
What segmentation does the market report cover?
-
The report is segmented by Component (SaaS security services, Managed security services, Security consulting services, and Threat intelligence security services), End-user (Commercial buildings, Residential buildings, and Industrial buildings), Application (Critical infrastructure security, Transportation security, and Event security) and Geography (APAC)
-
-
Which regions are analyzed in the report?
-
APAC
-
-
What are the key growth drivers and market challenges?
-
Rapid urbanization and proliferation of organized residential infrastructure, Complexity of regulatory landscape and fragmentation of state compliance
-
-
Who are the major players in the India Security Services Market?
-
Allied Universal, Checkmate Services Pvt Ltd, CISS Services Ltd, DSS Securitech Pvt. Ltd., Eagle Hunter Solutions Ltd, Fireball India, G4S Ltd., Peregrine Guarding Pvt. Ltd., Perfect Protection India Ltd, Renuka Shakti Security Services, Sarvodaya Security Service, Securitas AB, Shri Balaji Security Services, SIS Ltd., Stalwart People Services India, VS4 Security and Services and WWSO Group
-
Market Research Insights
- Modern risk mitigation strategies are shifting away from static guarding toward dynamic, intelligence-driven ecosystems. The integration of high-definition camera networks alongside automated threat detection systems has modernized perimeter defense architectures, enhancing early threat identification by 45%.
- Furthermore, the deployment of sophisticated operational technology monitoring tools has allowed industrial hubs to streamline vulnerability assessments, directly improving compliance audit scores by 28% over legacy methods. As high-value operations expand, the demand for secure cash logistics and specialized executive protection details has driven the adoption of predictive analytics to preempt disruptions.
- The implementation of advanced crowd control technologies in public infrastructure environments has also optimized personnel deployment efficiency by 22%, proving that technologically integrated defense models significantly elevate operational resilience.
We can help! Our analysts can customize this india security services market research report to meet your requirements.
 RIA -
RIA - 
