Seitan Market Analysis, Size, and Forecast 2024-2028: North America (Mexico), Europe (France, Germany, Italy, Spain, and UK), Middle East and Africa (UAE), APAC (Australia, China, India, Japan, and South Korea), South America (Brazil), and Rest of World (ROW)

Seitan Market Analysis, Size, and Forecast 2024-2028:
North America (Mexico), Europe (France, Germany, Italy, Spain, and UK), Middle East and Africa (UAE), APAC (Australia, China, India, Japan, and South Korea), South America (Brazil), and Rest of World (ROW)

Published: Jul 2024 140 Pages SKU: IRTNTR74046

Market Overview at a Glance

$63.8 Mn
Market Opportunity
3.27%
CAGR
3.12
YoY growth 2023-2024(%)

Seitan Market Size 2024-2028

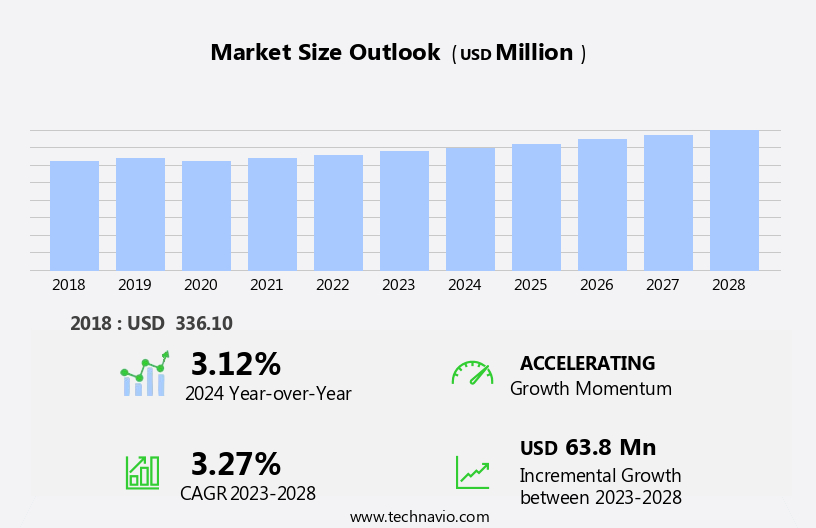
The seitan market size is forecast to increase by USD 63.8 million, at a CAGR of 3.27% between 2023 and 2028.

  • The market is experiencing significant growth, driven by the expanding vegan population and enhanced channels of distribution. The vegan demographic continues to expand, fueled by increasing consumer awareness and concern for animal welfare and health. Seitan, a versatile plant-based protein derived from wheat gluten, caters to the dietary needs and preferences of this demographic. However, the market faces challenges due to the adverse effects of highly processed food. Consumers are increasingly seeking natural, whole food alternatives, which could potentially limit the appeal of seitan, as it is a highly processed food.
  • Manufacturers must address these concerns by focusing on product innovation, such as developing more natural and minimally processed seitan options, to cater to the evolving consumer preferences and maintain market competitiveness.

What will be the Size of the Seitan Market during the forecast period?

Seitan Market Size

Explore in-depth regional segment analysis with market size data - historical 2018-2022 and forecasts 2024-2028 - in the full report.  
Request Free Sample

The market continues to evolve, driven by consumer demand for gluten-free alternatives and the ongoing research and development in the field. Gluten strength and textural characteristics are key considerations in the production process, with processing parameters such as seitan texture analysis, wheat protein isolate, and functional properties playing crucial roles. Manufacturers strive for optimal yield and cost efficiency, employing various techniques like vital wheat gluten, gluten washing, and emulsifying capacity to enhance product quality. Consumer acceptance of seitan and other gluten-free alternatives is on the rise, driven by increasing awareness of celiac disease and gluten intolerance. This trend has led to innovation in seitan culinary applications, with dough kneading methods and rheological properties being explored to create a more authentic texture and mouthfeel.

Storage conditions and shelf life extension are essential factors in ensuring product quality and safety. Food safety regulations and food processing technology are continuously evolving to address concerns around microbial contamination and gluten hydration capacity. The seitan production process is a dynamic and complex one, with ongoing research focusing on protein solubility, water absorption, and protein denaturation effects to optimize yield and improve nutritional composition. The amino acid profile and allergenic protein content of seitan are important considerations for manufacturers and consumers alike. Gluten elasticity and gluten hydrolysis are key factors in the production process, with sensory evaluation playing a critical role in ensuring product quality and consumer satisfaction.

The market is a continually unfolding landscape, with ongoing research and innovation driving new developments and applications across various sectors. From food manufacturing to culinary arts, the potential for seitan and other gluten-free alternatives is vast and evolving.

How is this Seitan Industry segmented?

The seitan industry research report provides comprehensive data (region-wise segment analysis), with forecasts and estimates in "USD million" for the period 2024-2028, as well as historical data from 2018-2022 for the following segments.

  • Product
    • Conventional seitan
    • Organic seitan
  • End-User
    • Vegan Consumers
    • Restaurants
    • Food Manufacturers
  • Distribution Channel
    • Supermarkets
    • Online Retail
    • Specialty Stores
  • Application
    • Meat Substitutes
    • Bakery Products
    • Processed Foods
  • Geography
    • North America
      • US
      • Mexico
    • Europe
      • France
      • Germany
      • Italy
      • Spain
      • UK
    • Middle East and Africa
      • UAE
    • APAC
      • Australia
      • China
      • India
      • Japan
      • South Korea
    • South America
      • Brazil
    • Rest of World (ROW)

By Product Insights

The conventional seitan segment is estimated to witness significant growth during the forecast period.

Seitan, a versatile and nutritious plant-based protein derived from wheat gluten, has gained significant attention in the global food industry due to its textural similarities to meat and its potential health benefits. The market for seitan continues to evolve, driven by increasing consumer acceptance of gluten-free alternatives and the functional properties of wheat protein isolate. Seitan's textural characteristics, achieved through various processing parameters, make it an excellent substitute for meat in various culinary applications. Manufacturers employ different methods to optimize yield and enhance the elasticity and protein solubility of seitan. Sensory evaluation plays a crucial role in ensuring product quality, while food safety regulations and processing technology help maintain product safety and extend shelf life.

Seitan's nutritional composition, rich in essential amino acids and low in saturated fats, caters to the dietary needs of various consumer segments. The production process involves gluten washing techniques, followed by kneading and hydration to achieve the desired texture. Packaging methods and storage conditions are essential to maintain the product's quality and extend its shelf life. Microbial contamination and protein denaturation effects are critical concerns in seitan production, necessitating stringent quality control measures. The conventional seitan segment dominates the market due to its widespread availability and consumer preference. Major manufacturers include Biolab, Upton's Naturals, and Primal Spirits. APAC is the largest producer and consumer of seitan, driven by its cultural acceptance and health consciousness.

Seitan's high protein content, low-fat profile, and health benefits make it an attractive alternative to meat for bodybuilders, athletes, and consumers seeking healthier food options. These factors are expected to fuel the market's growth during the forecast period.

Seitan Market Size

Request Free Sample

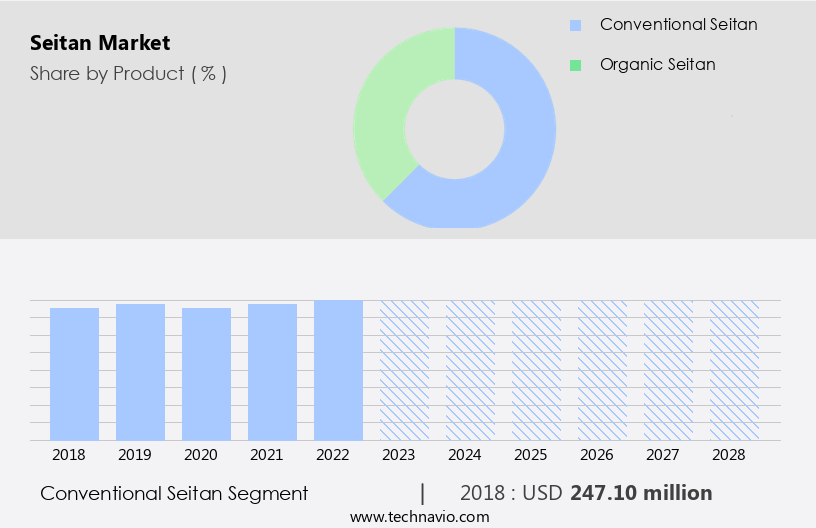
The Conventional seitan segment was valued at USD 247.10 million in 2018 and showed a gradual increase during the forecast period.

Regional Analysis

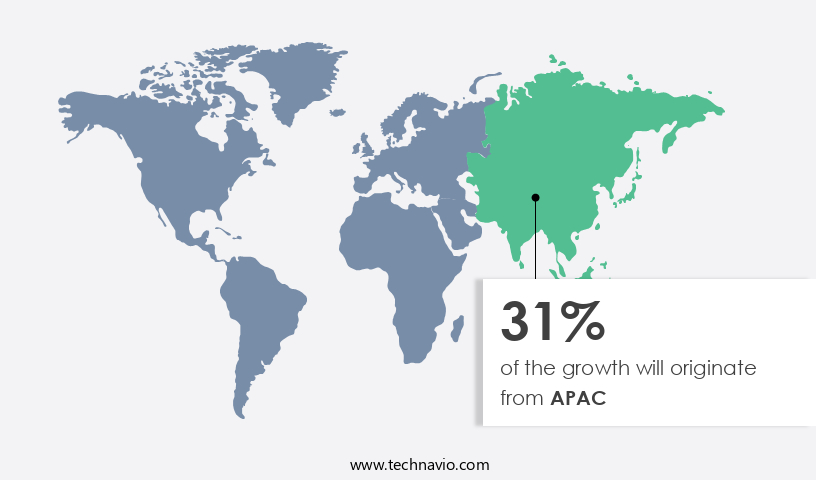
APAC is estimated to contribute 31% to the growth of the global market during the forecast period.Technavio's analysts have elaborately explained the regional trends and drivers that shape the market during the forecast period.

Seitan Market Share by Geography

 Request Free Sample

Seitan, a wheat-based meat alternative, gains popularity in Asia and beyond due to its gluten strength and textural characteristics. In Japan, China, Vietnam, and South Korea, this plant-based protein is widely used, often referred to as "Buddha's food" or "mock duck." Seitan's versatility shines in various dishes, such as tacos with cooked vegetables and seasoned with cumin and chili powder, or meaty sautéed seitan marinated in barbecue sauce and vinegar, suitable for sandwiches and burritos. The production process involves the extraction of wheat protein isolate, which showcases functional properties essential for seitan's desirable texture. Processing parameters like gluten hydration capacity, protein denaturation effects, and yield optimization are crucial in achieving the optimal texture.

Sensory evaluation plays a significant role in ensuring consumer acceptance. Manufacturing cost, food safety regulations, and food processing technology are critical factors in the production process. Gluten washing techniques and vital wheat gluten are employed to enhance the protein's solubility and water absorption. Shelf life extension is achieved through proper storage conditions and packaging methods. Microbial contamination and protein denaturation effects are addressed through rigorous product quality control measures. Seitan's amino acid profile and allergenic protein content are essential considerations for those with dietary restrictions. Gluten hydrolysis and emulsifying capacity contribute to its nutritional composition. Dough kneading methods and rheological properties influence seitan's final texture.

Understanding these factors and maintaining optimal processing conditions are key to producing high-quality seitan.

Market Dynamics

Our researchers analyzed the data with 2023 as the base year, along with the key drivers, trends, and challenges. A holistic analysis of drivers will help companies refine their marketing strategies to gain a competitive advantage.

The global seitan market size and forecast projects growth, driven by seitan market trends 2024-2028. B2B seitan supply solutions leverage plant-based protein technologies for quality. Seitan market growth opportunities 2025 include seitan for vegan foods and organic seitan products, meeting demand. Seitan supply chain software optimizes operations, while seitan market competitive analysis highlights key brands. Sustainable seitan production practices align with eco-friendly food trends. Seitan regulations 2024-2028 shapes seitan demand in North America 2025. High-protein seitan solutions and premium seitan market insights boost adoption. Seitan for foodservice and customized seitan products target niches. Seitan market challenges and solutions address texture, with direct procurement strategies for seitan and seitan pricing optimization enhancing profitability.

What are the key market drivers leading to the rise in the adoption of Seitan Industry?

  • The implementation of advanced distribution channels serves as the primary catalyst for market growth.  Seitan, a versatile plant-based protein derived from vital wheat gluten, is gaining popularity in the global food industry due to its high nutritional value and texture similar to meat. Supermarkets serve as significant distribution channels for this product, catering to the increasing demand for convenient and nutritious food options. Seitan is easily accessible in major supermarkets and convenience stores, including Kroger, Walmart, Whole Foods, and Trader Joe's. The production process of Seitan involves gluten washing techniques to remove starch and other impurities, ensuring the highest gluten hydration capacity for optimal product quality. Food safety regulations and advanced food processing technology are crucial in the production and packaging methods to prevent microbial contamination and protein denaturation effects.
  • These factors contribute to the growing market demand for Seitan and its availability in various product sizes and formats. The supermarket industry's continuous growth, driven by population expansion and consumer preferences, further bolsters the market potential for Seitan.

What are the market trends shaping the Seitan Industry?

  • The vegan population is experiencing significant growth, making it a noteworthy market trend for professionals to acknowledge. This expanding demographic presents valuable opportunities for businesses catering to plant-based diets.
  • The market is experiencing significant growth due to the increasing adoption of vegan diets by consumers seeking healthier alternatives. Seitan, a popular vegan protein source derived from wheat gluten, offers various health benefits such as increased fiber intake, antioxidants, and essential nutrients like potassium, magnesium, folate, and vitamins A, C, and E. This plant-based protein is also known to aid in weight loss and improve kidney functions while lowering blood sugar levels. Consumer acceptance of gluten-free alternatives, including seitan, has been on the rise due to the growing awareness of the health benefits associated with such diets.
  • The production process of seitan involves the extraction and processing of wheat protein isolate, which is then shaped and cooked to achieve the desired textural characteristics. The processing parameters, including temperature, pressure, and time, significantly impact the final texture of seitan. Seitan texture analysis is crucial to ensure the desired texture and palatability of the final product. The functional properties of wheat protein isolate play a significant role in the production process, determining the texture, taste, and overall quality of seitan.

What challenges does the Seitan Industry face during its growth?

  • The growth of the food industry is significantly challenged by the adverse effects associated with highly processed food. These effects, which can include negative health consequences for consumers, present a major concern that must be addressed by industry professionals. 
  • Seitan, a nutritious yet processed food item, is derived from wheat gluten. Its production involves rinsing starch from kneaded wheat flour dough. While Seitan offers various health benefits due to its high protein content and amino acid profile, it is not suitable for individuals with gluten intolerance, wheat sensitivity, celiac disease, or fatigue due to its gluten protein content. Manufacturing Seitan involves several processes, including gluten protein extraction and gluten hydrolysis, to optimize yield and gluten elasticity. Sensory evaluation plays a crucial role in assessing the final product's texture and taste. However, the use of wheat gluten in Seitan production increases its manufacturing cost and allergenic protein content.
  • Consumers' growing awareness of health and wellness trends and the availability of alternative protein sources may impact the demand for Seitan. Manufacturers continue to focus on research and development to improve the production process and reduce the manufacturing cost while maintaining product quality.

Exclusive Customer Landscape

The seitan market forecasting report includes the adoption lifecycle of the market, covering from the innovator's stage to the laggard's stage. It focuses on adoption rates in different regions based on penetration. Furthermore, the seitan market report also includes key purchase criteria and drivers of price sensitivity to help companies evaluate and develop their market growth analysis strategies.
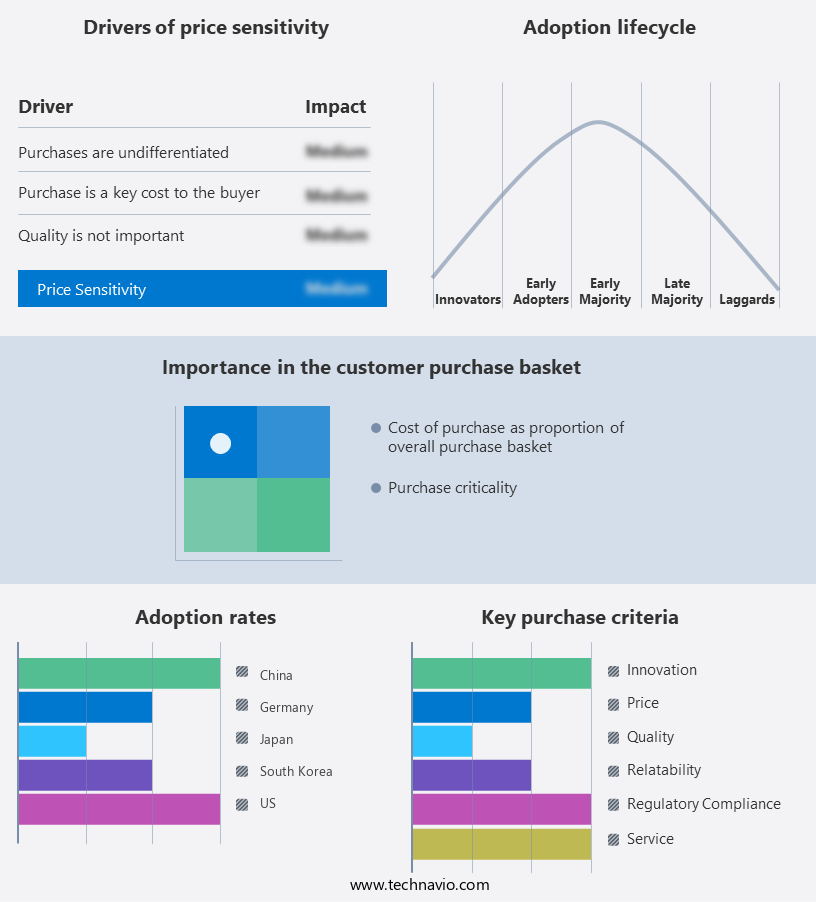
Seitan Market Share by Geography

 Customer Landscape

Key Companies & Market Insights

Companies are implementing various strategies, such as strategic alliances, seitan market forecast, partnerships, mergers and acquisitions, geographical expansion, and product/service launches, to enhance their presence in the industry.

Amy's Kitchen - The company specializes in producing and marketing plant-based protein alternatives, including tofu, seitan, and tempeh, catering to the growing demand for sustainable and ethical food choices in the global market. These soy and wheat-based products provide consumers with high-protein, low-fat options, aligning with dietary preferences and health-conscious lifestyles.

The industry research and growth report includes detailed analyses of the competitive landscape of the market and information about key companies, including:

  • Amy's Kitchen
  • Beyond Meat
  • Bobs Red Mill
  • Conagra Brands
  • Field Roast
  • Gardein
  • Hain Celestial Group
  • Hodo Foods
  • House Foods Group
  • Lightlife Foods
  • MorningStar Farms
  • Nasoya
  • Pacific Foods
  • Sweet Earth Foods
  • Tofurky
  • Upton's Naturals
  • Vbites
  • West Soy
  • Wheaty
  • Yves Veggie Cuisine

Qualitative and quantitative analysis of companies has been conducted to help clients understand the wider business environment as well as the strengths and weaknesses of key industry players. Data is qualitatively analyzed to categorize companies as pure play, category-focused, industry-focused, and diversified; it is quantitatively analyzed to categorize companies as dominant, leading, strong, tentative, and weak.

Recent Development and News in Seitan Market

  • In January 2024, The Quorn Foods Company, a leading player in the meat alternative market, announced the launch of its new seitan-based product line, "Quorn Seitan Strips," in collaboration with US-based vegan restaurant chain, VeggieGrill. This strategic partnership aimed to expand Quorn's presence in the US market and cater to the growing demand for plant-based protein options (Quorn Foods Press Release, 2024).
  • In March 2024, Greenleaf Foods, a major producer of plant-based proteins, completed the acquisition of Field Roast Grain Meat Co., a well-known seitan brand. This strategic move strengthened Greenleaf's product portfolio and broadened its customer base, as Field Roast's offerings complemented Greenleaf's existing product lines (Greenleaf Foods Press Release, 2024).
  • In May 2024, The Good Food Institute (GFI), a nonprofit organization promoting alternative proteins, secured a USD17 million investment from the Bill & Melinda Gates Foundation. This funding would support GFI's research and development efforts in the alternative protein sector, including seitan, to address global food security challenges and reduce the environmental impact of animal agriculture (Gates Foundation Press Release, 2024).
  • In February 2025, Eat Just, Inc., the creators of the plant-based egg product, Just Egg, revealed their latest innovation: Just Seitan. This new product line, made from wheat protein, aimed to cater to the growing demand for plant-based meat alternatives and expand Eat Just's product offerings beyond eggs (Eat Just Press Release, 2025).

Research Analyst Overview

  • In the dynamic the market, consumer perception plays a significant role in shaping trends. Gluten-free labeling, a key consideration for many consumers, drives process optimization and ingredient sourcing strategies. Sustainability practices and environmental impact are increasingly important, offering competitive advantages for brands. New product development, often driven by protein extraction methods and product differentiation, requires careful supply chain management and sales promotion. Gluten network formation and quality control metrics are essential for maintaining brand positioning and regulatory compliance. Energy consumption and cost reduction strategies are crucial for optimizing manufacturing techniques, while research and development continues to explore innovative ingredients and pricing strategies.
  • Packaging materials and distribution channels are critical for reaching consumers, with waste management and labor cost being key considerations. As the market evolves, brands must stay agile, adapting to changing consumer preferences and regulatory requirements while minimizing their environmental footprint.

Dive into Technavio's robust research methodology, blending expert interviews, extensive data synthesis, and validated models for unparalleled Seitan Market insights. See full methodology.

Market Scope

Report Coverage

Details

Page number

140

Base year

2023

Historic period

2018-2022

Forecast period

2024-2028

Growth momentum & CAGR

Accelerate at a CAGR of 3.27%

Market growth 2024-2028

USD 63.8 million

Market structure

Concentrated

YoY growth 2023-2024(%)

3.12

Key countries

US, China, Germany, Japan, UK, Australia, India, France, Brazil, UAE, Rest of World (ROW), Saudi Arabia, France, South Korea, Mexico, Italy, and Spain

Competitive landscape

Leading Companies, Market Positioning of Companies, Competitive Strategies, and Industry Risks

Request Free Sample

What are the Key Data Covered in this Seitan Market Research and Growth Report?

  • CAGR of the Seitan industry during the forecast period
  • Detailed information on factors that will drive the growth and forecasting between 2024 and 2028
  • Precise estimation of the size of the market and its contribution of the industry in focus to the parent market
  • Accurate predictions about upcoming growth and trends and changes in consumer behaviour
  • Growth of the market across APAC, Europe, North America, South America, and Middle East and Africa
  • Thorough analysis of the market's competitive landscape and detailed information about companies
  • Comprehensive analysis of factors that will challenge the seitan market growth of industry companies

We can help! Our analysts can customize this seitan market research report to meet your requirements.

Get in touch

1 Executive Summary

  • 1.1 Market overview
    • Executive Summary - Chart on Market Overview
    • Executive Summary - Data Table on Market Overview
    • Executive Summary - Chart on Global Market Characteristics
    • Executive Summary - Chart on Market by Geography
    • Executive Summary - Chart on Market Segmentation by Product
    • Executive Summary - Chart on Incremental Growth
    • Executive Summary - Data Table on Incremental Growth
    • Executive Summary - Chart on Company Market Positioning

2 Market Landscape

  • 2.1 Market ecosystem
    • Parent Market
    • Data Table on - Parent Market
  • 2.2 Market characteristics
    • Market characteristics analysis
  • 2.3 Value chain analysis
    • Value Chain Analysis

3 Market Sizing

  • 3.1 Market definition
    • Offerings of companies included in the market definition
  • 3.2 Market segment analysis
    • Market segments
  • 3.3 Market size 2023
    • 3.4 Market outlook: Forecast for 2023-2028
      • Chart on Global - Market size and forecast 2023-2028 ($ million)
      • Data Table on Global - Market size and forecast 2023-2028 ($ million)
      • Chart on Global Market: Year-over-year growth 2023-2028 (%)
      • Data Table on Global Market: Year-over-year growth 2023-2028 (%)

    4 Historic Market Size

    • 4.1 Global Seitan Market 2018 - 2022
      • Historic Market Size - Data Table on Global Seitan Market 2018 - 2022 ($ million)
    • 4.2 Product segment analysis 2018 - 2022
      • Historic Market Size - Product Segment 2018 - 2022 ($ million)
    • 4.3 Geography segment analysis 2018 - 2022
      • Historic Market Size - Geography Segment 2018 - 2022 ($ million)
    • 4.4 Country segment analysis 2018 - 2022
      • Historic Market Size - Country Segment 2018 - 2022 ($ million)

    5 Five Forces Analysis

    • 5.1 Five forces summary
      • Five forces analysis - Comparison between 2023 and 2028
    • 5.2 Bargaining power of buyers
      • Bargaining power of buyers - Impact of key factors 2023 and 2028
    • 5.3 Bargaining power of suppliers
      • Bargaining power of suppliers - Impact of key factors in 2023 and 2028
    • 5.4 Threat of new entrants
      • Threat of new entrants - Impact of key factors in 2023 and 2028
    • 5.5 Threat of substitutes
      • Threat of substitutes - Impact of key factors in 2023 and 2028
    • 5.6 Threat of rivalry
      • Threat of rivalry - Impact of key factors in 2023 and 2028
    • 5.7 Market condition
      • Chart on Market condition - Five forces 2023 and 2028

    6 Market Segmentation by Product

    • 6.1 Market segments
      • Chart on Product - Market share (2023-2028) (%)
      • Data Table on Product - Market share (2023-2028) (%)
    • 6.2 Comparison by Product
      • Chart on Comparison by Product
      • Data Table on Comparison by Product
    • 6.3 Conventional seitan - Market size and forecast (2023-2028)
      • Chart on Conventional seitan - Market size and forecast (2023-2028) ($ million)
      • Data Table on Conventional seitan - Market size and forecast (2023-2028) ($ million)
      • Chart on Conventional seitan - Year-over-year growth (2023-2028) (%)
      • Data Table on Conventional seitan - Year-over-year growth (2023-2028) (%)
    • 6.4 Organic seitan - Market size and forecast (2023-2028)
      • Chart on Organic seitan - Market size and forecast (2023-2028) ($ million)
      • Data Table on Organic seitan - Market size and forecast (2023-2028) ($ million)
      • Chart on Organic seitan - Year-over-year growth (2023-2028) (%)
      • Data Table on Organic seitan - Year-over-year growth (2023-2028) (%)
    • 6.5 Market opportunity by Product
      • Market opportunity by Product ($ million)
      • Data Table on Market opportunity by Product ($ million)

    7 Market Segmentation by End-User

    • 7.1 Market segments
      • Chart on End-User - Market share (2023-2028) (%)
      • Data Table on End-User - Market share (2023-2028) (%)
    • 7.2 Comparison by End-User
      • Chart on Comparison by End-User
      • Data Table on Comparison by End-User
    • 7.3 Vegan Consumers - Market size and forecast (2023-2028)
      • Chart on Vegan Consumers - Market size and forecast (2023-2028) ($ million)
      • Data Table on Vegan Consumers - Market size and forecast (2023-2028) ($ million)
      • Chart on Vegan Consumers - Year-over-year growth (2023-2028) (%)
      • Data Table on Vegan Consumers - Year-over-year growth (2023-2028) (%)
    • 7.4 Restaurants - Market size and forecast (2023-2028)
      • Chart on Restaurants - Market size and forecast (2023-2028) ($ million)
      • Data Table on Restaurants - Market size and forecast (2023-2028) ($ million)
      • Chart on Restaurants - Year-over-year growth (2023-2028) (%)
      • Data Table on Restaurants - Year-over-year growth (2023-2028) (%)
    • 7.5 Food Manufacturers - Market size and forecast (2023-2028)
      • Chart on Food Manufacturers - Market size and forecast (2023-2028) ($ million)
      • Data Table on Food Manufacturers - Market size and forecast (2023-2028) ($ million)
      • Chart on Food Manufacturers - Year-over-year growth (2023-2028) (%)
      • Data Table on Food Manufacturers - Year-over-year growth (2023-2028) (%)
    • 7.6 Market opportunity by End-User
      • Market opportunity by End-User ($ million)
      • Data Table on Market opportunity by End-User ($ million)

    8 Market Segmentation by Distribution Channel

    • 8.1 Market segments
      • Chart on Distribution Channel - Market share (2023-2028) (%)
      • Data Table on Distribution Channel - Market share (2023-2028) (%)
    • 8.2 Comparison by Distribution Channel
      • Chart on Comparison by Distribution Channel
      • Data Table on Comparison by Distribution Channel
    • 8.3 Supermarkets - Market size and forecast (2023-2028)
      • Chart on Supermarkets - Market size and forecast (2023-2028) ($ million)
      • Data Table on Supermarkets - Market size and forecast (2023-2028) ($ million)
      • Chart on Supermarkets - Year-over-year growth (2023-2028) (%)
      • Data Table on Supermarkets - Year-over-year growth (2023-2028) (%)
    • 8.4 Online Retail - Market size and forecast (2023-2028)
      • Chart on Online Retail - Market size and forecast (2023-2028) ($ million)
      • Data Table on Online Retail - Market size and forecast (2023-2028) ($ million)
      • Chart on Online Retail - Year-over-year growth (2023-2028) (%)
      • Data Table on Online Retail - Year-over-year growth (2023-2028) (%)
    • 8.5 Specialty Stores - Market size and forecast (2023-2028)
      • Chart on Specialty Stores - Market size and forecast (2023-2028) ($ million)
      • Data Table on Specialty Stores - Market size and forecast (2023-2028) ($ million)
      • Chart on Specialty Stores - Year-over-year growth (2023-2028) (%)
      • Data Table on Specialty Stores - Year-over-year growth (2023-2028) (%)
    • 8.6 Market opportunity by Distribution Channel
      • Market opportunity by Distribution Channel ($ million)
      • Data Table on Market opportunity by Distribution Channel ($ million)

    9 Market Segmentation by Application

    • 9.1 Market segments
      • Chart on Application - Market share (2023-2028) (%)
      • Data Table on Application - Market share (2023-2028) (%)
    • 9.2 Comparison by Application
      • Chart on Comparison by Application
      • Data Table on Comparison by Application
    • 9.3 Meat Substitutes - Market size and forecast (2023-2028)
      • Chart on Meat Substitutes - Market size and forecast (2023-2028) ($ million)
      • Data Table on Meat Substitutes - Market size and forecast (2023-2028) ($ million)
      • Chart on Meat Substitutes - Year-over-year growth (2023-2028) (%)
      • Data Table on Meat Substitutes - Year-over-year growth (2023-2028) (%)
    • 9.4 Bakery Products - Market size and forecast (2023-2028)
      • Chart on Bakery Products - Market size and forecast (2023-2028) ($ million)
      • Data Table on Bakery Products - Market size and forecast (2023-2028) ($ million)
      • Chart on Bakery Products - Year-over-year growth (2023-2028) (%)
      • Data Table on Bakery Products - Year-over-year growth (2023-2028) (%)
    • 9.5 Processed Foods - Market size and forecast (2023-2028)
      • Chart on Processed Foods - Market size and forecast (2023-2028) ($ million)
      • Data Table on Processed Foods - Market size and forecast (2023-2028) ($ million)
      • Chart on Processed Foods - Year-over-year growth (2023-2028) (%)
      • Data Table on Processed Foods - Year-over-year growth (2023-2028) (%)
    • 9.6 Market opportunity by Application
      • Market opportunity by Application ($ million)
      • Data Table on Market opportunity by Application ($ million)

    10 Customer Landscape

    • 10.1 Customer landscape overview
      • Analysis of price sensitivity, lifecycle, customer purchase basket, adoption rates, and purchase criteria

    11 Geographic Landscape

    • 11.1 Geographic segmentation
      • Chart on Market share by geography 2023-2028 (%)
      • Data Table on Market share by geography 2023-2028 (%)
    • 11.2 Geographic comparison
      • Chart on Geographic comparison
      • Data Table on Geographic comparison
    • 11.3 APAC - Market size and forecast 2023-2028
      • Chart on APAC - Market size and forecast 2023-2028 ($ million)
      • Data Table on APAC - Market size and forecast 2023-2028 ($ million)
      • Chart on APAC - Year-over-year growth 2023-2028 (%)
      • Data Table on APAC - Year-over-year growth 2023-2028 (%)
    • 11.4 Europe - Market size and forecast 2023-2028
      • Chart on Europe - Market size and forecast 2023-2028 ($ million)
      • Data Table on Europe - Market size and forecast 2023-2028 ($ million)
      • Chart on Europe - Year-over-year growth 2023-2028 (%)
      • Data Table on Europe - Year-over-year growth 2023-2028 (%)
    • 11.5 North America - Market size and forecast 2023-2028
      • Chart on North America - Market size and forecast 2023-2028 ($ million)
      • Data Table on North America - Market size and forecast 2023-2028 ($ million)
      • Chart on North America - Year-over-year growth 2023-2028 (%)
      • Data Table on North America - Year-over-year growth 2023-2028 (%)
    • 11.6 South America - Market size and forecast 2023-2028
      • Chart on South America - Market size and forecast 2023-2028 ($ million)
      • Data Table on South America - Market size and forecast 2023-2028 ($ million)
      • Chart on South America - Year-over-year growth 2023-2028 (%)
      • Data Table on South America - Year-over-year growth 2023-2028 (%)
    • 11.7 Middle East and Africa - Market size and forecast 2023-2028
      • Chart on Middle East and Africa - Market size and forecast 2023-2028 ($ million)
      • Data Table on Middle East and Africa - Market size and forecast 2023-2028 ($ million)
      • Chart on Middle East and Africa - Year-over-year growth 2023-2028 (%)
      • Data Table on Middle East and Africa - Year-over-year growth 2023-2028 (%)
    • 11.8 US - Market size and forecast 2023-2028
      • Chart on US - Market size and forecast 2023-2028 ($ million)
      • Data Table on US - Market size and forecast 2023-2028 ($ million)
      • Chart on US - Year-over-year growth 2023-2028 (%)
      • Data Table on US - Year-over-year growth 2023-2028 (%)
    • 11.9 China - Market size and forecast 2023-2028
      • Chart on China - Market size and forecast 2023-2028 ($ million)
      • Data Table on China - Market size and forecast 2023-2028 ($ million)
      • Chart on China - Year-over-year growth 2023-2028 (%)
      • Data Table on China - Year-over-year growth 2023-2028 (%)
    • 11.10 Japan - Market size and forecast 2023-2028
      • Chart on Japan - Market size and forecast 2023-2028 ($ million)
      • Data Table on Japan - Market size and forecast 2023-2028 ($ million)
      • Chart on Japan - Year-over-year growth 2023-2028 (%)
      • Data Table on Japan - Year-over-year growth 2023-2028 (%)
    • 11.11 South Korea - Market size and forecast 2023-2028
      • Chart on South Korea - Market size and forecast 2023-2028 ($ million)
      • Data Table on South Korea - Market size and forecast 2023-2028 ($ million)
      • Chart on South Korea - Year-over-year growth 2023-2028 (%)
      • Data Table on South Korea - Year-over-year growth 2023-2028 (%)
    • 11.12 Germany - Market size and forecast 2023-2028
      • Chart on Germany - Market size and forecast 2023-2028 ($ million)
      • Data Table on Germany - Market size and forecast 2023-2028 ($ million)
      • Chart on Germany - Year-over-year growth 2023-2028 (%)
      • Data Table on Germany - Year-over-year growth 2023-2028 (%)
    • 11.13 Market opportunity by geography
      • Market opportunity by geography ($ million)
      • Data Tables on Market opportunity by geography ($ million)
    • 11.14 US - Market size and forecast (2023-2028)
      • Chart on US - Market size and forecast (2023-2028) ($ million)
      • Data Table on US - Market size and forecast (2023-2028) ($ million)
      • Chart on US - Year-over-year growth (2023-2028) (%)
      • Data Table on US - Year-over-year growth (2023-2028) (%)
    • 11.15 UK - Market size and forecast (2023-2028)
      • Chart on UK - Market size and forecast (2023-2028) ($ million)
      • Data Table on UK - Market size and forecast (2023-2028) ($ million)
      • Chart on UK - Year-over-year growth (2023-2028) (%)
      • Data Table on UK - Year-over-year growth (2023-2028) (%)
    • 11.16 Australia - Market size and forecast (2023-2028)
      • Chart on Australia - Market size and forecast (2023-2028) ($ million)
      • Data Table on Australia - Market size and forecast (2023-2028) ($ million)
      • Chart on Australia - Year-over-year growth (2023-2028) (%)
      • Data Table on Australia - Year-over-year growth (2023-2028) (%)
    • 11.17 India - Market size and forecast (2023-2028)
      • Chart on India - Market size and forecast (2023-2028) ($ million)
      • Data Table on India - Market size and forecast (2023-2028) ($ million)
      • Chart on India - Year-over-year growth (2023-2028) (%)
      • Data Table on India - Year-over-year growth (2023-2028) (%)
    • 11.18 France - Market size and forecast (2023-2028)
      • Chart on France - Market size and forecast (2023-2028) ($ million)
      • Data Table on France - Market size and forecast (2023-2028) ($ million)
      • Chart on France - Year-over-year growth (2023-2028) (%)
      • Data Table on France - Year-over-year growth (2023-2028) (%)
    • 11.19 Brazil - Market size and forecast (2023-2028)
      • Chart on Brazil - Market size and forecast (2023-2028) ($ million)
      • Data Table on Brazil - Market size and forecast (2023-2028) ($ million)
      • Chart on Brazil - Year-over-year growth (2023-2028) (%)
      • Data Table on Brazil - Year-over-year growth (2023-2028) (%)
    • 11.20 UAE - Market size and forecast (2023-2028)
      • Chart on UAE - Market size and forecast (2023-2028) ($ million)
      • Data Table on UAE - Market size and forecast (2023-2028) ($ million)
      • Chart on UAE - Year-over-year growth (2023-2028) (%)
      • Data Table on UAE - Year-over-year growth (2023-2028) (%)
    • 11.21 Rest of World (ROW) - Market size and forecast (2023-2028)
      • Chart on Rest of World (ROW) - Market size and forecast (2023-2028) ($ million)
      • Data Table on Rest of World (ROW) - Market size and forecast (2023-2028) ($ million)
      • Chart on Rest of World (ROW) - Year-over-year growth (2023-2028) (%)
      • Data Table on Rest of World (ROW) - Year-over-year growth (2023-2028) (%)
    • 11.22 Saudi Arabia - Market size and forecast (2023-2028)
      • Chart on Saudi Arabia - Market size and forecast (2023-2028) ($ million)
      • Data Table on Saudi Arabia - Market size and forecast (2023-2028) ($ million)
      • Chart on Saudi Arabia - Year-over-year growth (2023-2028) (%)
      • Data Table on Saudi Arabia - Year-over-year growth (2023-2028) (%)
    • 11.23 Mexico - Market size and forecast (2023-2028)
      • Chart on Mexico - Market size and forecast (2023-2028) ($ million)
      • Data Table on Mexico - Market size and forecast (2023-2028) ($ million)
      • Chart on Mexico - Year-over-year growth (2023-2028) (%)
      • Data Table on Mexico - Year-over-year growth (2023-2028) (%)
    • 11.24 Italy - Market size and forecast (2023-2028)
      • Chart on Italy - Market size and forecast (2023-2028) ($ million)
      • Data Table on Italy - Market size and forecast (2023-2028) ($ million)
      • Chart on Italy - Year-over-year growth (2023-2028) (%)
      • Data Table on Italy - Year-over-year growth (2023-2028) (%)
    • 11.25 Spain - Market size and forecast (2023-2028)
      • Chart on Spain - Market size and forecast (2023-2028) ($ million)
      • Data Table on Spain - Market size and forecast (2023-2028) ($ million)
      • Chart on Spain - Year-over-year growth (2023-2028) (%)
      • Data Table on Spain - Year-over-year growth (2023-2028) (%)

    12 Drivers, Challenges, and Opportunity/Restraints

    • 12.1 Market drivers
      • 12.2 Market challenges
        • 12.3 Impact of drivers and challenges
          • Impact of drivers and challenges in 2023 and 2028
        • 12.4 Market opportunities/restraints

          13 Competitive Landscape

          • 13.1 Overview
            • 13.2 Competitive Landscape
              • Overview on criticality of inputs and factors of differentiation
            • 13.3 Landscape disruption
              • Overview on factors of disruption
            • 13.4 Industry risks
              • Impact of key risks on business

            14 Competitive Analysis

            • 14.1 Companies profiled
              • Companies covered
            • 14.2 Market positioning of companies
              • Matrix on companies position and classification
            • 14.3 Amy’s Kitchen
              • Amy’s Kitchen - Overview
              • Amy’s Kitchen - Product / Service
              • Amy’s Kitchen - Key offerings
            • 14.4 Beyond Meat
              • Beyond Meat - Overview
              • Beyond Meat - Product / Service
              • Beyond Meat - Key offerings
            • 14.5 Bobs Red Mill
              • Bobs Red Mill - Overview
              • Bobs Red Mill - Product / Service
              • Bobs Red Mill - Key offerings
            • 14.6 Conagra Brands
              • Conagra Brands - Overview
              • Conagra Brands - Product / Service
              • Conagra Brands - Key offerings
            • 14.7 Field Roast
              • Field Roast - Overview
              • Field Roast - Product / Service
              • Field Roast - Key offerings
            • 14.8 Gardein
              • Gardein - Overview
              • Gardein - Product / Service
              • Gardein - Key offerings
            • 14.9 Hain Celestial Group
              • Hain Celestial Group - Overview
              • Hain Celestial Group - Product / Service
              • Hain Celestial Group - Key offerings
            • 14.10 Hodo Foods
              • Hodo Foods - Overview
              • Hodo Foods - Product / Service
              • Hodo Foods - Key offerings
            • 14.11 House Foods Group
              • House Foods Group - Overview
              • House Foods Group - Product / Service
              • House Foods Group - Key offerings
            • 14.12 Lightlife Foods
              • Lightlife Foods - Overview
              • Lightlife Foods - Product / Service
              • Lightlife Foods - Key offerings
            • 14.13 MorningStar Farms
              • MorningStar Farms - Overview
              • MorningStar Farms - Product / Service
              • MorningStar Farms - Key offerings
            • 14.14 Nasoya
              • Nasoya - Overview
              • Nasoya - Product / Service
              • Nasoya - Key offerings
            • 14.15 Pacific Foods
              • Pacific Foods - Overview
              • Pacific Foods - Product / Service
              • Pacific Foods - Key offerings
            • 14.16 Sweet Earth Foods
              • Sweet Earth Foods - Overview
              • Sweet Earth Foods - Product / Service
              • Sweet Earth Foods - Key offerings
            • 14.17 Tofurky
              • Tofurky - Overview
              • Tofurky - Product / Service
              • Tofurky - Key offerings
            • 14.18 Upton’s Naturals
              • Upton’s Naturals - Overview
              • Upton’s Naturals - Product / Service
              • Upton’s Naturals - Key offerings
            • 14.19 Vbites
              • Vbites - Overview
              • Vbites - Product / Service
              • Vbites - Key offerings
            • 14.20 West Soy
              • West Soy - Overview
              • West Soy - Product / Service
              • West Soy - Key offerings
            • 14.21 Wheaty
              • Wheaty - Overview
              • Wheaty - Product / Service
              • Wheaty - Key offerings
            • 14.22 Yves Veggie Cuisine
              • Yves Veggie Cuisine - Overview
              • Yves Veggie Cuisine - Product / Service
              • Yves Veggie Cuisine - Key offerings
            • 14.23 Biolab Srl
              • Biolab Srl - Overview
              • Biolab Srl - Product / Service
              • Biolab Srl - Key offerings
            • 14.24 IOOP bv
              • IOOP bv - Overview
              • IOOP bv - Product / Service
              • IOOP bv - Key offerings
            • 14.25 Machandel bv
              • Machandel bv - Overview
              • Machandel bv - Product / Service
              • Machandel bv - Key offerings
            • 14.26 Nestle SA
              • Nestle SA - Overview
              • Nestle SA - Product / Service
              • Nestle SA - Key offerings
            • 14.27 Pacific Foods of Oregon LLC
              • Pacific Foods of Oregon LLC - Overview
              • Pacific Foods of Oregon LLC - Product / Service
              • Pacific Foods of Oregon LLC - Key offerings
            • 14.28 Primal Spirit Foods Inc.
              • Primal Spirit Foods Inc. - Overview
              • Primal Spirit Foods Inc. - Product / Service
              • Primal Spirit Foods Inc. - Key offerings
            • 14.29 The Hain Celestial Group Inc.
              • The Hain Celestial Group Inc. - Overview
              • The Hain Celestial Group Inc. - Product / Service
              • The Hain Celestial Group Inc. - Key offerings
            • 14.30 Topas GmbH
              • Topas GmbH - Overview
              • Topas GmbH - Product / Service
              • Topas GmbH - Key offerings
            • 14.31 Upton Naturals
              • Upton Naturals - Overview
              • Upton Naturals - Product / Service
              • Upton Naturals - Key offerings
            • 14.32 VBites Foods Ltd.
              • VBites Foods Ltd. - Overview
              • VBites Foods Ltd. - Product / Service
              • VBites Foods Ltd. - Key offerings

            15 Appendix

            • 15.1 Scope of the report
              • 15.2 Inclusions and exclusions checklist
                • Inclusions checklist
                • Exclusions checklist
              • 15.3 Currency conversion rates for US$
                • Currency conversion rates for US$
              • 15.4 Research methodology
                • Research methodology
              • 15.5 Data procurement
                • Information sources
              • 15.6 Data validation
                • Data validation
              • 15.7 Validation techniques employed for market sizing
                • Validation techniques employed for market sizing
              • 15.8 Data synthesis
                • Data synthesis
              • 15.9 360 degree market analysis
                • 360 degree market analysis
              • 15.10 List of abbreviations
                • List of abbreviations

              Research Methodology

              Technavio presents a detailed picture of the market by way of study, synthesis, and summation of data from multiple sources. The analysts have presented the various facets of the market with a particular focus on identifying the key industry influencers. The data thus presented is comprehensive, reliable, and the result of extensive research, both primary and secondary.

              INFORMATION SOURCES

              Primary sources

              • Manufacturers and suppliers
              • Channel partners
              • Industry experts
              • Strategic decision makers

              Secondary sources

              • Industry journals and periodicals
              • Government data
              • Financial reports of key industry players
              • Historical data
              • Press releases

              DATA ANALYSIS

              Data Synthesis

              • Collation of data
              • Estimation of key figures
              • Analysis of derived insights

              Data Validation

              • Triangulation with data models
              • Reference against proprietary databases
              • Corroboration with industry experts

              REPORT WRITING

              Qualitative

              • Market drivers
              • Market challenges
              • Market trends
              • Five forces analysis

              Quantitative

              • Market size and forecast
              • Market segmentation
              • Geographical insights
              • Competitive landscape

              Interested in this report?

              Get your sample now to see our research methodology and insights!

              Download Now

              Frequently Asked Questions

              Seitan market growth will increase by $ 63.8 mn during 2024-2028.

              The Seitan market is expected to grow at a CAGR of 3.27% during 2024-2028.

              Seitan market is segmented by Product( Conventional seitan, Organic seitan) End-User( Vegan Consumers, Restaurants, Food Manufacturers)

              Amy’s Kitchen, Beyond Meat, Bobs Red Mill, Conagra Brands, Field Roast, Gardein, Hain Celestial Group, Hodo Foods, House Foods Group, Lightlife Foods, MorningStar Farms, Nasoya, Pacific Foods, Sweet Earth Foods, Tofurky, Upton’s Naturals, Vbites, West Soy, Wheaty, Yves Veggie Cuisine are a few of the key vendors in the Seitan market.

              APAC will register the highest growth rate of 31% among the other regions. Therefore, the Seitan market in APAC is expected to garner significant business opportunities for the vendors during the forecast period.

              US, China, Germany, Japan, UK, Australia, India, France, Brazil, UAE, Rest of World (ROW), Saudi Arabia, France, South Korea, Mexico, Italy, Spain

              • Enhanced channels of distributionOrganized retailers have grown globally with the establishment of supermarkets is the driving factor this market.
              • hypermarkets is the driving factor this market.
              • and specialty stores. Ready-to-eat food items are primarily sold by large organized retailers is the driving factor this market.
              • and the vendors of such products are highly dependent on them. Seitan can be easily found in major supermarkets and convenience stores and is available in various product sizes. It is easily available in supermarkets such as Kroger is the driving factor this market.
              • Walmart is the driving factor this market.
              • Whole Foods is the driving factor this market.
              • and Trader Joe's.Supermarkets are major distribution channels that supply nutritious and affordable food. Owing to the population growth in many countries is the driving factor this market.
              • the demand for supermarkets is increasing. On average is the driving factor this market.
              • a consumer on a trip to a supermarket spends $30. The US had over 38 is the driving factor this market.
              • 500 supermarkets in 2017 is the driving factor this market.
              • and the number is expected to increase further during the forecast period. Other countries that have a high degree of penetration of supermarkets are Brazil is the driving factor this market.
              • Chile is the driving factor this market.
              • and Mexico in Latin America. Supermarkets alone account for around 55% of food sales globally. It is expected that by 2018 is the driving factor this market.
              • the sales of products through supermarkets in developing countries will account for around 65%-70%.In India is the driving factor this market.
              • the growth rate of supermarkets has been increasing. This can be attributed to the growing urbanization and the rising disposable income of people. In 2015 is the driving factor this market.
              • 33% of the Indian population was urbanized is the driving factor this market.
              • and this is expected to grow at a rate of 2.5% during the forecast period. It is estimated that by 2025 is the driving factor this market.
              • India will constitute around 6.9% of the world's urban population. In addition is the driving factor this market.
              • the rising disposable income of the people plays an important role in raising the demand for supermarkets. Some of the major retailers that supply fresh food items include Reliance Fresh is the driving factor this market.
              • Aditya Birla Retail is the driving factor this market.
              • Food World is the driving factor this market.
              • and Spencer's. Furthermore is the driving factor this market.
              • major retailers such as Walmart have established joint ventures and are planning to expand their presence in emerging economies such as India is the driving factor this market.
              • China is the driving factor this market.
              • and Brazil. Thus is the driving factor this market.
              • the demand for supermarkets is rising in developing countries is the driving factor this market.
              • which is the driving factor this market.
              • in turn is the driving factor this market.
              • will fuel the consumption of ready-to-eat and nutrition-based food items such as seitan. is the driving factor this market.

              The Seitan market vendors should focus on grabbing business opportunities from the Conventional seitan segment as it accounted for the largest market share in the base year.
              RIA - Research AI Assistant
              Ask RIA