Semiconductor Sensors Market Analysis, Size, and Forecast 2025-2029: North America (US and Canada), Europe (France, Germany, and UK), APAC (China, India, Japan, South Korea, and Taiwan), and Rest of World (ROW)

Semiconductor Sensors Market Analysis, Size, and Forecast 2025-2029:
North America (US and Canada), Europe (France, Germany, and UK), APAC (China, India, Japan, South Korea, and Taiwan), and Rest of World (ROW)

Published: May 2025 213 Pages SKU: IRTNTR76764

Market Overview at a Glance

$9.17 B
Market Opportunity
11.3%
CAGR
10.2
YoY growth 2024-2025(%)

Semiconductor Sensors Market Size 2025-2029

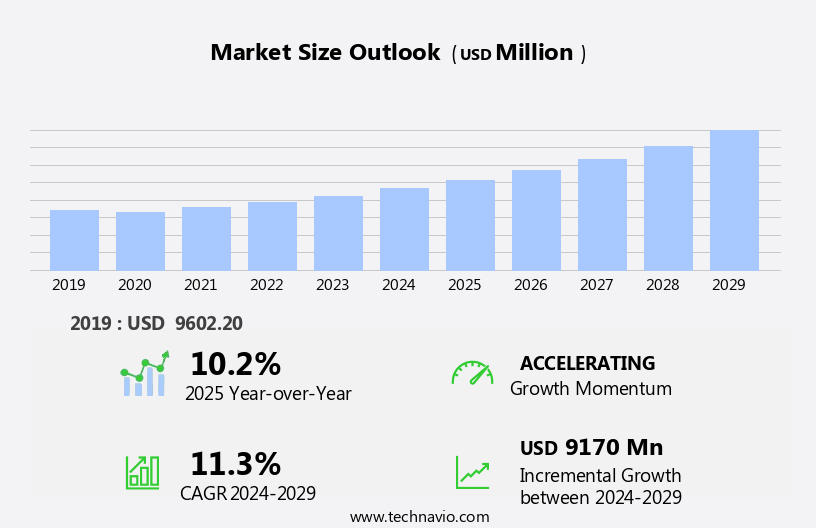
The semiconductor sensors market size is forecast to increase by USD 9.17 billion, at a CAGR of 11.3% between 2024 and 2029.

  • The market is experiencing significant growth, driven primarily by the increasing demand for smart devices. The proliferation of Internet of Things (IoT) technology and the integration of sensors in various applications, from automotive to healthcare, fuel this trend. Technological advancements in semiconductor sensor technology further boost market growth, enabling smaller, more efficient, and cost-effective sensors. However, the semiconductor industry faces challenges, including the impact of trade wars on global supply chains and component pricing.
  • Geopolitical tensions can lead to tariffs and import/export restrictions, disrupting the flow of raw materials and finished goods. Companies must navigate these challenges by diversifying their supply chains, investing in local manufacturing, and building strategic partnerships to mitigate risks and maintain competitiveness.

What will be the Size of the Semiconductor Sensors Market during the forecast period?

Semiconductor Sensors Market Size

Explore in-depth regional segment analysis with market size data - historical 2019-2023 and forecasts 2025-2029 - in the full report.  
Request Free Sample

The market continues to evolve, driven by advancements in wireless communication, embedded systems, and packaging technologies. These innovations enable new applications across various sectors, including defense, healthcare monitoring, precision agriculture, aerospace, environmental sensing, and automotive. Wireless communication plays a crucial role in enabling real-time data acquisition and transfer, while embedded systems facilitate the integration of sensors into various devices. Packaging technologies ensure the durability and reliability of sensors in harsh environments. Optical sensors, pressure sensors, temperature sensors, and flow sensors are among the various types of sensors that find applications in these sectors. Calibration methods, signal processing, and data analytics are essential for ensuring accurate and reliable sensor performance.

Defense applications require sensors with high environmental robustness and operating temperature range. Healthcare monitoring demands sensors with low power consumption and miniaturization. Precision agriculture requires sensors that can detect humidity and temperature levels in soil. Aerospace applications necessitate sensors with high response time and chemical sensing capabilities. Environmental sensing requires sensors that can detect gas levels and noise reduction. Automotive applications require sensors that can withstand high temperatures and provide real-time data. Semiconductor materials, etching techniques, and interface protocols are among the ongoing research areas that aim to improve sensor performance and reduce power consumption. Machine learning and artificial intelligence are also being integrated into sensors to enhance data processing and analysis capabilities.

In summary, the market is characterized by continuous innovation and evolving patterns, driven by advancements in wireless communication, embedded systems, and packaging technologies. These innovations enable new applications across various sectors, from defense and healthcare to agriculture and automotive. The market's dynamism is reflected in ongoing research in areas such as semiconductor materials, etching techniques, and artificial intelligence.

How is this Semiconductor Sensors Industry segmented?

The semiconductor sensors industry research report provides comprehensive data (region-wise segment analysis), with forecasts and estimates in "USD million" for the period 2025-2029, as well as historical data from 2019-2023 for the following segments.

  • Product Type
    • Temperature Sensor
    • Pressure Sensor
    • Humidity sensor
    • Others
  • Type
    • Wireless
    • Wired
  • Application
    • Consumer electronics
    • Automotive
    • Industrial
    • Others
  • Technology
    • MEMS
    • CMOS
    • Optical Sensors
    • Others
  • Geography
    • North America
      • US
      • Canada
    • Europe
      • France
      • Germany
      • UK
    • APAC
      • China
      • India
      • Japan
      • South Korea
      • Taiwan
    • Rest of World (ROW)

By Product Type Insights

The temperature sensor segment is estimated to witness significant growth during the forecast period.

The market is witnessing significant advancements, with various entities playing pivotal roles in shaping its dynamics. Temperature sensors, a crucial segment, are experiencing robust growth due to their application in industries such as automotive, consumer electronics, industrial automation, and healthcare. These sensors are vital for monitoring and managing thermal conditions in systems requiring precision and reliability. Recent innovations in sensor miniaturization and digital interface integration, including I2C, SPI, and SMBus, have expanded their usage in compact and power-sensitive applications. In automotive systems, temperature sensors are increasingly integrated into battery management systems, engine control units, and cabin climate systems to ensure optimal performance and safety.

The growing trend towards electric vehicles (EVs) is further fueling demand, as thermal regulation is essential for battery longevity and efficiency. Optical sensors, another significant segment, are gaining traction due to their ability to detect light and convert it into electrical signals. They find extensive applications in industries such as industrial automation, consumer electronics, and healthcare monitoring. Cloud connectivity and data analytics are transforming the sensor landscape by enabling real-time data processing and analysis, thereby enhancing system performance and efficiency. Power consumption is a critical concern, leading to the development of power management and energy management solutions. Semiconductor materials, such as silicon, gallium arsenide, and gallium nitride, are driving advancements in sensor fabrication and integration.

Machine learning and artificial intelligence (AI) are being integrated into sensors to improve signal processing, calibration methods, and noise reduction. These technologies are revolutionizing various industries, from industrial automation and consumer electronics to healthcare monitoring and environmental sensing. The market is also witnessing the adoption of MEMS sensors, image sensors, and CMOS sensors, which offer enhanced performance and miniaturization. Pressure sensors, flow sensors, gas sensors, humidity sensors, and chemical sensors are other essential segments catering to diverse applications. Security protocols and packaging technologies are critical considerations to ensure sensor reliability and durability. The market's future growth is expected to be influenced by factors such as operating temperature range, environmental robustness, wireless communication, and defense applications.

Semiconductor Sensors Market Size

Request Free Sample

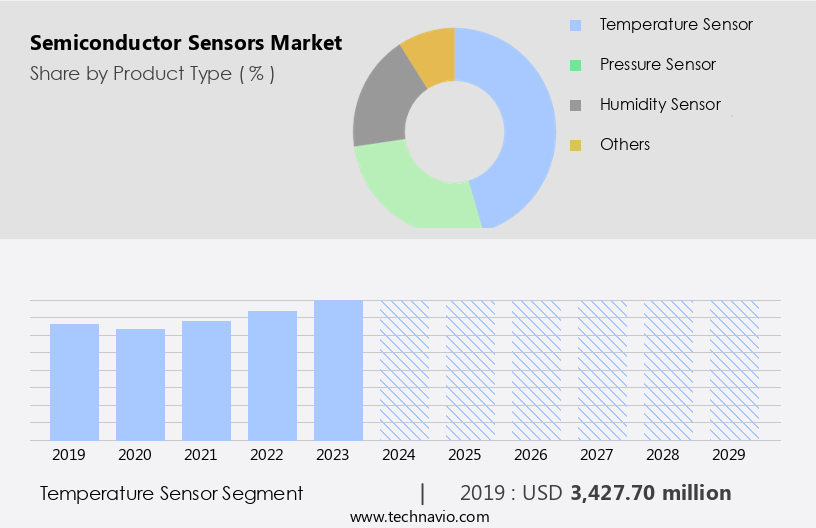
The Temperature Sensor segment was valued at USD 3.43 billion in 2019 and showed a gradual increase during the forecast period.

Regional Analysis

APAC is estimated to contribute 46% to the growth of the global market during the forecast period.Technavio's analysts have elaborately explained the regional trends and drivers that shape the market during the forecast period.

Semiconductor Sensors Market Share by Geography

 Request Free Sample

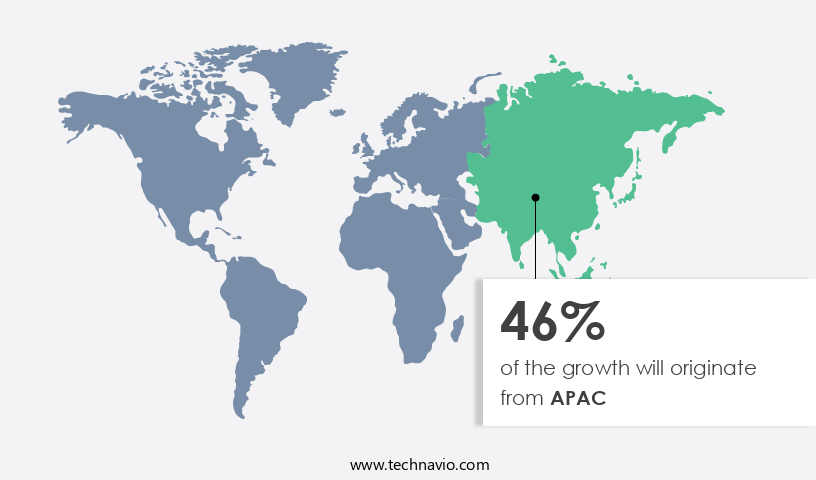
The market in Asia Pacific (APAC), comprising countries like China, Japan, South Korea, India, and Taiwan, is experiencing significant growth. Key drivers include the presence of prominent semiconductor manufacturers, increasing consumer electronics demand, and the integration of advanced technologies such as automation and 5G networks. In May 2025, an HCL-Foxconn joint venture received approval from the Indian Union Cabinet to build a Rs.3,706 crore (approx. USD445 million USD) semiconductor facility in Uttar Pradesh. This plant will produce 36 million display driver chips monthly for various devices, including mobile phones, laptops, and automobiles. APAC's the market is further characterized by advancements in technology, with innovations in areas such as Analog-to-digital conversion (ADC), temperature compensation, optical sensors, industrial automation, interface protocols, proximity sensors, signal processing, calibration methods, thin-film deposition, pressure sensors, data analytics, sensor fabrication, sensor integration, temperature sensors, data acquisition, flow sensors, security protocols, software algorithms, consumer electronics, power consumption, smart cities, operating temperature range, environmental robustness, wireless communication, embedded systems, packaging technologies, defense applications, healthcare monitoring, precision agriculture, aerospace applications, environmental sensing, noise reduction, gas sensors, etching techniques, automotive applications, chemical sensors, semiconductor materials, response time, image sensors, machine learning, power management, humidity sensors, MEMS sensors, CMOS sensors, artificial intelligence (AI), and energy management.

Market Dynamics

Our researchers analyzed the data with 2024 as the base year, along with the key drivers, trends, and challenges. A holistic analysis of drivers will help companies refine their marketing strategies to gain a competitive advantage.

What are the key market drivers leading to the rise in the adoption of Semiconductor Sensors Industry?

  • The surge in consumer preference for intelligent devices serves as the primary catalyst for market growth. 
  • The market is experiencing significant growth due to the increasing integration of technology into everyday life and the expanding Internet of Things (IoT) ecosystem. Semiconductor sensors are integral to the functionality of smart devices, enabling data acquisition for temperature, flow, and other applications. The IoT's ability to connect devices and systems has led to the development of smart homes, cities, and other intelligent environments. Key factors driving the market include the need for real-time data acquisition, energy efficiency, and security protocols. Software algorithms and advanced sensor fabrication techniques have improved sensor performance and reduced power consumption.
  • Consumer electronics, industrial automation, and automotive industries are major end-users of semiconductor sensors. Semiconductor sensors offer environmental robustness and a wide operating temperature range, making them suitable for various applications. The market's future growth is expected to be driven by advancements in sensor integration, miniaturization, and the increasing demand for wearable devices and autonomous vehicles. The market is a dynamic and evolving industry, with continuous innovation and technological advancements shaping its future.

What are the market trends shaping the Semiconductor Sensors Industry?

  • The current market trend reflects a significant focus on technological advancements in semiconductor sensor technology. This sector is poised for growth due to its innovative capabilities and potential applications.
  • The market has witnessed significant growth in recent times, fueled by the expanding use of wireless communication in various sectors and the integration of sensors in embedded systems. The adoption of advanced packaging technologies, defense applications, healthcare monitoring, precision agriculture, aerospace, environmental sensing, and noise reduction are key market drivers. Gas sensors, particularly those based on etching techniques, have gained prominence due to their high sensitivity and selectivity.
  • The market's growth is further propelled by the increasing demand for semiconductor sensors in automotive applications, including advanced driver assistance systems and electric vehicles. Despite the challenges of supply shortages and price increases due to high demand, the market continues to evolve, offering opportunities for innovation and growth.

What challenges does the Semiconductor Sensors Industry face during its growth?

  • The semiconductor industry faces significant challenges to its growth due to the impact of trade wars. This geopolitical issue poses a major threat to the industry's expansion, requiring close attention and strategic adaptation from industry professionals. 
  • The market is experiencing significant fluctuations due to geopolitical tensions, particularly the trade war between major global players. This conflict has resulted in tariffs and restrictions on various goods, including semiconductor materials and electronic components. The increased cost of these materials has led to a rise in the average selling price (ASP) of semiconductor sensors, affecting demand in both the US and China. This imbalance between supply and demand could hinder the growth plans of semiconductor manufacturers, potentially reducing the market's expansion during the forecast period. Semiconductor sensors play a crucial role in various industries, including chemical sensing, image sensing, and humidity detection, among others.
  • Technological advancements in machine learning and artificial intelligence (AI) are driving innovation in this sector, with applications in power management and energy efficiency. MEMS (Micro-Electro-Mechanical Systems) and CMOS (Complementary Metal-Oxide-Semiconductor) sensors are gaining popularity due to their high sensitivity, low power consumption, and compact size. However, the escalating trade tensions pose a challenge to the market's growth trajectory. Semiconductor sensors are integral to numerous applications, including healthcare, automotive, industrial, and consumer electronics. The market's dynamics are influenced by factors such as response time, power management, and miniaturization. Despite the current challenges, the long-term outlook remains positive, with continued advancements in technology and increasing demand for energy-efficient and cost-effective sensors.

Exclusive Customer Landscape

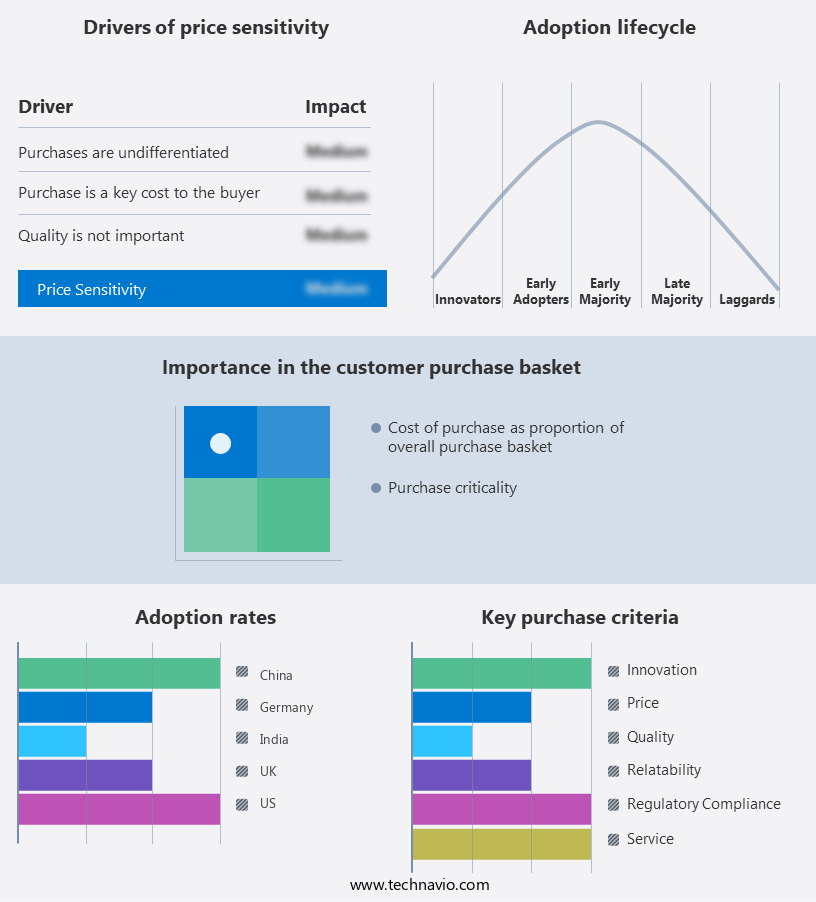
The semiconductor sensors market forecasting report includes the adoption lifecycle of the market, covering from the innovator's stage to the laggard's stage. It focuses on adoption rates in different regions based on penetration. Furthermore, the semiconductor sensors market report also includes key purchase criteria and drivers of price sensitivity to help companies evaluate and develop their market growth analysis strategies.

Semiconductor Sensors Market Share by Geography

 Customer Landscape

Key Companies & Market Insights

Companies are implementing various strategies, such as strategic alliances, semiconductor sensors market forecast, partnerships, mergers and acquisitions, geographical expansion, and product/service launches, to enhance their presence in the industry.

Eaton Corp. plc - This company specializes in semiconductor sensor technology, featuring the innovative EVT Series VoltageWatch voltage sensors and VoltageWatch sensors. These advanced products monitor and detect voltage levels with precision, contributing significantly to the global market for semiconductor sensors.

The industry research and growth report includes detailed analyses of the competitive landscape of the market and information about key companies, including:

  • Eaton Corp. plc
  • Fuji Electric Co. Ltd.
  • Infineon Technologies AG
  • Littelfuse Inc.
  • Mitsubishi Electric Corp.
  • Nexperia BV
  • NXP Semiconductors NV
  • ON Semiconductor Corp.
  • Renesas Electronics Corp.
  • Robert Bosch GmbH
  • Samsung Electronics Co. Ltd.
  • Sony Group Corp.
  • STMicroelectronics NV
  • Taiwan Semiconductor Manufacturing Co. Ltd.
  • Texas Instruments Inc.
  • Toshiba Corp.
  • Vishay Intertechnology Inc.

Qualitative and quantitative analysis of companies has been conducted to help clients understand the wider business environment as well as the strengths and weaknesses of key industry players. Data is qualitatively analyzed to categorize companies as pure play, category-focused, industry-focused, and diversified; it is quantitatively analyzed to categorize companies as dominant, leading, strong, tentative, and weak.

Recent Development and News in Semiconductor Sensors Market

  • In January 2024, Infineon Technologies AG, a leading semiconductor manufacturer, announced the launch of its new RaspiSense™ sensor platform, integrating microcontrollers and sensors for Internet of Things (IoT) applications (Infineon press release, 2024). This development marks Infineon's expansion into the IoT sensor market, aiming to provide comprehensive solutions for smart home and industrial automation.
  • In March 2024, STMicroelectronics and Bosch Sensortec, two major semiconductor sensor players, announced a strategic collaboration to develop and manufacture MEMS microphones for automotive and consumer applications (STMicroelectronics press release, 2024). This partnership combines STMicroelectronics' semiconductor expertise with Bosch Sensortec's sensor technology, targeting the growing demand for voice-activated devices and advanced driver assistance systems.
  • In May 2024, ON Semiconductor Corporation completed the acquisition of Fujitsu Semiconductor Limited's 200mm wafer fabrication facility in Aizu, Japan (ON Semiconductor press release, 2024). This strategic move enables ON Semiconductor to expand its manufacturing capacity for image sensors and other semiconductor products, addressing the increasing demand for advanced sensors in various industries.
  • In April 2025, Texas Instruments Incorporated unveiled its new MSP432P401R microcontroller, featuring a built-in sensor fusion engine and improved power management capabilities (Texas Instruments press release, 2025). This technological advancement enables more efficient and accurate sensor data processing for IoT and industrial applications, positioning Texas Instruments as a key player in the semiconductor sensor market.

Research Analyst Overview

  • The market encompasses various types of sensors, including optical fiber sensors, electrochemical sensors, piezoresistive sensors, capacitive sensors, inductive sensors, thermoelectric sensors, and quantum sensors. One notable trend is the integration of system-on-a-chip (SOC) technology, which enables advanced functionalities and cost reduction. Testing and validation plays a crucial role in ensuring sensor quality and compliance with technical documentation and industry standards. Intellectual property protection is another key consideration, as companies strive to differentiate their offerings through innovation. Multi-sensor fusion and product lifecycle management are essential strategies for optimizing sales channels and meeting customer demands. Cost reduction and low-power design are also critical factors, as sensors increasingly permeate various industries, from automotive to healthcare.
  • Supply chain management and standards compliance are essential for maintaining a competitive edge, as companies navigate the complexities of manufacturing, logistics, and regulatory requirements. Customer support and after-sales services are also vital for building long-term relationships and fostering repeat business. Sensor arrays and pricing strategies are other areas of focus, as companies seek to offer comprehensive solutions and maximize revenue while maintaining profitability. Overall, the market is characterized by continuous innovation, intense competition, and evolving customer needs.

Dive into Technavio's robust research methodology, blending expert interviews, extensive data synthesis, and validated models for unparalleled Semiconductor Sensors Market insights. See full methodology.

Market Scope

Report Coverage

Details

Page number

213

Base year

2024

Historic period

2019-2023

Forecast period

2025-2029

Growth momentum & CAGR

Accelerate at a CAGR of 11.3%

Market growth 2025-2029

USD 9170 million

Market structure

Fragmented

YoY growth 2024-2025(%)

10.2

Key countries

US, China, Japan, UK, South Korea, India, Germany, France, Taiwan, and Canada

Competitive landscape

Leading Companies, Market Positioning of Companies, Competitive Strategies, and Industry Risks

Request Free Sample

What are the Key Data Covered in this Semiconductor Sensors Market Research and Growth Report?

  • CAGR of the Semiconductor Sensors industry during the forecast period
  • Detailed information on factors that will drive the growth and forecasting between 2025 and 2029
  • Precise estimation of the size of the market and its contribution of the industry in focus to the parent market
  • Accurate predictions about upcoming growth and trends and changes in consumer behaviour
  • Growth of the market across APAC, Europe, North America, South America, and Middle East and Africa
  • Thorough analysis of the market's competitive landscape and detailed information about companies
  • Comprehensive analysis of factors that will challenge the semiconductor sensors market growth of industry companies

We can help! Our analysts can customize this semiconductor sensors market research report to meet your requirements.

Get in touch

1 Executive Summary

  • 1.1 Market overview
    • Executive Summary - Chart on Market Overview
    • Executive Summary - Data Table on Market Overview
    • Executive Summary - Chart on Global Market Characteristics
    • Executive Summary - Chart on Market by Geography
    • Executive Summary - Chart on Market Segmentation by Product Type
    • Executive Summary - Chart on Market Segmentation by Type
    • Executive Summary - Chart on Market Segmentation by Application
    • Executive Summary - Chart on Incremental Growth
    • Executive Summary - Data Table on Incremental Growth
    • Executive Summary - Chart on Company Market Positioning

2 Technavio Analysis

  • 2.1 Analysis of price sensitivity, lifecycle, customer purchase basket, adoption rates, and purchase criteria
    • Analysis of price sensitivity, lifecycle, customer purchase basket, adoption rates, and purchase criteria
  • 2.2 Criticality of inputs and Factors of differentiation
    • Overview on criticality of inputs and factors of differentiation
  • 2.3 Factors of disruption
    • Overview on factors of disruption
  • 2.4 Impact of drivers and challenges
    • Impact of drivers and challenges in 2024 and 2029

3 Market Landscape

  • 3.1 Market ecosystem
    • Parent Market
    • Data Table on - Parent Market
  • 3.2 Market characteristics
    • Market characteristics analysis
  • 3.3 Value chain analysis
    • Value chain analysis

4 Market Sizing

  • 4.1 Market definition
    • Offerings of companies included in the market definition
  • 4.2 Market segment analysis
    • Market segments
  • 4.3 Market size 2024
    • 4.4 Market outlook: Forecast for 2024-2029
      • Chart on Global - Market size and forecast 2024-2029 ($ million)
      • Data Table on Global - Market size and forecast 2024-2029 ($ million)
      • Chart on Global Market: Year-over-year growth 2024-2029 (%)
      • Data Table on Global Market: Year-over-year growth 2024-2029 (%)

    5 Historic Market Size

    • 5.1 Global Semiconductor Sensors Market 2019 - 2023
      • Historic Market Size - Data Table on Global Semiconductor Sensors Market 2019 - 2023 ($ million)
    • 5.2 Product Type segment analysis 2019 - 2023
      • Historic Market Size - Product Type Segment 2019 - 2023 ($ million)
    • 5.3 Type segment analysis 2019 - 2023
      • Historic Market Size - Type Segment 2019 - 2023 ($ million)
    • 5.4 Application segment analysis 2019 - 2023
      • Historic Market Size - Application Segment 2019 - 2023 ($ million)
    • 5.5 Geography segment analysis 2019 - 2023
      • Historic Market Size - Geography Segment 2019 - 2023 ($ million)
    • 5.6 Country segment analysis 2019 - 2023
      • Historic Market Size - Country Segment 2019 - 2023 ($ million)

    6 Qualitative Analysis

    • 6.1 The impact of AI in the global semiconductor sensors market

      7 Five Forces Analysis

      • 7.1 Five forces summary
        • Five forces analysis - Comparison between 2024 and 2029
      • 7.2 Bargaining power of buyers
        • Bargaining power of buyers - Impact of key factors 2024 and 2029
      • 7.3 Bargaining power of suppliers
        • Bargaining power of suppliers - Impact of key factors in 2024 and 2029
      • 7.4 Threat of new entrants
        • Threat of new entrants - Impact of key factors in 2024 and 2029
      • 7.5 Threat of substitutes
        • Threat of substitutes - Impact of key factors in 2024 and 2029
      • 7.6 Threat of rivalry
        • Threat of rivalry - Impact of key factors in 2024 and 2029
      • 7.7 Market condition
        • Chart on Market condition - Five forces 2024 and 2029

      8 Market Segmentation by Product Type

      • 8.1 Market segments
        • Chart on Product Type - Market share (2024-2029) (%)
        • Data Table on Product Type - Market share (2024-2029) (%)
      • 8.2 Comparison by Product Type
        • Chart on Comparison by Product Type
        • Data Table on Comparison by Product Type
      • 8.3 Temperature Sensor - Market size and forecast (2024-2029)
        • Chart on Temperature Sensor - Market size and forecast (2024-2029) ($ million)
        • Data Table on Temperature Sensor - Market size and forecast (2024-2029) ($ million)
        • Chart on Temperature Sensor - Year-over-year growth (2024-2029) (%)
        • Data Table on Temperature Sensor - Year-over-year growth (2024-2029) (%)
      • 8.4 Pressure Sensor - Market size and forecast (2024-2029)
        • Chart on Pressure Sensor - Market size and forecast (2024-2029) ($ million)
        • Data Table on Pressure Sensor - Market size and forecast (2024-2029) ($ million)
        • Chart on Pressure Sensor - Year-over-year growth (2024-2029) (%)
        • Data Table on Pressure Sensor - Year-over-year growth (2024-2029) (%)
      • 8.5 Humidity sensor - Market size and forecast (2024-2029)
        • Chart on Humidity sensor - Market size and forecast (2024-2029) ($ million)
        • Data Table on Humidity sensor - Market size and forecast (2024-2029) ($ million)
        • Chart on Humidity sensor - Year-over-year growth (2024-2029) (%)
        • Data Table on Humidity sensor - Year-over-year growth (2024-2029) (%)
      • 8.6 Others - Market size and forecast (2024-2029)
        • Chart on Others - Market size and forecast (2024-2029) ($ million)
        • Data Table on Others - Market size and forecast (2024-2029) ($ million)
        • Chart on Others - Year-over-year growth (2024-2029) (%)
        • Data Table on Others - Year-over-year growth (2024-2029) (%)
      • 8.7 Market opportunity by Product Type
        • Market opportunity by Product Type ($ million)
        • Data Table on Market opportunity by Product Type ($ million)

      9 Market Segmentation by Type

      • 9.1 Market segments
        • Chart on Type - Market share (2024-2029) (%)
        • Data Table on Type - Market share (2024-2029) (%)
      • 9.2 Comparison by Type
        • Chart on Comparison by Type
        • Data Table on Comparison by Type
      • 9.3 Wireless - Market size and forecast (2024-2029)
        • Chart on Wireless - Market size and forecast (2024-2029) ($ million)
        • Data Table on Wireless - Market size and forecast (2024-2029) ($ million)
        • Chart on Wireless - Year-over-year growth (2024-2029) (%)
        • Data Table on Wireless - Year-over-year growth (2024-2029) (%)
      • 9.4 Wired - Market size and forecast (2024-2029)
        • Chart on Wired - Market size and forecast (2024-2029) ($ million)
        • Data Table on Wired - Market size and forecast (2024-2029) ($ million)
        • Chart on Wired - Year-over-year growth (2024-2029) (%)
        • Data Table on Wired - Year-over-year growth (2024-2029) (%)
      • 9.5 Market opportunity by Type
        • Market opportunity by Type ($ million)
        • Data Table on Market opportunity by Type ($ million)

      10 Market Segmentation by Application

      • 10.1 Market segments
        • Chart on Application - Market share (2024-2029) (%)
        • Data Table on Application - Market share (2024-2029) (%)
      • 10.2 Comparison by Application
        • Chart on Comparison by Application
        • Data Table on Comparison by Application
      • 10.3 Consumer electronics - Market size and forecast (2024-2029)
        • Chart on Consumer electronics - Market size and forecast (2024-2029) ($ million)
        • Data Table on Consumer electronics - Market size and forecast (2024-2029) ($ million)
        • Chart on Consumer electronics - Year-over-year growth (2024-2029) (%)
        • Data Table on Consumer electronics - Year-over-year growth (2024-2029) (%)
      • 10.4 Automotive - Market size and forecast (2024-2029)
        • Chart on Automotive - Market size and forecast (2024-2029) ($ million)
        • Data Table on Automotive - Market size and forecast (2024-2029) ($ million)
        • Chart on Automotive - Year-over-year growth (2024-2029) (%)
        • Data Table on Automotive - Year-over-year growth (2024-2029) (%)
      • 10.5 Industrial - Market size and forecast (2024-2029)
        • Chart on Industrial - Market size and forecast (2024-2029) ($ million)
        • Data Table on Industrial - Market size and forecast (2024-2029) ($ million)
        • Chart on Industrial - Year-over-year growth (2024-2029) (%)
        • Data Table on Industrial - Year-over-year growth (2024-2029) (%)
      • 10.6 Others - Market size and forecast (2024-2029)
        • Chart on Others - Market size and forecast (2024-2029) ($ million)
        • Data Table on Others - Market size and forecast (2024-2029) ($ million)
        • Chart on Others - Year-over-year growth (2024-2029) (%)
        • Data Table on Others - Year-over-year growth (2024-2029) (%)
      • 10.7 Market opportunity by Application
        • Market opportunity by Application ($ million)
        • Data Table on Market opportunity by Application ($ million)

      11 Market Segmentation by Technology

      • 11.1 Market segments
        • Chart on Technology - Market share (2024-2029) (%)
        • Data Table on Technology - Market share (2024-2029) (%)
      • 11.2 Comparison by Technology
        • Chart on Comparison by Technology
        • Data Table on Comparison by Technology
      • 11.3 MEMS - Market size and forecast (2024-2029)
        • Chart on MEMS - Market size and forecast (2024-2029) ($ million)
        • Data Table on MEMS - Market size and forecast (2024-2029) ($ million)
        • Chart on MEMS - Year-over-year growth (2024-2029) (%)
        • Data Table on MEMS - Year-over-year growth (2024-2029) (%)
      • 11.4 CMOS - Market size and forecast (2024-2029)
        • Chart on CMOS - Market size and forecast (2024-2029) ($ million)
        • Data Table on CMOS - Market size and forecast (2024-2029) ($ million)
        • Chart on CMOS - Year-over-year growth (2024-2029) (%)
        • Data Table on CMOS - Year-over-year growth (2024-2029) (%)
      • 11.5 Optical Sensors - Market size and forecast (2024-2029)
        • Chart on Optical Sensors - Market size and forecast (2024-2029) ($ million)
        • Data Table on Optical Sensors - Market size and forecast (2024-2029) ($ million)
        • Chart on Optical Sensors - Year-over-year growth (2024-2029) (%)
        • Data Table on Optical Sensors - Year-over-year growth (2024-2029) (%)
      • 11.6 Others - Market size and forecast (2024-2029)
        • Chart on Others - Market size and forecast (2024-2029) ($ million)
        • Data Table on Others - Market size and forecast (2024-2029) ($ million)
        • Chart on Others - Year-over-year growth (2024-2029) (%)
        • Data Table on Others - Year-over-year growth (2024-2029) (%)
      • 11.7 Market opportunity by Technology
        • Market opportunity by Technology ($ million)
        • Data Table on Market opportunity by Technology ($ million)

      12 Customer Landscape

      • 12.1 Customer landscape overview
        • Analysis of price sensitivity, lifecycle, customer purchase basket, adoption rates, and purchase criteria

      13 Geographic Landscape

      • 13.1 Geographic segmentation
        • Chart on Market share by geography 2024-2029 (%)
        • Data Table on Market share by geography 2024-2029 (%)
      • 13.2 Geographic comparison
        • Chart on Geographic comparison
        • Data Table on Geographic comparison
      • 13.3 APAC - Market size and forecast 2024-2029
        • Chart on APAC - Market size and forecast 2024-2029 ($ million)
        • Data Table on APAC - Market size and forecast 2024-2029 ($ million)
        • Chart on APAC - Year-over-year growth 2024-2029 (%)
        • Data Table on APAC - Year-over-year growth 2024-2029 (%)
      • 13.4 Europe - Market size and forecast 2024-2029
        • Chart on Europe - Market size and forecast 2024-2029 ($ million)
        • Data Table on Europe - Market size and forecast 2024-2029 ($ million)
        • Chart on Europe - Year-over-year growth 2024-2029 (%)
        • Data Table on Europe - Year-over-year growth 2024-2029 (%)
      • 13.5 North America - Market size and forecast 2024-2029
        • Chart on North America - Market size and forecast 2024-2029 ($ million)
        • Data Table on North America - Market size and forecast 2024-2029 ($ million)
        • Chart on North America - Year-over-year growth 2024-2029 (%)
        • Data Table on North America - Year-over-year growth 2024-2029 (%)
      • 13.6 South America - Market size and forecast 2024-2029
        • Chart on South America - Market size and forecast 2024-2029 ($ million)
        • Data Table on South America - Market size and forecast 2024-2029 ($ million)
        • Chart on South America - Year-over-year growth 2024-2029 (%)
        • Data Table on South America - Year-over-year growth 2024-2029 (%)
      • 13.7 Middle East and Africa - Market size and forecast 2024-2029
        • Chart on Middle East and Africa - Market size and forecast 2024-2029 ($ million)
        • Data Table on Middle East and Africa - Market size and forecast 2024-2029 ($ million)
        • Chart on Middle East and Africa - Year-over-year growth 2024-2029 (%)
        • Data Table on Middle East and Africa - Year-over-year growth 2024-2029 (%)
      • 13.8 US - Market size and forecast 2024-2029
        • Chart on US - Market size and forecast 2024-2029 ($ million)
        • Data Table on US - Market size and forecast 2024-2029 ($ million)
        • Chart on US - Year-over-year growth 2024-2029 (%)
        • Data Table on US - Year-over-year growth 2024-2029 (%)
      • 13.9 China - Market size and forecast 2024-2029
        • Chart on China - Market size and forecast 2024-2029 ($ million)
        • Data Table on China - Market size and forecast 2024-2029 ($ million)
        • Chart on China - Year-over-year growth 2024-2029 (%)
        • Data Table on China - Year-over-year growth 2024-2029 (%)
      • 13.10 Japan - Market size and forecast 2024-2029
        • Chart on Japan - Market size and forecast 2024-2029 ($ million)
        • Data Table on Japan - Market size and forecast 2024-2029 ($ million)
        • Chart on Japan - Year-over-year growth 2024-2029 (%)
        • Data Table on Japan - Year-over-year growth 2024-2029 (%)
      • 13.11 South Korea - Market size and forecast 2024-2029
        • Chart on South Korea - Market size and forecast 2024-2029 ($ million)
        • Data Table on South Korea - Market size and forecast 2024-2029 ($ million)
        • Chart on South Korea - Year-over-year growth 2024-2029 (%)
        • Data Table on South Korea - Year-over-year growth 2024-2029 (%)
      • 13.12 India - Market size and forecast 2024-2029
        • Chart on India - Market size and forecast 2024-2029 ($ million)
        • Data Table on India - Market size and forecast 2024-2029 ($ million)
        • Chart on India - Year-over-year growth 2024-2029 (%)
        • Data Table on India - Year-over-year growth 2024-2029 (%)
      • 13.13 UK - Market size and forecast 2024-2029
        • Chart on UK - Market size and forecast 2024-2029 ($ million)
        • Data Table on UK - Market size and forecast 2024-2029 ($ million)
        • Chart on UK - Year-over-year growth 2024-2029 (%)
        • Data Table on UK - Year-over-year growth 2024-2029 (%)
      • 13.14 Germany - Market size and forecast 2024-2029
        • Chart on Germany - Market size and forecast 2024-2029 ($ million)
        • Data Table on Germany - Market size and forecast 2024-2029 ($ million)
        • Chart on Germany - Year-over-year growth 2024-2029 (%)
        • Data Table on Germany - Year-over-year growth 2024-2029 (%)
      • 13.15 France - Market size and forecast 2024-2029
        • Chart on France - Market size and forecast 2024-2029 ($ million)
        • Data Table on France - Market size and forecast 2024-2029 ($ million)
        • Chart on France - Year-over-year growth 2024-2029 (%)
        • Data Table on France - Year-over-year growth 2024-2029 (%)
      • 13.16 Canada - Market size and forecast 2024-2029
        • Chart on Canada - Market size and forecast 2024-2029 ($ million)
        • Data Table on Canada - Market size and forecast 2024-2029 ($ million)
        • Chart on Canada - Year-over-year growth 2024-2029 (%)
        • Data Table on Canada - Year-over-year growth 2024-2029 (%)
      • 13.17 Taiwan - Market size and forecast 2024-2029
        • Chart on Taiwan - Market size and forecast 2024-2029 ($ million)
        • Data Table on Taiwan - Market size and forecast 2024-2029 ($ million)
        • Chart on Taiwan - Year-over-year growth 2024-2029 (%)
        • Data Table on Taiwan - Year-over-year growth 2024-2029 (%)
      • 13.18 Market opportunity by geography
        • Market opportunity by geography ($ million)
        • Data Tables on Market opportunity by geography ($ million)
      • 13.19 Rest of World (ROW) - Market size and forecast (2024-2029)
        • Chart on Rest of World (ROW) - Market size and forecast (2024-2029) ($ million)
        • Data Table on Rest of World (ROW) - Market size and forecast (2024-2029) ($ million)
        • Chart on Rest of World (ROW) - Year-over-year growth (2024-2029) (%)
        • Data Table on Rest of World (ROW) - Year-over-year growth (2024-2029) (%)

      14 Drivers, Challenges, and Opportunity/Restraints

      • 14.1 Market drivers
        • 14.2 Market challenges
          • 14.3 Impact of drivers and challenges
            • Impact of drivers and challenges in 2024 and 2029
          • 14.4 Market opportunities/restraints

            15 Competitive Landscape

            • 15.1 Overview
              • 15.2 Competitive Landscape
                • Overview on criticality of inputs and factors of differentiation
              • 15.3 Landscape disruption
                • Overview on factors of disruption
              • 15.4 Industry risks
                • Impact of key risks on business

              16 Competitive Analysis

              • 16.1 Companies profiled
                • Companies covered
              • 16.2 Company ranking index
                • Company ranking index
              • 16.3 Market positioning of companies
                • Matrix on companies position and classification
              • 16.4 Eaton Corp. plc
                • Eaton Corp. plc - Overview
                • Eaton Corp. plc - Business segments
                • Eaton Corp. plc - Key news
                • Eaton Corp. plc - Key offerings
                • Eaton Corp. plc - Segment focus
                • SWOT
              • 16.5 Fuji Electric Co. Ltd.
                • Fuji Electric Co. Ltd. - Overview
                • Fuji Electric Co. Ltd. - Business segments
                • Fuji Electric Co. Ltd. - Key news
                • Fuji Electric Co. Ltd. - Key offerings
                • Fuji Electric Co. Ltd. - Segment focus
                • SWOT
              • 16.6 Infineon Technologies AG
                • Infineon Technologies AG - Overview
                • Infineon Technologies AG - Business segments
                • Infineon Technologies AG - Key news
                • Infineon Technologies AG - Key offerings
                • Infineon Technologies AG - Segment focus
                • SWOT
              • 16.7 Littelfuse Inc.
                • Littelfuse Inc. - Overview
                • Littelfuse Inc. - Business segments
                • Littelfuse Inc. - Key news
                • Littelfuse Inc. - Key offerings
                • Littelfuse Inc. - Segment focus
                • SWOT
              • 16.8 Mitsubishi Electric Corp.
                • Mitsubishi Electric Corp. - Overview
                • Mitsubishi Electric Corp. - Business segments
                • Mitsubishi Electric Corp. - Key offerings
                • Mitsubishi Electric Corp. - Segment focus
                • SWOT
              • 16.9 Nexperia BV
                • Nexperia BV - Overview
                • Nexperia BV - Product / Service
                • Nexperia BV - Key offerings
                • SWOT
              • 16.10 NXP Semiconductors NV
                • NXP Semiconductors NV - Overview
                • NXP Semiconductors NV - Product / Service
                • NXP Semiconductors NV - Key offerings
                • SWOT
              • 16.11 ON Semiconductor Corp.
                • ON Semiconductor Corp. - Overview
                • ON Semiconductor Corp. - Business segments
                • ON Semiconductor Corp. - Key news
                • ON Semiconductor Corp. - Key offerings
                • ON Semiconductor Corp. - Segment focus
                • SWOT
              • 16.12 Renesas Electronics Corp.
                • Renesas Electronics Corp. - Overview
                • Renesas Electronics Corp. - Business segments
                • Renesas Electronics Corp. - Key news
                • Renesas Electronics Corp. - Key offerings
                • Renesas Electronics Corp. - Segment focus
                • SWOT
              • 16.13 Robert Bosch GmbH
                • Robert Bosch GmbH - Overview
                • Robert Bosch GmbH - Product / Service
                • Robert Bosch GmbH - Key news
                • Robert Bosch GmbH - Key offerings
                • SWOT
              • 16.14 Samsung Electronics Co. Ltd.
                • Samsung Electronics Co. Ltd. - Overview
                • Samsung Electronics Co. Ltd. - Business segments
                • Samsung Electronics Co. Ltd. - Key news
                • Samsung Electronics Co. Ltd. - Key offerings
                • Samsung Electronics Co. Ltd. - Segment focus
                • SWOT
              • 16.15 Sony Group Corp.
                • Sony Group Corp. - Overview
                • Sony Group Corp. - Business segments
                • Sony Group Corp. - Key offerings
                • Sony Group Corp. - Segment focus
                • SWOT
              • 16.16 STMicroelectronics NV
                • STMicroelectronics NV - Overview
                • STMicroelectronics NV - Business segments
                • STMicroelectronics NV - Key news
                • STMicroelectronics NV - Key offerings
                • STMicroelectronics NV - Segment focus
                • SWOT
              • 16.17 Taiwan Semiconductor Manufacturing Co. Ltd.
                • Taiwan Semiconductor Manufacturing Co. Ltd. - Overview
                • Taiwan Semiconductor Manufacturing Co. Ltd. - Product / Service
                • Taiwan Semiconductor Manufacturing Co. Ltd. - Key news
                • Taiwan Semiconductor Manufacturing Co. Ltd. - Key offerings
                • SWOT
              • 16.18 Texas Instruments Inc.
                • Texas Instruments Inc. - Overview
                • Texas Instruments Inc. - Business segments
                • Texas Instruments Inc. - Key offerings
                • Texas Instruments Inc. - Segment focus
                • SWOT

              17 Appendix

              • 17.1 Scope of the report
                • 17.2 Inclusions and exclusions checklist
                  • Inclusions checklist
                  • Exclusions checklist
                • 17.3 Currency conversion rates for US$
                  • Currency conversion rates for US$
                • 17.4 Research methodology
                  • Research methodology
                • 17.5 Data procurement
                  • Information sources
                • 17.6 Data validation
                  • Data validation
                • 17.7 Validation techniques employed for market sizing
                  • Validation techniques employed for market sizing
                • 17.8 Data synthesis
                  • Data synthesis
                • 17.9 360 degree market analysis
                  • 360 degree market analysis
                • 17.10 List of abbreviations
                  • List of abbreviations

                Research Methodology

                Technavio presents a detailed picture of the market by way of study, synthesis, and summation of data from multiple sources. The analysts have presented the various facets of the market with a particular focus on identifying the key industry influencers. The data thus presented is comprehensive, reliable, and the result of extensive research, both primary and secondary.

                INFORMATION SOURCES

                Primary sources

                • Manufacturers and suppliers
                • Channel partners
                • Industry experts
                • Strategic decision makers

                Secondary sources

                • Industry journals and periodicals
                • Government data
                • Financial reports of key industry players
                • Historical data
                • Press releases

                DATA ANALYSIS

                Data Synthesis

                • Collation of data
                • Estimation of key figures
                • Analysis of derived insights

                Data Validation

                • Triangulation with data models
                • Reference against proprietary databases
                • Corroboration with industry experts

                REPORT WRITING

                Qualitative

                • Market drivers
                • Market challenges
                • Market trends
                • Five forces analysis

                Quantitative

                • Market size and forecast
                • Market segmentation
                • Geographical insights
                • Competitive landscape

                Interested in this report?

                Get your sample now to see our research methodology and insights!

                Download Now

                Frequently Asked Questions

                Semiconductor Sensors market growth will increase by $ 9170 mn during 2025-2029 .

                The Semiconductor Sensors market is expected to grow at a CAGR of 11.3% during 2025-2029 .

                Semiconductor Sensors market is segmented by Product Type( Temperature Sensor, Pressure Sensor, Humidity sensor, Others) Type( Wireless, Wired, Industrial, Others) Application( Consumer electronics, Automotive, Industrial, Others, Middle East and Africa)

                Eaton Corp. plc, Fuji Electric Co. Ltd., Infineon Technologies AG, Littelfuse Inc., Mitsubishi Electric Corp., Nexperia BV, NXP Semiconductors NV, ON Semiconductor Corp., Renesas Electronics Corp., Robert Bosch GmbH, Samsung Electronics Co. Ltd., Sony Group Corp., STMicroelectronics NV, Taiwan Semiconductor Manufacturing Co. Ltd., Texas Instruments Inc., Toshiba Corp., Vishay Intertechnology Inc. are a few of the key vendors in the Semiconductor Sensors market.

                APAC will register the highest growth rate of 46% among the other regions. Therefore, the Semiconductor Sensors market in APAC is expected to garner significant business opportunities for the vendors during the forecast period.

                US, China, Japan, UK, South Korea, India, Germany, France, Taiwan, Canada

                • Increasing demand for smart devicesThe global semiconductor sensors market is experiencing a surge in demand for smart devices is the driving factor this market.
                • driven by several factors. The increasing integration of technology into various aspects of end-users lives is the driving factor this market.
                • coupled with the growing need for connectivity and intelligent functionalities is the driving factor this market.
                • has fueled the demand for smart devices that incorporate semiconductor sensors. One of the major drivers behind the increased demand for smart devices in the global semiconductor sensors market is the rapid growth of the IoT. The IoT has enabled the connection of various devices and systems is the driving factor this market.
                • allowing them to share data and communicate with each other. This has led to the rise of smart homes is the driving factor this market.
                • smart cities is the driving factor this market.
                • and other intelligent environments where semiconductor sensors play a crucial role. For example is the driving factor this market.
                • smart thermostats use sensors to monitor temperature and occupancy is the driving factor this market.
                • adjusting the heating and cooling accordingly to optimize energy usage. Another factor contributing to the increased demand for smart devices is the need for improved convenience and functionality. Consumers are increasingly looking for devices that can simplify their lives and provide them with personalized experiences. Semiconductor sensors are essential components in devices such as smartphones is the driving factor this market.
                • wearable devices is the driving factor this market.
                • and smart appliances is the driving factor this market.
                • enabling features like touchscreens is the driving factor this market.
                • motion sensing is the driving factor this market.
                • and biometric authentication. For instance is the driving factor this market.
                • smartwatches incorporate various sensors to track heart rate is the driving factor this market.
                • sleep patterns is the driving factor this market.
                • and physical activities is the driving factor this market.
                • providing users with valuable health and fitness insights. The growing awareness of environmental sustainability has also driven the demand for smart devices in the global semiconductor sensors market. Energy-efficient solutions are highly sought after is the driving factor this market.
                • and semiconductor sensors play a crucial role in achieving energy optimization in various applications. For example is the driving factor this market.
                • smart lighting systems use sensors to detect occupancy is the driving factor this market.
                • adjust the brightness accordingly is the driving factor this market.
                • and optimize energy consumption. Thus is the driving factor this market.
                • the abovementioned factors are expected to increase the demand for semiconductor sensors in smart devices is the driving factor this market.
                • which will propel the growth of the market in focus during the forecast period. is the driving factor this market.

                The Semiconductor Sensors market vendors should focus on grabbing business opportunities from the Temperature Sensor segment as it accounted for the largest market share in the base year.