Server San Market Analysis, Size, and Forecast 2024-2028: North America (US and Canada), Europe (France, Germany, Spain, and UK), Middle East and Africa (UAE), APAC (Australia, China, India, and Japan), and Rest of World (ROW)

Server San Market Analysis, Size, and Forecast 2024-2028:
North America (US and Canada), Europe (France, Germany, Spain, and UK), Middle East and Africa (UAE), APAC (Australia, China, India, and Japan), and Rest of World (ROW)

Published: Jul 2024 163 Pages SKU: IRTNTR75847

Market Overview at a Glance

$115.2 B
Market Opportunity
36.51%
CAGR
26.95
YoY growth 2023-2024(%)

Server San Market Size 2024-2028

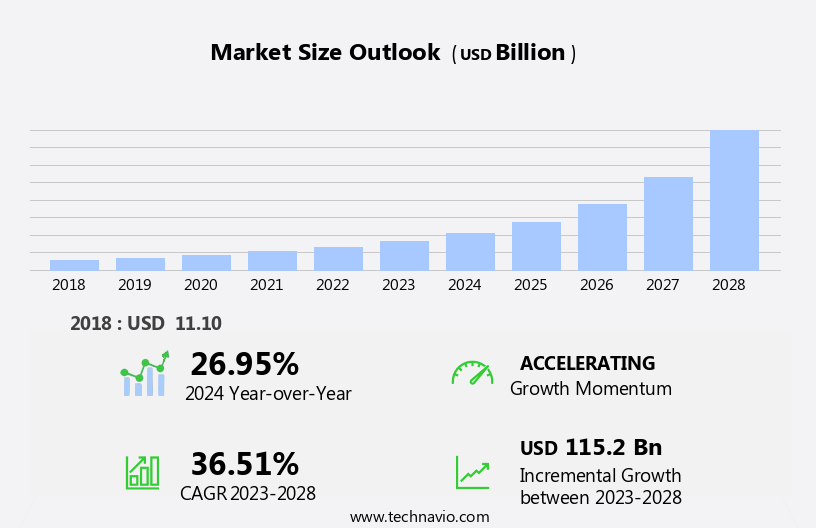
The server san market size is forecast to increase by USD 115.2 billion, at a CAGR of 36.51% between 2023 and 2028.

  • The market is experiencing significant growth, driven by the increasing adoption of e-commerce platforms and the convergence of server SAN solutions with cloud services. E-commerce websites require robust and efficient data storage solutions to handle large volumes of customer data and transactions. Server SAN technology offers the necessary performance, scalability, and flexibility to meet these demands. Additionally, cloud services are increasingly integrating server SAN solutions to enhance their offerings and provide customers with more options for data storage and management. However, the market faces challenges, primarily in the form of cybersecurity threats. With the increasing digitization of business operations and the growing amount of sensitive data being stored on server SANs, the risk of cyber attacks is heightened.
  • Hackers are constantly seeking vulnerabilities to exploit, and data breaches can result in significant financial and reputational damage. Companies must invest in robust cybersecurity measures to protect their server SAN infrastructure and mitigate these risks. The ability to address these challenges effectively will be crucial for market success.

What will be the Size of the Server San Market during the forecast period?

Server San Market Size

 Request Free Sample

The market continues to evolve, with dynamic market activities unfolding across various sectors. Asset protection remains a top priority, as energy efficiency gains increasing importance in data centers. Server rack cleaning and cable management are essential for operational efficiency and business continuity. Environmental sustainability is a growing concern, with server room sanitation and electrostatic disinfection integral to maintaining air quality and preventing bioaerosol control. Critical environments demand stringent cleanroom protocols and particle control to ensure data center hygiene and data security. Contamination prevention through microbial sampling and HVAC filtration is crucial for IT service continuity and emergency response.

Preventive and corrective maintenance schedules are essential for risk mitigation and electrical safety, while adhering to industry standards and compliance regulations. Performance optimization and quality assurance are key objectives, with green data centers and sustainable practices becoming increasingly important. Water conservation and hydrogen peroxide vaporization are among the innovative solutions for IT infrastructure cleaning. Fire suppression and disaster recovery are essential for business continuity, with employee training and best practices ensuring effective implementation of safety procedures. Continuous improvement through performance optimization, antimicrobial coatings, and cost reduction are integral to the market's ongoing evolution. The market's dynamic nature underscores the importance of staying informed and adaptive to emerging trends and regulations.

How is this Server San Industry segmented?

The server san industry research report provides comprehensive data (region-wise segment analysis), with forecasts and estimates in "USD billion" for the period 2024-2028, as well as historical data from 2018-2022 for the following segments.

  • Type
    • Hyperscale
    • Enterprise
  • End-user
    • Large
    • SMEs
  • Deployment Type
    • On-Premises
    • Cloud-Based
  • Stage
    • Fibre Channel
    • iSCSI
    • NVMe-oF
    • FC-NVMe
  • Geography
    • North America
      • US
      • Canada
    • Europe
      • France
      • Germany
      • Spain
      • UK
    • Middle East and Africa
      • UAE
    • APAC
      • Australia
      • China
      • India
      • Japan
    • Rest of World (ROW)

    By Type Insights

    The hyperscale segment is estimated to witness significant growth during the forecast period.

    Hyperscale server Storage Area Network (SAN) solutions have become essential for businesses managing large volumes of data and workloads. These organizations, including cloud providers, social media platforms, e-commerce giants, and other data-intensive enterprises, require storage systems that can effectively scale and perform optimally. Hyperscale server SANs offer the ability to expand storage capacity and performance in response to increasing demand, with a focus on horizontal scaling. Multiple storage nodes are added to the infrastructure to accommodate growing data and workload requirements. Energy efficiency and environmental sustainability are crucial considerations in the design of these solutions. Hyperscale server SANs incorporate advanced power management features and utilize renewable energy sources where possible.

    Cable management and server room sanitation are essential for maintaining operational efficiency and ensuring business continuity. Environmental monitoring and server downtime reduction are vital aspects of hyperscale server SANs. Real-time monitoring of temperature, humidity, and air quality ensures optimal server performance and reduces the risk of equipment failure. Electrostatic disinfection, dust mitigation, and bioaerosol control are essential for maintaining data center hygiene and preventing contamination. Safety procedures, including electrical safety and emergency response plans, are integral to the design of hyperscale server SANs. UV disinfection and biocontamination control are essential for maintaining a clean and safe environment.

    Risk mitigation strategies, such as microbial sampling and HVAC filtration, are employed to minimize potential threats to data security and IT service continuity. Preventive and corrective maintenance schedules are essential for ensuring the longevity and optimal performance of hyperscale server SANs. Water conservation and hydrogen peroxide vaporization are sustainable practices employed in the design and operation of these systems. Compliance regulations and industry standards guide the development of hyperscale server SANs, ensuring that they meet the highest levels of performance, reliability, and security. Performance optimization and data center design are critical aspects of hyperscale server SANs.

    Best practices, such as air quality management, fire suppression, and disaster recovery, are employed to ensure data center uptime and minimize downtime. Facility management is essential for maintaining the optimal operating environment for hyperscale server SANs, ensuring that they continue to meet the evolving needs of businesses dealing with massive amounts of data and workloads.

    Server San Market Size

    Request Free Sample

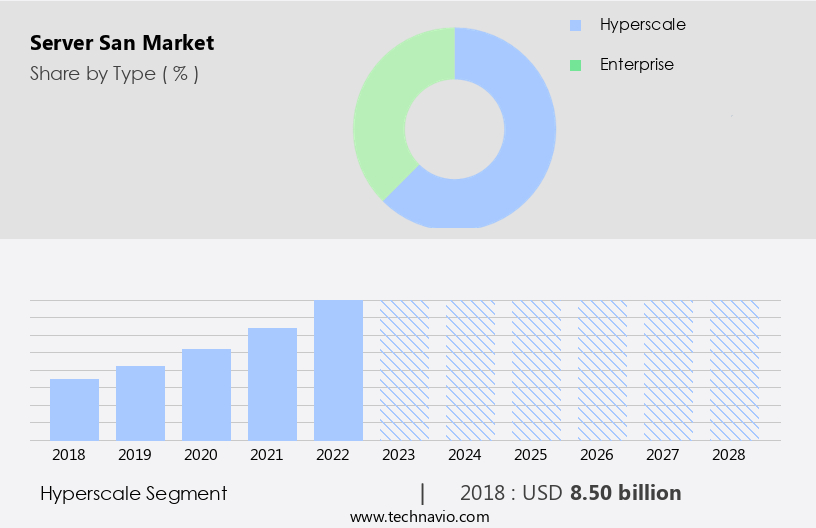
    The Hyperscale segment was valued at USD 8.50 billion in 2018 and showed a gradual increase during the forecast period.

    Regional Analysis

    North America is estimated to contribute 44% to the growth of the global market during the forecast period.Technavio’s analysts have elaborately explained the regional trends and drivers that shape the market during the forecast period.

    Server San Market Share by Geography

     Request Free Sample

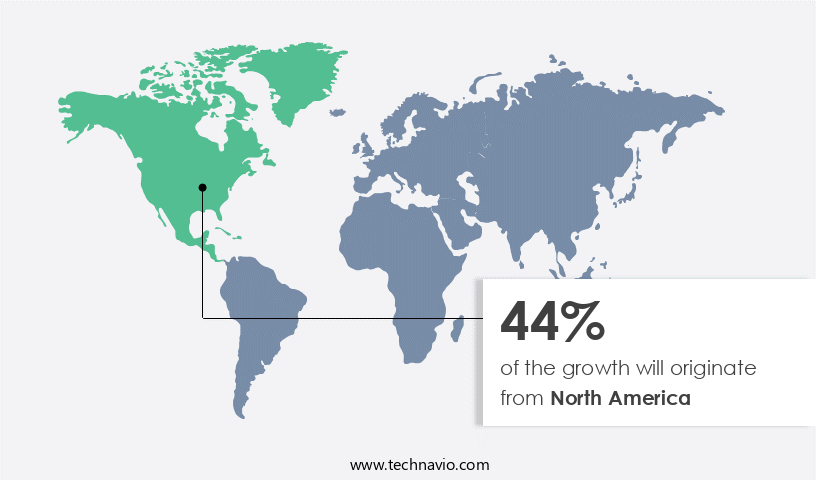
    In North America, the market experiences significant growth due to the region's mature IT infrastructure and the increasing demand for scalable, high-performance, and dependable storage solutions. Digital transformation initiatives, big data analytics, cloud computing, and mission-critical applications drive the adoption of server SANs across various industries. These sectors, including IT and telecommunications, banking and finance, healthcare, media and entertainment, manufacturing, and government, have substantial storage needs and rely on server SANs for efficient data management and application access. Energy efficiency and environmental sustainability are essential considerations in the market. Companies prioritize cable management and server room sanitation to optimize operational efficiency and ensure business continuity.

    Server sanitization, electrostatic disinfection, and dust mitigation are critical practices to maintain data security and IT service continuity. Environmental monitoring and emergency response plans are in place to minimize server downtime and electrical safety risks. Compliance regulations mandate preventive and corrective maintenance schedules, employee training, and disaster recovery plans. Best practices include performance optimization, data center hygiene, quality assurance, and industry standards. Water conservation, hydrogen peroxide vaporization, and green data centers are sustainable practices that contribute to cost reduction and risk mitigation. Bioaerosol control, particle control, contamination prevention, and microbial sampling are essential aspects of maintaining a clean and healthy critical environment.

    HVAC filtration and fire suppression systems ensure air quality management and data center uptime. Facility management practices encompass risk mitigation, fire suppression, and emergency response plans. In summary, the North American the market is characterized by a focus on energy efficiency, environmental sustainability, operational efficiency, maintenance schedules, business continuity, data security, and compliance regulations. The market's evolution reflects the growing importance of server SANs in supporting digital transformation initiatives and the need for advanced storage solutions across various industries.

    Market Dynamics

    Our researchers analyzed the data with 2023 as the base year, along with the key drivers, trends, and challenges. A holistic analysis of drivers will help companies refine their marketing strategies to gain a competitive advantage.

    What are the key market drivers leading to the rise in the adoption of Server San Industry?

    • The increasing prevalence of e-commerce websites and the continuous expansion of the IT sector serve as the primary catalysts for market growth. 

    • The market is experiencing significant growth due to the increasing reliance on digital platforms and the need for efficient data management. With the surge in e-commerce websites and the anticipated shift towards online sales, there is a growing demand for Server San technology to store critical data in heavily trafficked databases. According to recent estimates, there are between 11 million and 23 million e-commerce websites globally, with this number projected to increase as more businesses move online. By 2040, it is anticipated that over 96% of all sales will occur online. Moreover, investments in the technology sector and the expanding IT infrastructure are driving market growth.
    • For instance, India is projected to invest nearly USD 82 billion in IT in 2021 and USD 102 billion in 2022. The market is also gaining traction due to the emphasis on green data centers and sustainable practices. Hydrogen peroxide vaporization, a key technology in Server San, is an eco-friendly alternative to traditional cleaning methods. This, coupled with critical environment cleaning, air quality management, and fire suppression systems, ensures data center uptime and compliance with regulations. Preventive maintenance and antimicrobial coatings further reduce costs and enhance performance. In conclusion, the market is poised for growth due to the increasing digital economy, investments in technology, and the need for sustainable data center practices.
    • The technology's ability to enhance data center design, improve air quality management, and ensure compliance with regulations makes it an essential component of modern IT infrastructure.

    What are the market trends shaping the Server San Industry?

    • The convergence of server SAN (Storage Area Network) solutions and cloud services is an emerging market trend. This fusion of traditional on-premises storage systems with cloud-based services offers businesses the benefits of both worlds: the control and performance of local storage, combined with the flexibility and cost savings of cloud computing.

    • The market is witnessing significant growth due to the convergence of server SAN solutions with cloud services. This trend is driven by the increasing adoption of hybrid and multi-cloud strategies by organizations. By integrating their on-premises server SAN infrastructures with public and private cloud environments, businesses can reap the benefits of cloud services such as scalability, flexibility, and cost-efficiency, while maintaining control over their critical data. One of the key advantages of this convergence is the seamless data mobility it enables. Organizations can leverage the cloud for offloading less critical or temporary workloads, archiving data, and disaster recovery purposes.
    • This can lead to improved business continuity and increased operational efficiency. Additionally, cloud services offer the ability to easily scale resources up or down based on demand, providing businesses with greater flexibility and agility. Furthermore, server SAN solutions in the cloud enable organizations to reduce capital expenditures on hardware and maintenance costs, as well as operational expenses related to power and cooling. Overall, the convergence of server SANs with cloud services presents a valuable opportunity for businesses looking to optimize their IT infrastructure and improve their competitive position in the market.

    What challenges does the Server San Industry face during its growth?

    • Cybersecurity challenges pose a significant threat to industry growth, requiring organizations to invest heavily in protective measures to safeguard against data breaches, hacking attempts, and other digital risks. 

    • In today's digital business landscape, it asset protection is a top priority for enterprises in various sectors, including finance and healthcare. With the increasing threat of cyberattacks and stringent data protection regulations such as GDPR, the need for secure server infrastructure solutions has become crucial. The market refers to the market for solutions that ensure the protection, energy efficiency, and operational efficiency of server SAN (Storage Area Network) environments. These solutions encompass server rack cleaning, environmental sustainability, cable management, server room sanitation, electrostatic disinfection, and dust mitigation. By implementing these measures, businesses can maintain cleanroom protocols that minimize the risk of bioaerosol contamination and ensure business continuity.
    • Energy efficiency is another significant aspect of server SAN solutions. These solutions help reduce energy consumption and lower operational costs. Regular maintenance schedules are essential to ensure the longevity and optimal performance of server SAN infrastructure. In conclusion, the market offers businesses advanced solutions to mitigate security risks, maintain operational efficiency, and ensure environmental sustainability. By investing in these solutions, enterprises can protect their sensitive information, comply with data protection regulations, and maintain a harmonious and immersive server environment.

    Exclusive Customer Landscape

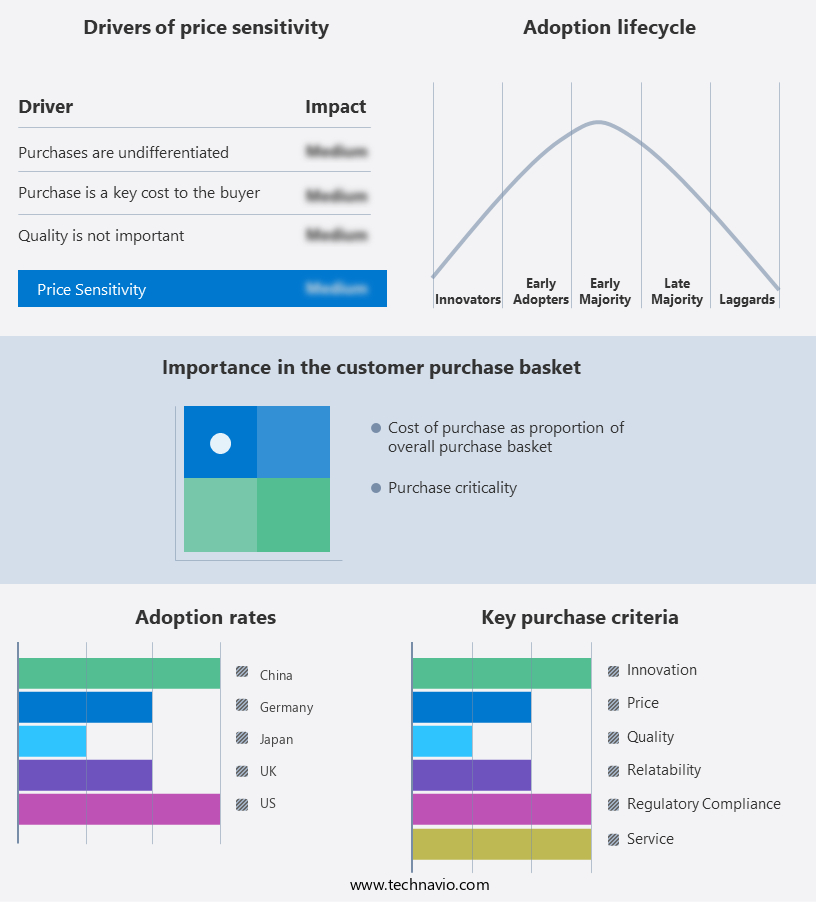
    The server san market forecasting report includes the adoption lifecycle of the market, covering from the innovator’s stage to the laggard’s stage. It focuses on adoption rates in different regions based on penetration. Furthermore, the server san market report also includes key purchase criteria and drivers of price sensitivity to help companies evaluate and develop their market growth analysis strategies.

    Server San Market Share by Geography

     Customer Landscape

    Key Companies & Market Insights

    Companies are implementing various strategies, such as strategic alliances, server san market forecast, partnerships, mergers and acquisitions, geographical expansion, and product/service launches, to enhance their presence in the industry.

    Ardis Technologies BV - This company provides high-performance server solutions, including the HyPerDDP12D, which delivers ultra-fast shared storage and SSD capabilities. Ideal for post-production and broadcast applications, this technology enhances workflow efficiency and data accessibility. The HyPerDDP12D's advanced architecture ensures optimal IOPS and throughput, enabling seamless handling of large media files and real-time editing. With its robust data management features, this server solution guarantees reliability and scalability, making it a preferred choice for media professionals.

    The industry research and growth report includes detailed analyses of the competitive landscape of the market and information about key companies, including:

    • Ardis Technologies BV
    • Cisco Systems Inc.
    • Cloud Software Group Inc.
    • DataCore Software Corp.
    • DataDirect Networks Inc.
    • Dell Technologies Inc.
    • Extreme Networks Inc.
    • Hewlett Packard Enterprise Co.
    • Hitachi Ltd.
    • Huawei Technologies Co. Ltd.
    • International Business Machines Corp.
    • Lenovo Group Ltd.
    • NetApp Inc.
    • Nutanix Inc.
    • Pure Storage Inc.
    • Scale Computing
    • Sophos Ltd.
    • The Siemon Co.
    • Veeam Software Group GmbH
    • Western Digital Corp.

    Qualitative and quantitative analysis of companies has been conducted to help clients understand the wider business environment as well as the strengths and weaknesses of key industry players. Data is qualitatively analyzed to categorize companies as pure play, category-focused, industry-focused, and diversified; it is quantitatively analyzed to categorize companies as dominant, leading, strong, tentative, and weak.

    Recent Development and News in Server San Market

    • In February 2023, IBM announced the launch of its new Power10 processor, designed to deliver significant improvements in performance, energy efficiency, and security for server systems (IBM Press Release, 2023). This innovation marks a significant technological advancement in the market, as IBM aims to cater to the increasing demand for high-performance, energy-efficient servers.
    • In October 2024, Amazon Web Services (AWS) and Microsoft Azure entered into a strategic partnership to expand their collaboration on various projects, including the interoperability of their respective serverless computing platforms (AWS Press Release, 2024). This collaboration is expected to provide more flexibility and choice for businesses, fostering healthy competition and innovation within the market.
    • In January 2025, Google Cloud Platform secured a strategic investment of USD9 billion from various investors, including Microsoft, to accelerate its growth in the cloud infrastructure market, including servers (Google Cloud Press Release, 2025). This substantial investment underscores Google's commitment to expanding its presence and competing with market leaders like AWS and Microsoft Azure in the market.
    • In March 2025, the European Union introduced new data protection regulations, the Data Protection Regulation for Cloud Services (DPRCS), which set stringent security and privacy standards for cloud service providers, including those offering server solutions (European Commission, 2025). This regulatory development is expected to drive demand for secure server solutions and foster innovation in the market, as providers race to meet the new regulatory requirements.

    Research Analyst Overview

    • In the market, surface decontamination and air filtration technologies play a crucial role in maintaining data center cleanliness and ensuring operational resilience. Sustainable practices, such as energy consumption reduction and waste reduction, are increasingly prioritized to minimize environmental impact. Biohazard containment and sanitation protocols are essential for employee safety and data center security. Edge computing and cleanroom certification are key trends in data center modernization, while equipment reliability and remote monitoring enable maintenance optimization. Energy consumption reduction is a significant focus, with AI and machine learning employed to optimize power usage. Data center security is enhanced through predictive maintenance and quality control measures.
    • Water usage reduction is another critical trend, as is the integration of cloud computing and cleaning validation to improve operational efficiency. Microbial growth inhibition strategies are essential for maintaining optimal cleanliness levels and preventing contamination. Environmental impact assessment is a crucial consideration in data center design and operations, with a growing emphasis on sustainable practices and waste reduction. The market is evolving rapidly, with innovation driving advancements in air filtration technologies, edge computing, and AI-driven predictive maintenance. Energy consumption reduction and sustainability remain key priorities, while data center security and employee safety training remain essential components of a comprehensive sanitation strategy.

    Dive into Technavio’s robust research methodology, blending expert interviews, extensive data synthesis, and validated models for unparalleled Server San Market insights. See full methodology.

    Market Scope

    Report Coverage

    Details

    Page number

    163

    Base year

    2023

    Historic period

    2018-2022

    Forecast period

    2024-2028

    Growth momentum & CAGR

    Accelerate at a CAGR of 36.51%

    Market growth 2024-2028

    USD 115.2 billion

    Market structure

    Fragmented

    YoY growth 2023-2024(%)

    26.95

    Key countries

    US, China, Germany, Japan, UK, UAE, India, Australia, Spain, Rest of World, Europe, France, and Canada

    Competitive landscape

    Leading Companies, Market Positioning of Companies, Competitive Strategies, and Industry Risks

    Request Free Sample

    What are the Key Data Covered in this Server San Market Research and Growth Report?

    • CAGR of the Server San industry during the forecast period
    • Detailed information on factors that will drive the growth and forecasting between 2024 and 2028
    • Precise estimation of the size of the market and its contribution of the industry in focus to the parent market
    • Accurate predictions about upcoming growth and trends and changes in consumer behaviour
    • Growth of the market across North America, APAC, Europe, South America, and Middle East and Africa
    • Thorough analysis of the market’s competitive landscape and detailed information about companies
    • Comprehensive analysis of factors that will challenge the server san market growth of industry companies

    We can help! Our analysts can customize this server san market research report to meet your requirements.

    Get in touch


    1 Executive Summary

    • 1.1 Market overview
      • Executive Summary - Chart on Market Overview
      • Executive Summary - Data Table on Market Overview
      • Executive Summary - Chart on Global Market Characteristics
      • Executive Summary - Chart on Market by Geography
      • Executive Summary - Chart on Market Segmentation by Type
      • Executive Summary - Chart on Market Segmentation by End-user
      • Executive Summary - Chart on Incremental Growth
      • Executive Summary - Data Table on Incremental Growth
      • Executive Summary - Chart on Company Market Positioning

    2 Market Landscape

    • 2.1 Market ecosystem
      • Parent Market
      • Data Table on - Parent Market
    • 2.2 Market characteristics
      • Market characteristics analysis
    • 2.3 Value chain analysis
      • Value Chain Analysis

    3 Market Sizing

    • 3.1 Market definition
      • Offerings of companies included in the market definition
    • 3.2 Market segment analysis
      • Market segments
    • 3.3 Market size 2023
      • 3.4 Market outlook: Forecast for 2023-2028
        • Chart on Global - Market size and forecast 2023-2028 ($ billion)
        • Data Table on Global - Market size and forecast 2023-2028 ($ billion)
        • Chart on Global Market: Year-over-year growth 2023-2028 (%)
        • Data Table on Global Market: Year-over-year growth 2023-2028 (%)

      4 Historic Market Size

      • 4.1 Global Server SAN Market 2018 - 2022
        • Historic Market Size - Data Table on Global Server SAN Market 2018 - 2022 ($ billion)
      • 4.2 Type segment analysis 2018 - 2022
        • Historic Market Size - Type Segment 2018 - 2022 ($ billion)
      • 4.3 End-user segment analysis 2018 - 2022
        • Historic Market Size - End-user Segment 2018 - 2022 ($ billion)
      • 4.4 Geography segment analysis 2018 - 2022
        • Historic Market Size - Geography Segment 2018 - 2022 ($ billion)
      • 4.5 Country segment analysis 2018 - 2022
        • Historic Market Size - Country Segment 2018 - 2022 ($ billion)

      5 Five Forces Analysis

      • 5.1 Five forces summary
        • Five forces analysis - Comparison between 2023 and 2028
      • 5.2 Bargaining power of buyers
        • Bargaining power of buyers - Impact of key factors 2023 and 2028
      • 5.3 Bargaining power of suppliers
        • Bargaining power of suppliers - Impact of key factors in 2023 and 2028
      • 5.4 Threat of new entrants
        • Threat of new entrants - Impact of key factors in 2023 and 2028
      • 5.5 Threat of substitutes
        • Threat of substitutes - Impact of key factors in 2023 and 2028
      • 5.6 Threat of rivalry
        • Threat of rivalry - Impact of key factors in 2023 and 2028
      • 5.7 Market condition
        • Chart on Market condition - Five forces 2023 and 2028

      6 Market Segmentation by Type

      • 6.1 Market segments
        • Chart on Type - Market share (2023-2028) (%)
        • Data Table on Type - Market share (2023-2028) (%)
      • 6.2 Comparison by Type
        • Chart on Comparison by Type
        • Data Table on Comparison by Type
      • 6.3 Hyperscale - Market size and forecast (2023-2028)
        • Chart on Hyperscale - Market size and forecast (2023-2028) ($ billion)
        • Data Table on Hyperscale - Market size and forecast (2023-2028) ($ billion)
        • Chart on Hyperscale - Year-over-year growth (2023-2028) (%)
        • Data Table on Hyperscale - Year-over-year growth (2023-2028) (%)
      • 6.4 Enterprise - Market size and forecast (2023-2028)
        • Chart on Enterprise - Market size and forecast (2023-2028) ($ billion)
        • Data Table on Enterprise - Market size and forecast (2023-2028) ($ billion)
        • Chart on Enterprise - Year-over-year growth (2023-2028) (%)
        • Data Table on Enterprise - Year-over-year growth (2023-2028) (%)
      • 6.5 Market opportunity by Type
        • Market opportunity by Type ($ billion)
        • Data Table on Market opportunity by Type ($ billion)

      7 Market Segmentation by End-user

      • 7.1 Market segments
        • Chart on End-user - Market share (2023-2028) (%)
        • Data Table on End-user - Market share (2023-2028) (%)
      • 7.2 Comparison by End-user
        • Chart on Comparison by End-user
        • Data Table on Comparison by End-user
      • 7.3 Large - Market size and forecast (2023-2028)
        • Chart on Large - Market size and forecast (2023-2028) ($ billion)
        • Data Table on Large - Market size and forecast (2023-2028) ($ billion)
        • Chart on Large - Year-over-year growth (2023-2028) (%)
        • Data Table on Large - Year-over-year growth (2023-2028) (%)
      • 7.4 SMEs - Market size and forecast (2023-2028)
        • Chart on SMEs - Market size and forecast (2023-2028) ($ billion)
        • Data Table on SMEs - Market size and forecast (2023-2028) ($ billion)
        • Chart on SMEs - Year-over-year growth (2023-2028) (%)
        • Data Table on SMEs - Year-over-year growth (2023-2028) (%)
      • 7.5 Market opportunity by End-user
        • Market opportunity by End-user ($ billion)
        • Data Table on Market opportunity by End-user ($ billion)

      8 Market Segmentation by Deployment Type

      • 8.1 Market segments
        • Chart on Deployment Type - Market share (2023-2028) (%)
        • Data Table on Deployment Type - Market share (2023-2028) (%)
      • 8.2 Comparison by Deployment Type
        • Chart on Comparison by Deployment Type
        • Data Table on Comparison by Deployment Type
      • 8.3 On-Premises - Market size and forecast (2023-2028)
        • Chart on On-Premises - Market size and forecast (2023-2028) ($ billion)
        • Data Table on On-Premises - Market size and forecast (2023-2028) ($ billion)
        • Chart on On-Premises - Year-over-year growth (2023-2028) (%)
        • Data Table on On-Premises - Year-over-year growth (2023-2028) (%)
      • 8.4 Cloud-Based - Market size and forecast (2023-2028)
        • Chart on Cloud-Based - Market size and forecast (2023-2028) ($ billion)
        • Data Table on Cloud-Based - Market size and forecast (2023-2028) ($ billion)
        • Chart on Cloud-Based - Year-over-year growth (2023-2028) (%)
        • Data Table on Cloud-Based - Year-over-year growth (2023-2028) (%)
      • 8.5 Market opportunity by Deployment Type
        • Market opportunity by Deployment Type ($ billion)
        • Data Table on Market opportunity by Deployment Type ($ billion)

      9 Market Segmentation by Stage

      • 9.1 Market segments
        • Chart on Stage - Market share (2023-2028) (%)
        • Data Table on Stage - Market share (2023-2028) (%)
      • 9.2 Comparison by Stage
        • Chart on Comparison by Stage
        • Data Table on Comparison by Stage
      • 9.3 Fibre Channel - Market size and forecast (2023-2028)
        • Chart on Fibre Channel - Market size and forecast (2023-2028) ($ billion)
        • Data Table on Fibre Channel - Market size and forecast (2023-2028) ($ billion)
        • Chart on Fibre Channel - Year-over-year growth (2023-2028) (%)
        • Data Table on Fibre Channel - Year-over-year growth (2023-2028) (%)
      • 9.4 iSCSI - Market size and forecast (2023-2028)
        • Chart on iSCSI - Market size and forecast (2023-2028) ($ billion)
        • Data Table on iSCSI - Market size and forecast (2023-2028) ($ billion)
        • Chart on iSCSI - Year-over-year growth (2023-2028) (%)
        • Data Table on iSCSI - Year-over-year growth (2023-2028) (%)
      • 9.5 NVMe-oF - Market size and forecast (2023-2028)
        • Chart on NVMe-oF - Market size and forecast (2023-2028) ($ billion)
        • Data Table on NVMe-oF - Market size and forecast (2023-2028) ($ billion)
        • Chart on NVMe-oF - Year-over-year growth (2023-2028) (%)
        • Data Table on NVMe-oF - Year-over-year growth (2023-2028) (%)
      • 9.6 FC-NVMe - Market size and forecast (2023-2028)
        • Chart on FC-NVMe - Market size and forecast (2023-2028) ($ billion)
        • Data Table on FC-NVMe - Market size and forecast (2023-2028) ($ billion)
        • Chart on FC-NVMe - Year-over-year growth (2023-2028) (%)
        • Data Table on FC-NVMe - Year-over-year growth (2023-2028) (%)
      • 9.7 Market opportunity by Stage
        • Market opportunity by Stage ($ billion)
        • Data Table on Market opportunity by Stage ($ billion)

      10 Customer Landscape

      • 10.1 Customer landscape overview
        • Analysis of price sensitivity, lifecycle, customer purchase basket, adoption rates, and purchase criteria

      11 Geographic Landscape

      • 11.1 Geographic segmentation
        • Chart on Market share by geography 2023-2028 (%)
        • Data Table on Market share by geography 2023-2028 (%)
      • 11.2 Geographic comparison
        • Chart on Geographic comparison
        • Data Table on Geographic comparison
      • 11.3 North America - Market size and forecast 2023-2028
        • Chart on North America - Market size and forecast 2023-2028 ($ billion)
        • Data Table on North America - Market size and forecast 2023-2028 ($ billion)
        • Chart on North America - Year-over-year growth 2023-2028 (%)
        • Data Table on North America - Year-over-year growth 2023-2028 (%)
      • 11.4 APAC - Market size and forecast 2023-2028
        • Chart on APAC - Market size and forecast 2023-2028 ($ billion)
        • Data Table on APAC - Market size and forecast 2023-2028 ($ billion)
        • Chart on APAC - Year-over-year growth 2023-2028 (%)
        • Data Table on APAC - Year-over-year growth 2023-2028 (%)
      • 11.5 Europe - Market size and forecast 2023-2028
        • Chart on Europe - Market size and forecast 2023-2028 ($ billion)
        • Data Table on Europe - Market size and forecast 2023-2028 ($ billion)
        • Chart on Europe - Year-over-year growth 2023-2028 (%)
        • Data Table on Europe - Year-over-year growth 2023-2028 (%)
      • 11.6 South America - Market size and forecast 2023-2028
        • Chart on South America - Market size and forecast 2023-2028 ($ billion)
        • Data Table on South America - Market size and forecast 2023-2028 ($ billion)
        • Chart on South America - Year-over-year growth 2023-2028 (%)
        • Data Table on South America - Year-over-year growth 2023-2028 (%)
      • 11.7 Middle East and Africa - Market size and forecast 2023-2028
        • Chart on Middle East and Africa - Market size and forecast 2023-2028 ($ billion)
        • Data Table on Middle East and Africa - Market size and forecast 2023-2028 ($ billion)
        • Chart on Middle East and Africa - Year-over-year growth 2023-2028 (%)
        • Data Table on Middle East and Africa - Year-over-year growth 2023-2028 (%)
      • 11.8 US - Market size and forecast 2023-2028
        • Chart on US - Market size and forecast 2023-2028 ($ billion)
        • Data Table on US - Market size and forecast 2023-2028 ($ billion)
        • Chart on US - Year-over-year growth 2023-2028 (%)
        • Data Table on US - Year-over-year growth 2023-2028 (%)
      • 11.9 China - Market size and forecast 2023-2028
        • Chart on China - Market size and forecast 2023-2028 ($ billion)
        • Data Table on China - Market size and forecast 2023-2028 ($ billion)
        • Chart on China - Year-over-year growth 2023-2028 (%)
        • Data Table on China - Year-over-year growth 2023-2028 (%)
      • 11.10 Germany - Market size and forecast 2023-2028
        • Chart on Germany - Market size and forecast 2023-2028 ($ billion)
        • Data Table on Germany - Market size and forecast 2023-2028 ($ billion)
        • Chart on Germany - Year-over-year growth 2023-2028 (%)
        • Data Table on Germany - Year-over-year growth 2023-2028 (%)
      • 11.11 Japan - Market size and forecast 2023-2028
        • Chart on Japan - Market size and forecast 2023-2028 ($ billion)
        • Data Table on Japan - Market size and forecast 2023-2028 ($ billion)
        • Chart on Japan - Year-over-year growth 2023-2028 (%)
        • Data Table on Japan - Year-over-year growth 2023-2028 (%)
      • 11.12 UK - Market size and forecast 2023-2028
        • Chart on UK - Market size and forecast 2023-2028 ($ billion)
        • Data Table on UK - Market size and forecast 2023-2028 ($ billion)
        • Chart on UK - Year-over-year growth 2023-2028 (%)
        • Data Table on UK - Year-over-year growth 2023-2028 (%)
      • 11.13 Market opportunity by geography
        • Market opportunity by geography ($ billion)
        • Data Tables on Market opportunity by geography ($ billion)
      • 11.14 UAE - Market size and forecast (2023-2028)
        • Chart on UAE - Market size and forecast (2023-2028) ($ billion)
        • Data Table on UAE - Market size and forecast (2023-2028) ($ billion)
        • Chart on UAE - Year-over-year growth (2023-2028) (%)
        • Data Table on UAE - Year-over-year growth (2023-2028) (%)
      • 11.15 India - Market size and forecast (2023-2028)
        • Chart on India - Market size and forecast (2023-2028) ($ billion)
        • Data Table on India - Market size and forecast (2023-2028) ($ billion)
        • Chart on India - Year-over-year growth (2023-2028) (%)
        • Data Table on India - Year-over-year growth (2023-2028) (%)
      • 11.16 Australia - Market size and forecast (2023-2028)
        • Chart on Australia - Market size and forecast (2023-2028) ($ billion)
        • Data Table on Australia - Market size and forecast (2023-2028) ($ billion)
        • Chart on Australia - Year-over-year growth (2023-2028) (%)
        • Data Table on Australia - Year-over-year growth (2023-2028) (%)
      • 11.17 Spain - Market size and forecast (2023-2028)
        • Chart on Spain - Market size and forecast (2023-2028) ($ billion)
        • Data Table on Spain - Market size and forecast (2023-2028) ($ billion)
        • Chart on Spain - Year-over-year growth (2023-2028) (%)
        • Data Table on Spain - Year-over-year growth (2023-2028) (%)
      • 11.18 Rest of World - Market size and forecast (2023-2028)
        • Chart on Rest of World - Market size and forecast (2023-2028) ($ billion)
        • Data Table on Rest of World - Market size and forecast (2023-2028) ($ billion)
        • Chart on Rest of World - Year-over-year growth (2023-2028) (%)
        • Data Table on Rest of World - Year-over-year growth (2023-2028) (%)
      • 11.19 France - Market size and forecast (2023-2028)
        • Chart on France - Market size and forecast (2023-2028) ($ billion)
        • Data Table on France - Market size and forecast (2023-2028) ($ billion)
        • Chart on France - Year-over-year growth (2023-2028) (%)
        • Data Table on France - Year-over-year growth (2023-2028) (%)
      • 11.20 Canada - Market size and forecast (2023-2028)
        • Chart on Canada - Market size and forecast (2023-2028) ($ billion)
        • Data Table on Canada - Market size and forecast (2023-2028) ($ billion)
        • Chart on Canada - Year-over-year growth (2023-2028) (%)
        • Data Table on Canada - Year-over-year growth (2023-2028) (%)
      • 11.21 Rest of World (ROW) - Market size and forecast (2023-2028)
        • Chart on Rest of World (ROW) - Market size and forecast (2023-2028) ($ billion)
        • Data Table on Rest of World (ROW) - Market size and forecast (2023-2028) ($ billion)
        • Chart on Rest of World (ROW) - Year-over-year growth (2023-2028) (%)
        • Data Table on Rest of World (ROW) - Year-over-year growth (2023-2028) (%)

      12 Drivers, Challenges, and Opportunity/Restraints

      • 12.1 Market drivers
        • 12.2 Market challenges
          • 12.3 Impact of drivers and challenges
            • Impact of drivers and challenges in 2023 and 2028
          • 12.4 Market opportunities/restraints

            13 Competitive Landscape

            • 13.1 Overview
              • 13.2 Competitive Landscape
                • Overview on criticality of inputs and factors of differentiation
              • 13.3 Landscape disruption
                • Overview on factors of disruption
              • 13.4 Industry risks
                • Impact of key risks on business

              14 Competitive Analysis

              • 14.1 Companies profiled
                • Companies covered
              • 14.2 Market positioning of companies
                • Matrix on companies position and classification
              • 14.3 Ardis Technologies BV
                • Ardis Technologies BV - Overview
                • Ardis Technologies BV - Product / Service
                • Ardis Technologies BV - Key offerings
              • 14.4 Cisco Systems Inc.
                • Cisco Systems Inc. - Overview
                • Cisco Systems Inc. - Business segments
                • Cisco Systems Inc. - Key news
                • Cisco Systems Inc. - Key offerings
                • Cisco Systems Inc. - Segment focus
              • 14.5 Cloud Software Group Inc.
                • Cloud Software Group Inc. - Overview
                • Cloud Software Group Inc. - Product / Service
                • Cloud Software Group Inc. - Key news
                • Cloud Software Group Inc. - Key offerings
              • 14.6 DataCore Software Corp.
                • DataCore Software Corp. - Overview
                • DataCore Software Corp. - Product / Service
                • DataCore Software Corp. - Key offerings
              • 14.7 DataDirect Networks Inc.
                • DataDirect Networks Inc. - Overview
                • DataDirect Networks Inc. - Product / Service
                • DataDirect Networks Inc. - Key offerings
              • 14.8 Dell Technologies Inc.
                • Dell Technologies Inc. - Overview
                • Dell Technologies Inc. - Business segments
                • Dell Technologies Inc. - Key news
                • Dell Technologies Inc. - Key offerings
                • Dell Technologies Inc. - Segment focus
              • 14.9 Extreme Networks Inc.
                • Extreme Networks Inc. - Overview
                • Extreme Networks Inc. - Product / Service
                • Extreme Networks Inc. - Key news
                • Extreme Networks Inc. - Key offerings
              • 14.10 Hewlett Packard Enterprise Co.
                • Hewlett Packard Enterprise Co. - Overview
                • Hewlett Packard Enterprise Co. - Business segments
                • Hewlett Packard Enterprise Co. - Key news
                • Hewlett Packard Enterprise Co. - Key offerings
                • Hewlett Packard Enterprise Co. - Segment focus
              • 14.11 Hitachi Ltd.
                • Hitachi Ltd. - Overview
                • Hitachi Ltd. - Business segments
                • Hitachi Ltd. - Key news
                • Hitachi Ltd. - Key offerings
                • Hitachi Ltd. - Segment focus
              • 14.12 Huawei Technologies Co. Ltd.
                • Huawei Technologies Co. Ltd. - Overview
                • Huawei Technologies Co. Ltd. - Product / Service
                • Huawei Technologies Co. Ltd. - Key news
                • Huawei Technologies Co. Ltd. - Key offerings
              • 14.13 International Business Machines Corp.
                • International Business Machines Corp. - Overview
                • International Business Machines Corp. - Business segments
                • International Business Machines Corp. - Key news
                • International Business Machines Corp. - Key offerings
                • International Business Machines Corp. - Segment focus
              • 14.14 Lenovo Group Ltd.
                • Lenovo Group Ltd. - Overview
                • Lenovo Group Ltd. - Business segments
                • Lenovo Group Ltd. - Key news
                • Lenovo Group Ltd. - Key offerings
                • Lenovo Group Ltd. - Segment focus
              • 14.15 Nutanix Inc.
                • Nutanix Inc. - Overview
                • Nutanix Inc. - Product / Service
                • Nutanix Inc. - Key offerings
              • 14.16 Scale Computing
                • Scale Computing - Overview
                • Scale Computing - Product / Service
                • Scale Computing - Key offerings
              • 14.17 Sophos Ltd.
                • Sophos Ltd. - Overview
                • Sophos Ltd. - Product / Service
                • Sophos Ltd. - Key news
                • Sophos Ltd. - Key offerings

              15 Appendix

              • 15.1 Scope of the report
                • 15.2 Inclusions and exclusions checklist
                  • Inclusions checklist
                  • Exclusions checklist
                • 15.3 Currency conversion rates for US$
                  • Currency conversion rates for US$
                • 15.4 Research methodology
                  • Research methodology
                • 15.5 Data procurement
                  • Information sources
                • 15.6 Data validation
                  • Data validation
                • 15.7 Validation techniques employed for market sizing
                  • Validation techniques employed for market sizing
                • 15.8 Data synthesis
                  • Data synthesis
                • 15.9 360 degree market analysis
                  • 360 degree market analysis
                • 15.10 List of abbreviations
                  • List of abbreviations

                Research Methodology

                Technavio presents a detailed picture of the market by way of study, synthesis, and summation of data from multiple sources. The analysts have presented the various facets of the market with a particular focus on identifying the key industry influencers. The data thus presented is comprehensive, reliable, and the result of extensive research, both primary and secondary.

                INFORMATION SOURCES

                Primary sources

                • Manufacturers and suppliers
                • Channel partners
                • Industry experts
                • Strategic decision makers

                Secondary sources

                • Industry journals and periodicals
                • Government data
                • Financial reports of key industry players
                • Historical data
                • Press releases

                DATA ANALYSIS

                Data Synthesis

                • Collation of data
                • Estimation of key figures
                • Analysis of derived insights

                Data Validation

                • Triangulation with data models
                • Reference against proprietary databases
                • Corroboration with industry experts

                REPORT WRITING

                Qualitative

                • Market drivers
                • Market challenges
                • Market trends
                • Five forces analysis

                Quantitative

                • Market size and forecast
                • Market segmentation
                • Geographical insights
                • Competitive landscape

                Interested in this report?

                Get your sample now to see our research methodology and insights!

                Download Now

                Frequently Asked Questions

                Server San market growth will increase by $ 115.2 bn during 2024-2028.

                The Server San market is expected to grow at a CAGR of 36.51% during 2024-2028.

                Server San market is segmented by Type( Hyperscale, Enterprise) End-user( Large, SMEs)

                Ardis Technologies BV, Cisco Systems Inc., Cloud Software Group Inc., DataCore Software Corp., DataDirect Networks Inc., Dell Technologies Inc., Extreme Networks Inc., Hewlett Packard Enterprise Co., Hitachi Ltd., Huawei Technologies Co. Ltd., International Business Machines Corp., Lenovo Group Ltd., NetApp Inc., Nutanix Inc., Pure Storage Inc., Scale Computing, Sophos Ltd., The Siemon Co., Veeam Software Group GmbH, Western Digital Corp. are a few of the key vendors in the Server San market.

                North America will register the highest growth rate of 44% among the other regions. Therefore, the Server San market in North America is expected to garner significant business opportunities for the vendors during the forecast period.

                US, China, Germany, Japan, UK, UAE, India, Australia, Spain, Rest of World, Europe, France, Canada

                • Growing usage of e-commerce websites and expanding IT SectorThe rise in e-commerce website usage has led to an increase in consumer usage of online channels. In this case is the driving factor this market.
                • SANs are primarily used to store critical data in heavily trafficked databases in order to enhance performance and increase efficiency. For instance is the driving factor this market.
                • there are currently between 11 million and 23 million e-commerce websites operating worldwide is the driving factor this market.
                • and that number is increasing daily. Additionally is the driving factor this market.
                • it is anticipated that by 2040 is the driving factor this market.
                • more than 96% of all sales will occur online. In addition is the driving factor this market.
                • the market in focus is anticipated to grow owing to investments in the technology sector and a growing IT sector. For instance is the driving factor this market.
                • India was predicted to spend nearly USD 82 billion on IT in 2021 and USD 102 billion in 2022. Additionally is the driving factor this market.
                • with nearly 609 is the driving factor this market.
                • 000 cloud experts across all sectors is the driving factor this market.
                • including technology is the driving factor this market.
                • India came in third place globally in FY21. Thus is the driving factor this market.
                • the growing IT sector is the driving factor this market.
                • especially in developing countries is the driving factor this market.
                • is expected to drive the growth of the market in focus during the forecast period. is the driving factor this market.

                The Server San market vendors should focus on grabbing business opportunities from the Hyperscale segment as it accounted for the largest market share in the base year.
                RIA - Research AI Assistant
                Ask RIA