
Sexual Enhancement Supplements Market Size 2025-2029
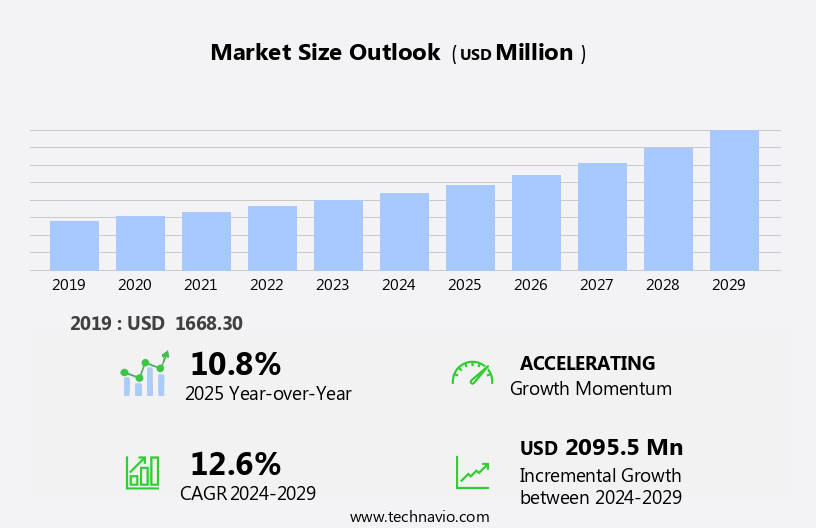
The sexual enhancement supplements market size is forecast to increase by USD 2.1 billion at a CAGR of 12.6% between 2024 and 2029.
- The market is experiencing significant growth, driven by the availability of these supplements in various dosage forms and the rapid expansion of e-commerce platforms. The versatility of sexual enhancement supplements, offered in tablets, capsules, liquids, and powders, caters to diverse consumer preferences, leading to increased demand. Furthermore, the convenience of purchasing these supplements online has made them more accessible than ever before. However, this market faces challenges as well. The availability of substitutes, such as prescription drugs and natural alternatives, poses a threat to market growth. Companies must differentiate themselves by focusing on product innovation, quality, and customer service to maintain a competitive edge.
- Effective marketing strategies and partnerships with e-commerce platforms can also help expand reach and market share. In summary, the market is poised for continued growth due to its diverse product offerings and the convenience of e-commerce, but faces competition from substitutes, necessitating strategic differentiation and marketing efforts.
What will be the Size of the Sexual Enhancement Supplements Market during the forecast period?
- The sexual enhancement supplement market continues to evolve, driven by consumer demand for products that enhance sexual desire, performance, and overall sexual health. The endocrine system plays a crucial role in this market, as many supplements aim to boost testosterone levels and improve energy levels. Digital marketing strategies, including content marketing and social media, dominate the landscape, with online retailers leveraging brand value and customer reviews to differentiate themselves. Efficacy studies and scientific evidence are essential for brand awareness, as consumers seek clinically tested, natural ingredient-based solutions. Plant extracts, amino acids, and other natural ingredients are popular choices, while prescription drugs and testosterone boosters offer more potent alternatives.
- Regulatory compliance and consumer safety are top priorities, with GMP certification and third-party testing ensuring ingredient purity and product quality. Subscription services provide a competitive advantage by offering convenience and recurring revenue streams. Relationship health and lifestyle factors also influence market dynamics, with relationship health supplements gaining popularity. New product development and dosage recommendations continue to shape the market, with clinical research and influencer marketing driving innovation. Pricing strategies vary, with some brands focusing on affordability, while others emphasize premium quality and exclusivity. Sexual performance and libido enhancement remain key applications, with erectile dysfunction supplements accounting for a significant market share.
- Overall, the sexual enhancement supplement market is a dynamic and evolving sector, with ongoing innovation and consumer demand driving growth.
How is this Sexual Enhancement Supplements Industry segmented?
The sexual enhancement supplements industry research report provides comprehensive data (region-wise segment analysis), with forecasts and estimates in "USD million" for the period 2025-2029, as well as historical data from 2019-2023 for the following segments.
- Distribution Channel
- Offline
- Online
- End-user
- Male
- Female
- Product
- Natural
- Blend
- Synthetic
- Geography
- North America
- US
- Canada
- Europe
- France
- Germany
- Italy
- UK
- APAC
- China
- India
- Japan
- South America
- Brazil
- Rest of World (ROW)
- North America
By Distribution Channel Insights
The offline segment is estimated to witness significant growth during the forecast period.
The market encompasses various distribution channels, with offline distribution playing a significant role. This traditional method of selling products through physical stores, including health stores, pharmacies, and supermarkets, offers advantages such as wider reach and consumer preference for in-person purchases. Offline channels are particularly important in the market due to product restrictions on online platforms and government regulations. Brand value and customer loyalty are crucial factors in the market, with companies investing in content marketing, social media, and influencer marketing to increase brand awareness. Efficacy studies and scientific evidence are key drivers, with consumers seeking natural ingredients and plant extracts to enhance sexual performance and libido.
New product development, including testosterone boosters and amino acids, caters to diverse customer segments and lifestyle factors. Product differentiation, pricing strategies, and dosage recommendations are essential for competitive advantage. Regulatory compliance, consumer safety, and ingredient purity are non-negotiable, with GMP certification and third-party testing ensuring quality control. Relationship health and sexual health are growing concerns, with male enhancement supplements addressing erectile dysfunction and energy levels. Subscription services and clinically tested products offer convenience and peace of mind for customers. In The market, offline distribution channels provide an essential balance to the digital landscape, catering to consumers who prefer in-person purchases or face accessibility challenges.
The market continues to evolve, with a focus on natural ingredients, scientific evidence, and customer satisfaction.
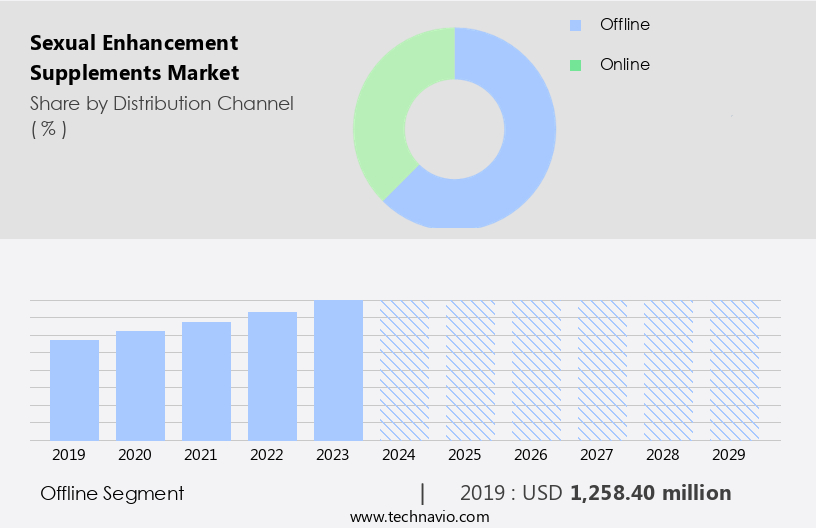
The Offline segment was valued at USD 1.26 billion in 2019 and showed a gradual increase during the forecast period.
Regional Analysis
North America is estimated to contribute 36% to the growth of the global market during the forecast period.Technavio’s analysts have elaborately explained the regional trends and drivers that shape the market during the forecast period.
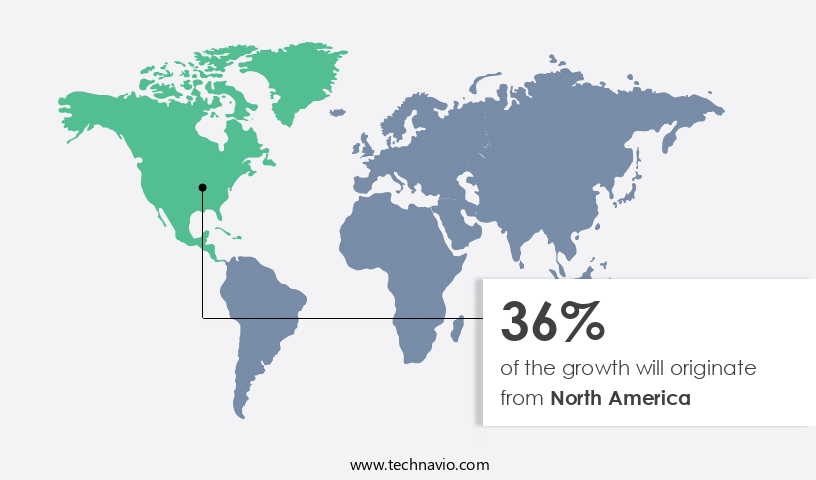
The market in North America is experiencing significant growth due to increasing awareness of sexual health, a growing urban population, and the availability of these supplements through online retailers. The endocrine system plays a crucial role in sexual function, and many supplements focus on boosting testosterone levels or improving blood flow for better sexual performance. Efficacy studies and scientific evidence are essential for brand value and customer trust, leading to an emphasis on clinical research and third-party testing. Digital marketing and social media are essential tools for reaching the target audience, with influencer marketing and content marketing strategies gaining popularity.
Erectile dysfunction is a common issue addressed by these supplements, and natural ingredients like plant extracts and amino acids are often used to enhance libido and energy levels. Product differentiation through dosage recommendations, delivery systems, and ingredient purity is crucial for customer loyalty and competitive advantage. Lifestyle factors, such as stress and poor diet, can impact sexual health, making supplements an attractive option for many consumers. Customer reviews and word-of-mouth recommendations are essential for brand awareness and new product development. Regulatory compliance and consumer safety are critical concerns, with GMP certification and prescription drugs offering alternative solutions for some consumers.
Sexual performance and relationship health are significant factors driving demand for these supplements, with subscription services and dosage recommendations offering convenience and affordability. Side effects and pricing strategies are essential considerations for customers, with clinically tested and energy-boosting supplements offering a competitive edge. Overall, the market for sexual enhancement supplements is dynamic and evolving, with a focus on natural ingredients, scientific evidence, and customer satisfaction.
Market Dynamics
Our researchers analyzed the data with 2024 as the base year, along with the key drivers, trends, and challenges. A holistic analysis of drivers will help companies refine their marketing strategies to gain a competitive advantage.
What are the key market drivers leading to the rise in the adoption of Sexual Enhancement Supplements Industry?
- The availability of supplements in various dosage forms is a significant market driver, catering to diverse consumer preferences and convenience.
- The market caters to individuals seeking to improve their sexual performance and overall sexual health. The endocrine system plays a crucial role in sexual function, making supplements that support its optimal functioning a popular choice. Digital marketing strategies, including social media and content marketing, are key drivers for reaching the target audience. Brands emphasize the use of natural ingredients, such as plant extracts, to enhance efficacy and build brand value. Online retailers offer convenience and accessibility, contributing to the market's growth.
- Efficacy studies and brand awareness campaigns help to establish trust and credibility among consumers. Companies offer sexual enhancement supplements in various dosage forms, including capsules, creams, sprays, gels, lotions, and liquid formulations, catering to diverse consumer preferences and needs. This versatility increases acceptance and adherence to these products, expanding the user base.
What are the market trends shaping the Sexual Enhancement Supplements Industry?
- E-commerce is experiencing significant growth, emerging as the next major market trend. This expansion represents a notable shift in consumer shopping behavior.
- The market is experiencing significant growth due to various lifestyle factors and the increasing emphasis on relationship health. Customer reviews play a crucial role in product differentiation, with many consumers relying on the experiences of others before making a purchase. GMP certification and scientific evidence are key considerations for consumers seeking assurance of product quality and safety. Prescription drugs, while effective, come with potential side effects and costs that may deter some individuals. As a result, sexual enhancement supplements, including testosterone boosters and amino acids, have gained popularity as a more accessible and cost-effective alternative. Customer loyalty is a significant driver of market growth, with repeat purchases a common occurrence for those who experience positive results.
- New product development is a continuous process in the market, with companies investing in research and development to create innovative solutions that cater to diverse consumer needs. Ingredient purity and scientific evidence are essential factors in the development and marketing of these supplements, ensuring that they deliver on their promised benefits. Overall, the market is expected to continue growing, driven by the increasing demand for natural and effective solutions to enhance sexual health and performance.
What challenges does the Sexual Enhancement Supplements Industry face during its growth?
- The availability of numerous substitutes poses a significant challenge to the expansion of the market.
- Sexual enhancement supplements have gained popularity in the market due to the increasing demand for products that boost sexual desire and improve sexual performance. However, the market faces challenges from substitute products such as lubricated condoms, sex toys, and erotic lingerie. These alternatives negatively impact the adoption of sexual enhancement supplements, particularly among certain consumer segments. Consumer safety and regulatory compliance are crucial factors in the sexual enhancement supplement market. Companies prioritize clinically tested products and third-party testing to ensure customer safety and trust. Pricing strategies also play a significant role in the market's dynamics.
- The sexual health industry caters to diverse customer segments, including heterosexual and LGBT populations. The growing societal acceptance of the LGBT community has increased the demand for alternative sexual wellness products, such as sex toys. These products provide positive sexual outcomes for individuals and have become a vital part of their sexual lives. Despite the challenges, the sexual enhancement supplement market continues to grow, driven by the increasing awareness of sexual health and wellness. Companies must focus on understanding consumer needs and preferences to develop effective marketing strategies and maintain regulatory compliance to ensure customer safety and trust.
Exclusive Customer Landscape
The sexual enhancement supplements market forecasting report includes the adoption lifecycle of the market, covering from the innovator’s stage to the laggard’s stage. It focuses on adoption rates in different regions based on penetration. Furthermore, the sexual enhancement supplements market report also includes key purchase criteria and drivers of price sensitivity to help companies evaluate and develop their market growth analysis strategies.
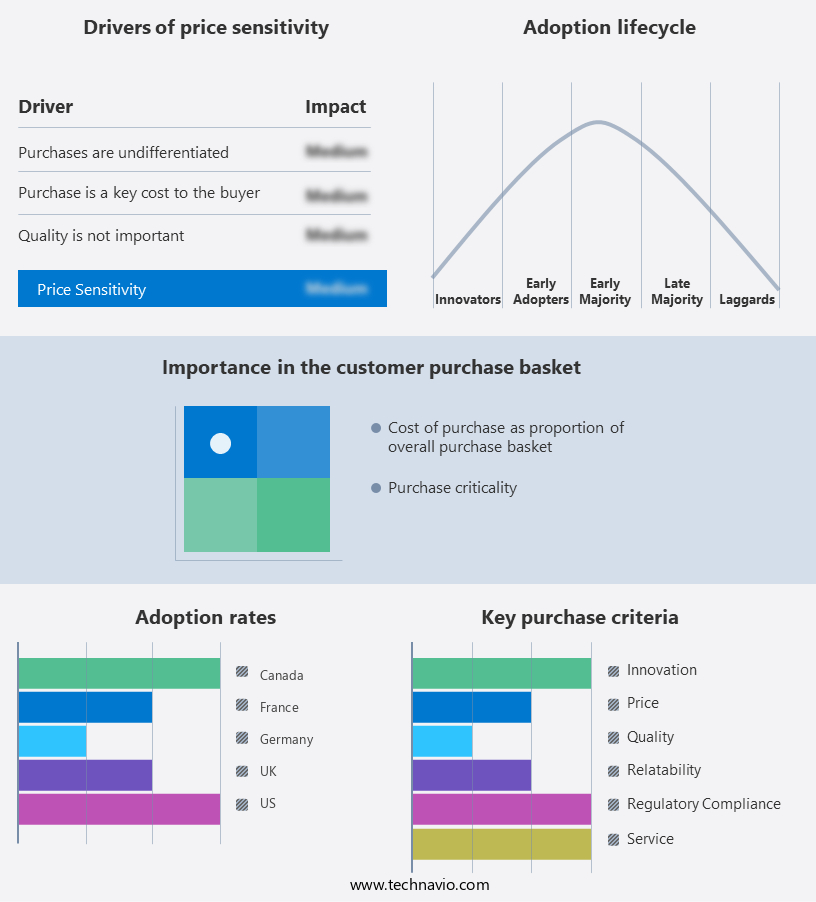
Customer Landscape
Key Companies & Market Insights
Companies are implementing various strategies, such as strategic alliances, sexual enhancement supplements market forecast, partnerships, mergers and acquisitions, geographical expansion, and product/service launches, to enhance their presence in the industry.
Ambic Ayurved India Pvt. Ltd. - This company specializes in providing sexual enhancement supplements, including fruit berry powders and multivitamin pills. Our offerings are meticulously formulated to support optimal sexual health and well-being. The fruit berry powders are rich in antioxidants and other essential nutrients, while the multivitamin pills provide a broad spectrum of vitamins and minerals. Our commitment to quality and innovation sets us apart in the market. These supplements are designed to enhance vitality and improve overall sexual performance. By incorporating these natural solutions into your daily routine, you can experience improved sexual health and confidence.
The industry research and growth report includes detailed analyses of the competitive landscape of the market and information about key companies, including:
- Ambic Ayurved India Pvt. Ltd.
- Atlantic Essential Products Inc.
- Aytu BioPharma Inc.
- BioFilm Inc.
- Church and Dwight Co. Inc.
- Cyanotech Corp.
- Dabur India Ltd.
- Doc Johnson Enterprises
- GNC Holdings LLC
- Good Clean Love Inc.
- Herbalife International of America Inc.
- Hi Tech Pharmaceuticals Inc.
- Himalaya Global Holdings Ltd.
- Leading Edge Health Inc.
- Lovehoney Group Ltd.
- NOW Foods
- Reckitt Benckiser Group Plc
- Vox Nutrition Inc.
- Walgreens Boots Alliance Inc.
Qualitative and quantitative analysis of companies has been conducted to help clients understand the wider business environment as well as the strengths and weaknesses of key industry players. Data is qualitatively analyzed to categorize companies as pure play, category-focused, industry-focused, and diversified; it is quantitatively analyzed to categorize companies as dominant, leading, strong, tentative, and weak.
Recent Development and News in Sexual Enhancement Supplements Market
- In February 2024, the leading player in the market, Vitality Biostics, announced the launch of its new product line, Vitality X, featuring a unique blend of natural ingredients and scientifically-backed aphrodisiacs. This expansion aimed to cater to the growing demand for all-natural and effective supplements (Vitality Biostics Press Release).
- In June 2025, Swiss Research Labs, a major player in the industry, entered into a strategic partnership with a leading pharmaceutical company, Merck KGaA, to develop and commercialize a novel line of sexual enhancement supplements. This collaboration was expected to bring significant advancements in the field, combining Swiss Research Labs' expertise in natural supplements with Merck KGaA's resources and research capabilities (Merck KGaA Press Release).
- In August 2024, a significant merger took place in the market as two major players, NaturaMarket and BioSynth, joined forces to create a global powerhouse in the sexual enhancement supplements industry. The combined entity, valued at over USD1 billion, was expected to dominate the market with its expanded product offerings and enhanced distribution network (Bloomberg News).
- In December 2025, the Food and Drug Administration (FDA) approved the use of a new ingredient, L-Arginine Max, in sexual enhancement supplements. This approval marked a significant milestone in the industry, as it represented the first new active ingredient to be approved in over a decade. The approval was expected to drive innovation and growth in the market, with numerous companies planning to incorporate L-Arginine Max into their product lines (FDA Press Release).
Research Analyst Overview
The market, encompassing male fertility and prostate health, premature ejaculation, and low libido, is experiencing significant evolution. Precision medicine and consumer education are driving trends, with an increasing focus on hormonal balance and natural testosterone production. Consumer advocacy groups are promoting responsible use and sexual health awareness. Industry associations are emphasizing supply chain integrity to combat product counterfeiting. Emerging technologies, such as artificial intelligence and digital therapeutics, are revolutionizing the sector. Personalized medicine and mobile applications are enabling bioavailability enhancement and sexual wellness. Female libido is gaining equal importance, with a growing emphasis on ethical sourcing and professional guidelines.
Sexual dysfunction treatments are integrating big data analytics and wearable technology for better outcomes. Digital health and online consultation services are making sexual health education and best practices more accessible. The market is adopting a holistic approach, focusing on sexual health and wellness, with a commitment to transparency and accountability. The future of the industry lies in the responsible use of emerging technologies and the integration of ethical business practices.
Dive into Technavio’s robust research methodology, blending expert interviews, extensive data synthesis, and validated models for unparalleled Sexual Enhancement Supplements Market insights. See full methodology.
|
Market Scope |
|
|
Report Coverage |
Details |
|
Page number |
206 |
|
Base year |
2024 |
|
Historic period |
2019-2023 |
|
Forecast period |
2025-2029 |
|
Growth momentum & CAGR |
Accelerate at a CAGR of 12.6% |
|
Market growth 2025-2029 |
USD 2095.5 million |
|
Market structure |
Fragmented |
|
YoY growth 2024-2025(%) |
10.8 |
|
Key countries |
US, China, Germany, UK, India, Canada, France, Japan, Italy, and Brazil |
|
Competitive landscape |
Leading Companies, Market Positioning of Companies, Competitive Strategies, and Industry Risks |
What are the Key Data Covered in this Sexual Enhancement Supplements Market Research and Growth Report?
- CAGR of the Sexual Enhancement Supplements industry during the forecast period
- Detailed information on factors that will drive the growth and forecasting between 2025 and 2029
- Precise estimation of the size of the market and its contribution of the industry in focus to the parent market
- Accurate predictions about upcoming growth and trends and changes in consumer behaviour
- Growth of the market across North America, Europe, Asia, and Rest of World (ROW)
- Thorough analysis of the market’s competitive landscape and detailed information about companies
- Comprehensive analysis of factors that will challenge the sexual enhancement supplements market growth of industry companies
We can help! Our analysts can customize this sexual enhancement supplements market research report to meet your requirements.
 RIA -
RIA - 
