Silica Gel Market Analysis, Size, and Forecast 2026-2030: APAC (China, India, and Japan), North America (US, Canada, and Mexico), Europe (Germany, France, and UK), South America (Brazil and Argentina), Middle East and Africa (Saudi Arabia, South Africa, and UAE), and Rest of World (ROW)

Silica Gel Market Analysis, Size, and Forecast 2026-2030:
APAC (China, India, and Japan), North America (US, Canada, and Mexico), Europe (Germany, France, and UK), South America (Brazil and Argentina), Middle East and Africa (Saudi Arabia, South Africa, and UAE), and Rest of World (ROW)

Published: Mar 2026 305 Pages SKU: IRTNTR74284

Market Overview at a Glance

$569.5 Mn
Market Opportunity
8.9%
CAGR 2025 - 2030
50.5%
APAC Growth
$248.9 Mn
Oil and gas industry segment 2024

Silica Gel Market Size 2026-2030

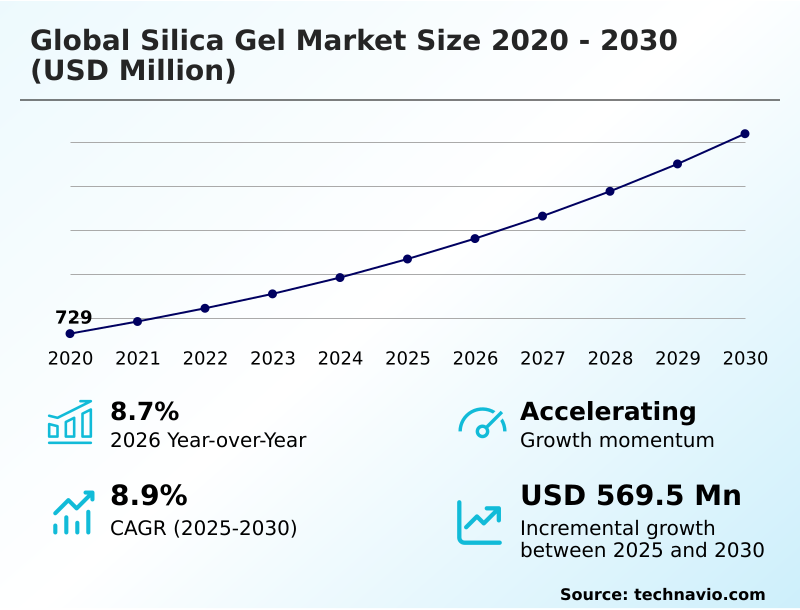
The silica gel market size is valued to increase by USD 569.5 million, at a CAGR of 8.9% from 2025 to 2030. Expanding demand for pharmaceutical purification and chromatography will drive the silica gel market.

Major Market Trends & Insights

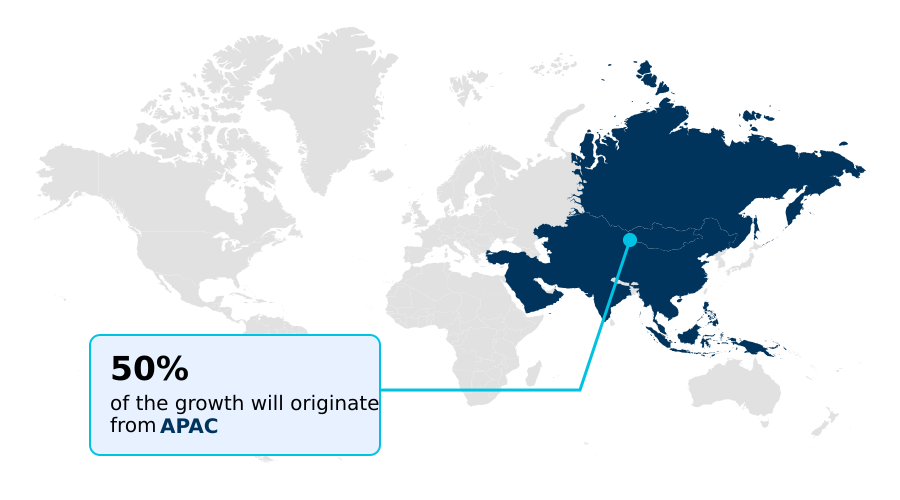
  • APAC dominated the market and accounted for a 50.5% growth during the forecast period.
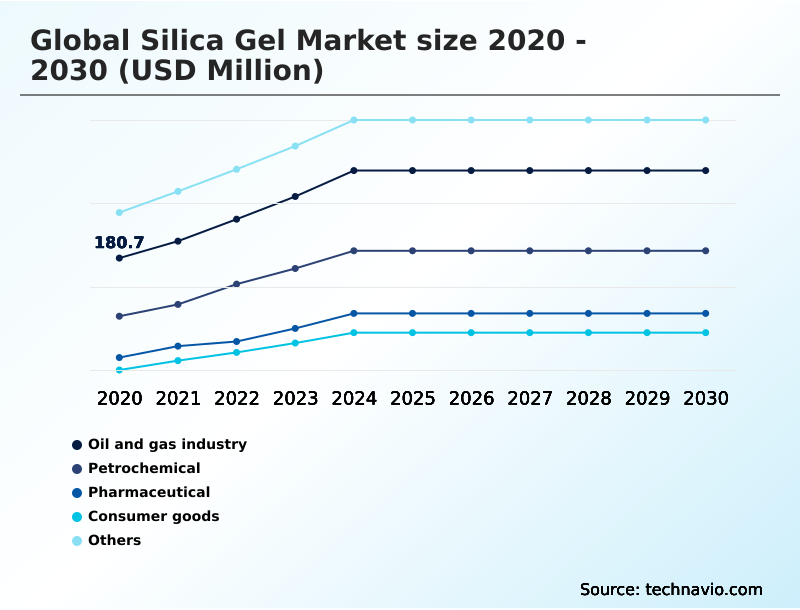
  • By Application - Oil and gas industry segment was valued at USD 248.9 million in 2024
  • By Product Type - Indicative silica gel segment accounted for the largest market revenue share in 2024

Market Size & Forecast

  • Market Opportunities: USD 908.7 million
  • Market Future Opportunities: USD 569.5 million
  • CAGR from 2025 to 2030 : 8.9%

Market Summary

  • The Silica Gel Market is defined by its critical role in moisture control and purification across high-stakes industries. As a premier industrial desiccant, its application extends from protecting sensitive electronics during shipment to ensuring the stability of life-saving pharmaceuticals.
  • Market dynamics are increasingly shaped by a dual focus on performance and sustainability, prompting a shift toward regenerable desiccants and bio-based silica formulations derived from agricultural byproducts. This pivot addresses both environmental regulations and the need for a circular economy. For instance, a logistics firm managing global pharmaceutical shipments must ensure product integrity across varied climates.
  • This requires deploying packaging solutions that combine high-purity silica for moisture adsorption capacity with non-toxic indicating silica gel alternatives for real-time monitoring, thereby preventing spoilage and ensuring compliance without compromising safety.
  • The challenge of balancing raw material volatility with the demand for advanced materials like those used in high-performance liquid chromatography continues to drive strategic innovation and asset optimization among leading producers.

What will be the Size of the Silica Gel Market during the forecast period?

Get Key Insights on Market Forecast (PDF) Request Free Sample

How is the Silica Gel Market Segmented?

The silica gel industry research report provides comprehensive data (region-wise segment analysis), with forecasts and estimates in "USD million" for the period 2026-2030, as well as historical data from 2020-2024 for the following segments.

  • Application
    • Oil and gas industry
    • Petrochemical
    • Pharmaceutical
    • Consumer goods
    • Others
  • Product type
    • Indicative silica gel
    • Non-indicative silica gel
  • Type
    • Coarse-pored silica gel
    • Mesoporous silica gel
    • Fine-pored silica gel
  • Geography
    • APAC
      • China
      • India
      • Japan
    • North America
      • US
      • Canada
      • Mexico
    • Europe
      • Germany
      • France
      • UK
    • South America
      • Brazil
      • Argentina
    • Middle East and Africa
      • Saudi Arabia
      • South Africa
      • UAE
    • Rest of World (ROW)

By Application Insights

The oil and gas industry segment is estimated to witness significant growth during the forecast period.

The oil and gas industry remains a vital application segment, where high-capacity desiccant materials are essential for ensuring the integrity of hydrocarbon streams.

The use of porous silicon dioxide prevents hydrate formation and equipment corrosion by effectively removing water vapor from natural gas, a process critical for maintaining fuel heating value.

This industrial desiccant application is crucial on offshore platforms, where compact, high-pressure moisture adsorption capacity is paramount. Firms have demonstrated success in improving operational safety, achieving a component failure reduction rate of nearly 15% through enhanced moisture control protocols.

The sector consistently demands regenerable desiccants to optimize production and reduce waste, driving innovation in catalyst carrier and moisture scavenger technologies for refining processes.

The focus remains on materials with a high surface area and controlled pore size distribution to maximize performance.

Request Free Sample

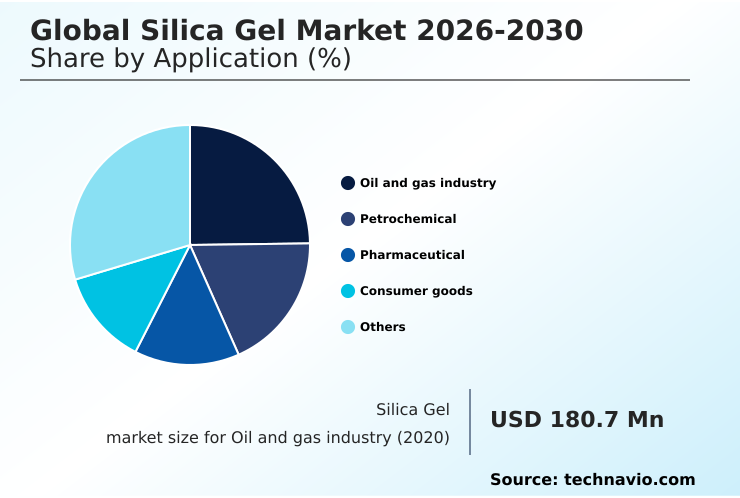
The Oil and gas industry segment was valued at USD 248.9 million in 2024 and showed a gradual increase during the forecast period.

Request Free Sample

Regional Analysis

APAC is estimated to contribute 50.5% to the growth of the global market during the forecast period.Technavio’s analysts have elaborately explained the regional trends and drivers that shape the market during the forecast period.

See How Silica Gel Market Demand is Rising in APAC Request Free Sample

The geographic landscape of the market is led by the APAC region, which is poised to contribute over 50% of the market's incremental growth.

This dominance is fueled by the region's expansive manufacturing base, particularly in the electronics and consumer goods sectors, which require robust moisture control solutions like container desiccants and humidity indicator cards.

In contrast, North America and Europe, which represent a combined share of nearly 40% of growth opportunities, are characterized by a demand for high-value applications.

These mature markets focus on high-purity silica for drug development and advanced materials for the green energy transition, including components for lithium-ion batteries.

This regional divergence highlights a global market where growth is driven by both high-volume industrial use and specialized, high-performance desiccant technologies.

Market Dynamics

Our researchers analyzed the data with 2025 as the base year, along with the key drivers, trends, and challenges. A holistic analysis of drivers will help companies refine their marketing strategies to gain a competitive advantage.

  • The strategic direction of the market is increasingly shaped by the need to balance performance with sustainability and cost-efficiency. The impact of raw material volatility on silica gel price has compelled producers to explore innovations in regenerable desiccants for the circular economy, reducing reliance on virgin inputs.
  • This includes the development of non-toxic indicating silica gel alternatives, moving away from traditional cobalt-based indicators to meet stringent health and safety standards. In parallel, the demand for high-purity silica for drug development continues to drive advancements in chromatographic separation media, enabling faster and more efficient purification of complex biopharmaceuticals.
  • Key applications of silica gel in electronics packaging, particularly for moisture-sensitive components, remain a cornerstone of the market. Furthermore, the role of silica gel in lithium-ion batteries is expanding as a critical component for performance and safety. To navigate this complex environment, companies are focusing on strategic asset optimization in the silica industry, consolidating production to improve efficiency.
  • This addresses not only cost pressures but also challenges in building a resilient silica gel supply chain. The ability to offer tailored solutions, such as silica gel for natural gas dehydration or as a stationary phase in chromatography, will define competitive advantage in the coming years, with market growth consistently outpacing general industrial expansion by several points.

What are the key market drivers leading to the rise in the adoption of Silica Gel Industry?

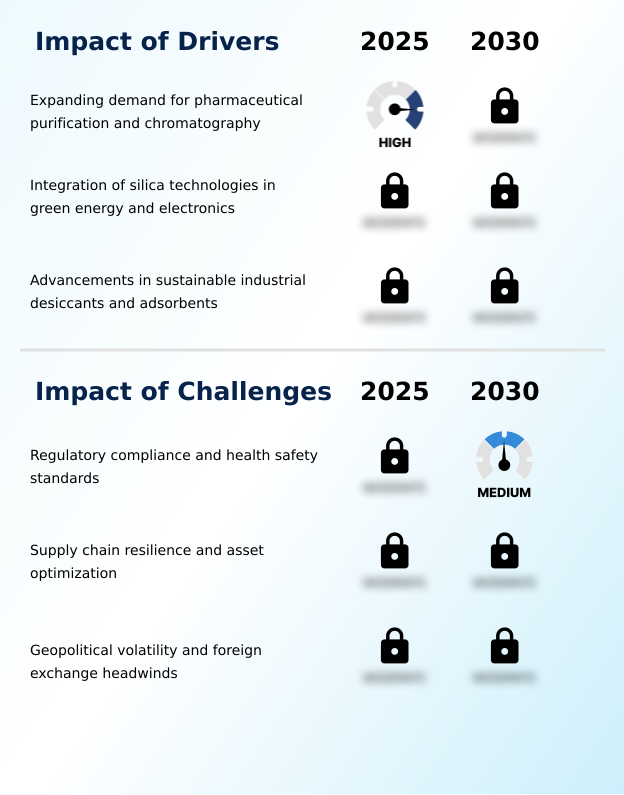
  • Expanding demand for high-purity silica gel in pharmaceutical purification and chromatography applications is a key driver of market growth.

  • Market growth is propelled by escalating demand from high-tech and regulated industries. The pharmaceutical sector's need for advanced purification media, particularly high-purity silica for chromatography, serves as a primary driver, with overall market expansion reaching an 8.7% year-over-year increase.
  • Simultaneously, the green energy transition is creating new opportunities, where silica gel is a critical component in lithium-ion batteries and as a protective industrial desiccant for moisture-sensitive electronics.
  • Strategic corporate initiatives, such as the formation of new business units involving over 3,500 employees to focus on sustainable technologies, highlight the industry's commitment to these growth areas.
  • The continuous push for eco-friendly solutions, including sustainable industrial adsorbents, further strengthens market expansion by aligning products with global environmental goals.

What are the market trends shaping the Silica Gel Industry?

  • A strategic pivot toward high-purity, bio-based silica formulations is emerging as a significant market trend. This shift is driven by the demand for sustainable materials derived from renewable sources.

  • Key trends are reshaping the market, primarily through a strategic pivot toward sustainable and high-performance materials. The development of bio-based silica formulations is gaining significant momentum, with adoption rates in some sectors increasing by as much as 18% as companies seek to reduce their carbon footprint.
  • This shift toward a circular economy model is complemented by the advancement of regenerable desiccants that lower industrial waste. Concurrently, the demand for specialized chromatography media continues to grow, driven by the biopharmaceutical industry's need for high-purity silica for drug development.
  • These materials, featuring precisely controlled pore structures, enable sharper separations and higher yields in complex purification processes, underscoring the industry's move toward technical differentiation and high-value applications.

What challenges does the Silica Gel Industry face during its growth?

  • Adherence to increasingly stringent regulatory compliance and health safety standards presents a key challenge affecting industry growth.

  • The market navigates a complex landscape of operational and economic challenges. Stringent regulatory compliance, particularly in health and safety, forces companies to invest heavily in protective measures, with top-tier firms targeting safety incident rates as low as 0.13 to ensure workforce protection. This increases operational costs and requires the development of non-toxic indicating silica gel alternatives.
  • Concurrently, geopolitical volatility creates significant financial headwinds, as evidenced by one major player reporting a 3.7% revenue loss due to foreign exchange fluctuations. These pressures are compelling companies to undertake strategic asset optimization, including plant closures and consolidation, to maintain a resilient silica gel supply chain amidst fluctuating raw material prices and logistical complexities.

Exclusive Technavio Analysis on Customer Landscape

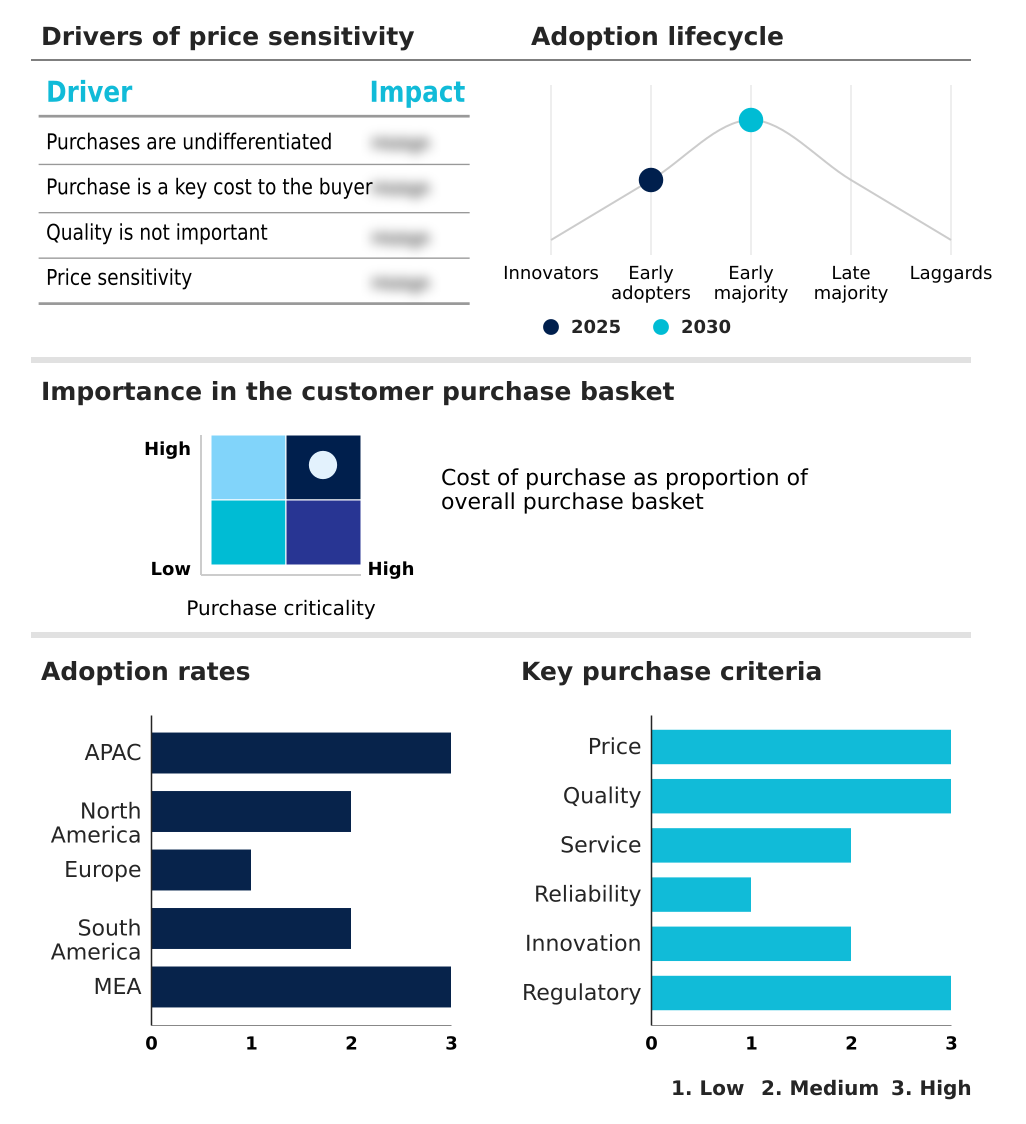
The silica gel market forecasting report includes the adoption lifecycle of the market, covering from the innovator’s stage to the laggard’s stage. It focuses on adoption rates in different regions based on penetration. Furthermore, the silica gel market report also includes key purchase criteria and drivers of price sensitivity to help companies evaluate and develop their market growth analysis strategies.

Customer Landscape of Silica Gel Industry

Competitive Landscape

Companies are implementing various strategies, such as strategic alliances, silica gel market forecast, partnerships, mergers and acquisitions, geographical expansion, and product/service launches, to enhance their presence in the industry.

AGC Inc. - Offers high-purity precipitated silica and industrial desiccants for critical catalyst and moisture control applications within industrial and manufacturing sectors.

The industry research and growth report includes detailed analyses of the competitive landscape of the market and information about key companies, including:

  • AGC Inc.
  • BASF SE
  • Capitol Scientific Inc.
  • Cilicant Pvt. Ltd.
  • Clariant International Ltd.
  • Desiccare Inc.
  • Ecovyst Inc.
  • Evonik Industries AG
  • FUJI SILYSIA CHEMICAL LTD.
  • GeeJay Chemicals Ltd.
  • HengYe Inc.
  • International Silica Gel Co. Ltd.
  • Merck KGaA
  • Natland International Corp.
  • Nouryon Chemicals Holding B.V.
  • OSAKA SODA CO. Ltd.
  • Shandong Sinchem Silica Gel Co. Ltd.
  • SiliCycle Inc.
  • Solvay SA
  • Thermo Fisher Scientific Inc.

Qualitative and quantitative analysis of companies has been conducted to help clients understand the wider business environment as well as the strengths and weaknesses of key industry players. Data is qualitatively analyzed to categorize companies as pure play, category-focused, industry-focused, and diversified; it is quantitatively analyzed to categorize companies as dominant, leading, strong, tentative, and weak.

Recent Development and News in Silica gel market

  • In September, 2024, Nouryon completed a production capacity expansion of nearly 50% for its colloidal silica products at its manufacturing facility in Green Bay, Wisconsin, to meet rising demand from the battery and semiconductor sectors.
  • In January, 2025, Evonik Industries AG launched its new Smart Effects business line by merging its silica and silanes units, a division of approximately 3,500 employees, to deliver specialized solutions for green energy and electronics.
  • In February, 2025, W. R. Grace and Company completed the acquisition of a specialized silica corporation, strategically expanding its portfolio of desiccant materials for diverse industrial applications.
  • In April, 2025, Merck KGaA announced a definitive agreement to acquire the chromatography business of JSR Life Sciences, a move designed to enhance its downstream processing capabilities for the biopharmaceutical sector.

Dive into Technavio’s robust research methodology, blending expert interviews, extensive data synthesis, and validated models for unparalleled Silica Gel Market insights. See full methodology.

Market Scope
Page number 305
Base year 2025
Historic period 2020-2024
Forecast period 2026-2030
Growth momentum & CAGR Accelerate at a CAGR of 8.9%
Market growth 2026-2030 USD 569.5 million
Market structure Fragmented
YoY growth 2025-2026(%) 8.7%
Key countries China, India, Japan, South Korea, Australia, Singapore, US, Canada, Mexico, Germany, France, UK, Italy, Spain, The Netherlands, Brazil, Argentina, Chile, Saudi Arabia, South Africa, UAE, Egypt and Nigeria
Competitive landscape Leading Companies, Market Positioning of Companies, Competitive Strategies, and Industry Risks

Request Free Sample

Research Analyst Overview

  • The market is undergoing a significant transformation, driven by the convergence of advanced material science and stringent industrial requirements. The emphasis is on developing products that offer superior moisture adsorption capacity while adhering to global sustainability mandates, such as the development of cobalt-free indicators.
  • This has led to innovations in porous silicon dioxide, with producers engineering materials with a specific pore size distribution and high surface area to serve as an effective moisture scavenger and catalyst carrier. The industry's commitment to safety is evident in efforts to maintain low incident rates, with leading firms achieving a days-away-from-work rate below 0.15 through rigorous protocols.
  • In high-value sectors, chromatography stationary phase materials are being refined for high-performance liquid chromatography (HPLC) and thin-layer chromatography (TLC). The utility of indicating silica gel and non-indicating silica gel as industrial desiccants remains foundational, but the future lies in functionalized materials like fine-pored and coarse-pored silica gel for specialized applications, including as a clarifying agent and in desiccant packaging.
  • This evolution demands a strategic focus on both commodity and specialty product lines.

What are the Key Data Covered in this Silica Gel Market Research and Growth Report?

  • What is the expected growth of the Silica Gel Market between 2026 and 2030?

    • USD 569.5 million, at a CAGR of 8.9%

  • What segmentation does the market report cover?

    • The report is segmented by Application (Oil and gas industry, Petrochemical, Pharmaceutical, Consumer goods, and Others), Product Type (Indicative silica gel, and Non-indicative silica gel), Type (Coarse-pored silica gel, Mesoporous silica gel, and Fine-pored silica gel) and Geography (APAC, North America, Europe, South America, Middle East and Africa)

  • Which regions are analyzed in the report?

    • APAC, North America, Europe, South America and Middle East and Africa

  • What are the key growth drivers and market challenges?

    • Expanding demand for pharmaceutical purification and chromatography, Regulatory compliance and health safety standards

  • Who are the major players in the Silica Gel Market?

    • AGC Inc., BASF SE, Capitol Scientific Inc., Cilicant Pvt. Ltd., Clariant International Ltd., Desiccare Inc., Ecovyst Inc., Evonik Industries AG, FUJI SILYSIA CHEMICAL LTD., GeeJay Chemicals Ltd., HengYe Inc., International Silica Gel Co. Ltd., Merck KGaA, Natland International Corp., Nouryon Chemicals Holding B.V., OSAKA SODA CO. Ltd., Shandong Sinchem Silica Gel Co. Ltd., SiliCycle Inc., Solvay SA and Thermo Fisher Scientific Inc.

Market Research Insights

  • Market dynamics are increasingly influenced by strategic asset optimization and a focus on high-value applications. Corporate restructuring has led to the consolidation of production into more efficient regional hubs, improving supply resilience for key sectors like automotive and pharmaceuticals. This trend is complemented by a consistent year-over-year market expansion of approximately 8.7%, driven by innovation in sustainable materials.
  • For example, the adoption of bio-based silica has surged by 18% in some regions, reflecting a strong industry-wide push toward greener manufacturing processes. These shifts underscore a competitive landscape where companies are differentiating through technological advancements in purification media and eco-friendly desiccants, aligning their portfolios with the growing demand for both performance and environmental responsibility.

We can help! Our analysts can customize this silica gel market research report to meet your requirements.

Get in touch

1. Executive Summary

1.1 Market overview

Executive Summary - Chart on Market Overview
Executive Summary - Data Table on Market Overview
Executive Summary - Chart on Global Market Characteristics
Executive Summary - Chart on Market by Geography
Executive Summary - Chart on Market Segmentation by Application
Executive Summary - Chart on Market Segmentation by Product Type
Executive Summary - Chart on Market Segmentation by Type
Executive Summary - Chart on Incremental Growth
Executive Summary - Data Table on Incremental Growth
Executive Summary - Chart on Company Market Positioning

2. Technavio Analysis

2.1 Analysis of price sensitivity, lifecycle, customer purchase basket, adoption rates, and purchase criteria

2.2 Criticality of inputs and Factors of differentiation

Chart on Overview on criticality of inputs and factors of differentiation

2.3 Factors of disruption

Chart on Overview on factors of disruption

2.4 Impact of drivers and challenges

Chart on Impact of drivers and challenges in 2025 and 2030

3. Market Landscape

3.1 Market ecosystem

Chart on Parent Market
Data Table on - Parent Market

3.2 Market characteristics

Chart on Market characteristics analysis

3.3 Value chain analysis

Chart on Value chain analysis

4. Market Sizing

4.1 Market definition

Data Table on Offerings of companies included in the market definition

4.2 Market segment analysis

Market segments

4.3 Market size 2025

4.4 Market outlook: Forecast for 2025-2030

Chart on Global - Market size and forecast 2025-2030 ($ million)
Data Table on Global - Market size and forecast 2025-2030 ($ million)
Chart on Global Market: Year-over-year growth 2025-2030 (%)
Data Table on Global Market: Year-over-year growth 2025-2030 (%)

5. Historic Market Size

5.1 Global Silica Gel Market 2020 - 2024

Historic Market Size - Data Table on Global Silica Gel Market 2020 - 2024 ($ million)

5.2 Application segment analysis 2020 - 2024

Historic Market Size - Application Segment 2020 - 2024 ($ million)

5.3 Product Type segment analysis 2020 - 2024

Historic Market Size - Product Type Segment 2020 - 2024 ($ million)

5.4 Type segment analysis 2020 - 2024

Historic Market Size - Type Segment 2020 - 2024 ($ million)

5.5 Geography segment analysis 2020 - 2024

Historic Market Size - Geography Segment 2020 - 2024 ($ million)

5.6 Country segment analysis 2020 - 2024

Historic Market Size - Country Segment 2020 - 2024 ($ million)

6. Qualitative Analysis

6.1 Impact of AI on Global Silica Gel Market

6.2 Impact of geopolitical conflicts on Global Silica Gel Market

7. Five Forces Analysis

7.1 Five forces summary

Five forces analysis - Comparison between 2025 and 2030

7.2 Bargaining power of buyers

Bargaining power of buyers - Impact of key factors 2025 and 2030

7.3 Bargaining power of suppliers

Bargaining power of suppliers - Impact of key factors in 2025 and 2030

7.4 Threat of new entrants

Threat of new entrants - Impact of key factors in 2025 and 2030

7.5 Threat of substitutes

Threat of substitutes - Impact of key factors in 2025 and 2030

7.6 Threat of rivalry

Threat of rivalry - Impact of key factors in 2025 and 2030

7.7 Market condition

Chart on Market condition - Five forces 2025 and 2030

8. Market Segmentation by Application

8.1 Market segments

Chart on Application - Market share 2025-2030 (%)
Data Table on Application - Market share 2025-2030 (%)

8.2 Comparison by Application

Chart on Comparison by Application
Data Table on Comparison by Application

8.3 Oil and gas industry - Market size and forecast 2025-2030

Chart on Oil and gas industry - Market size and forecast 2025-2030 ($ million)
Data Table on Oil and gas industry - Market size and forecast 2025-2030 ($ million)
Chart on Oil and gas industry - Year-over-year growth 2025-2030 (%)
Data Table on Oil and gas industry - Year-over-year growth 2025-2030 (%)

8.4 Petrochemical - Market size and forecast 2025-2030

Chart on Petrochemical - Market size and forecast 2025-2030 ($ million)
Data Table on Petrochemical - Market size and forecast 2025-2030 ($ million)
Chart on Petrochemical - Year-over-year growth 2025-2030 (%)
Data Table on Petrochemical - Year-over-year growth 2025-2030 (%)

8.5 Pharmaceutical - Market size and forecast 2025-2030

Chart on Pharmaceutical - Market size and forecast 2025-2030 ($ million)
Data Table on Pharmaceutical - Market size and forecast 2025-2030 ($ million)
Chart on Pharmaceutical - Year-over-year growth 2025-2030 (%)
Data Table on Pharmaceutical - Year-over-year growth 2025-2030 (%)

8.6 Consumer goods - Market size and forecast 2025-2030

Chart on Consumer goods - Market size and forecast 2025-2030 ($ million)
Data Table on Consumer goods - Market size and forecast 2025-2030 ($ million)
Chart on Consumer goods - Year-over-year growth 2025-2030 (%)
Data Table on Consumer goods - Year-over-year growth 2025-2030 (%)

8.7 Others - Market size and forecast 2025-2030

Chart on Others - Market size and forecast 2025-2030 ($ million)
Data Table on Others - Market size and forecast 2025-2030 ($ million)
Chart on Others - Year-over-year growth 2025-2030 (%)
Data Table on Others - Year-over-year growth 2025-2030 (%)

8.8 Market opportunity by Application

Market opportunity by Application ($ million)
Data Table on Market opportunity by Application ($ million)

9. Market Segmentation by Product Type

9.1 Market segments

Chart on Product Type - Market share 2025-2030 (%)
Data Table on Product Type - Market share 2025-2030 (%)

9.2 Comparison by Product Type

Chart on Comparison by Product Type
Data Table on Comparison by Product Type

9.3 Indicative silica gel - Market size and forecast 2025-2030

Chart on Indicative silica gel - Market size and forecast 2025-2030 ($ million)
Data Table on Indicative silica gel - Market size and forecast 2025-2030 ($ million)
Chart on Indicative silica gel - Year-over-year growth 2025-2030 (%)
Data Table on Indicative silica gel - Year-over-year growth 2025-2030 (%)

9.4 Non-indicative silica gel - Market size and forecast 2025-2030

Chart on Non-indicative silica gel - Market size and forecast 2025-2030 ($ million)
Data Table on Non-indicative silica gel - Market size and forecast 2025-2030 ($ million)
Chart on Non-indicative silica gel - Year-over-year growth 2025-2030 (%)
Data Table on Non-indicative silica gel - Year-over-year growth 2025-2030 (%)

9.5 Market opportunity by Product Type

Market opportunity by Product Type ($ million)
Data Table on Market opportunity by Product Type ($ million)

10. Market Segmentation by Type

10.1 Market segments

Chart on Type - Market share 2025-2030 (%)
Data Table on Type - Market share 2025-2030 (%)

10.2 Comparison by Type

Chart on Comparison by Type
Data Table on Comparison by Type

10.3 Coarse-pored silica gel - Market size and forecast 2025-2030

Chart on Coarse-pored silica gel - Market size and forecast 2025-2030 ($ million)
Data Table on Coarse-pored silica gel - Market size and forecast 2025-2030 ($ million)
Chart on Coarse-pored silica gel - Year-over-year growth 2025-2030 (%)
Data Table on Coarse-pored silica gel - Year-over-year growth 2025-2030 (%)

10.4 Mesoporous silica gel - Market size and forecast 2025-2030

Chart on Mesoporous silica gel - Market size and forecast 2025-2030 ($ million)
Data Table on Mesoporous silica gel - Market size and forecast 2025-2030 ($ million)
Chart on Mesoporous silica gel - Year-over-year growth 2025-2030 (%)
Data Table on Mesoporous silica gel - Year-over-year growth 2025-2030 (%)

10.5 Fine-pored silica gel - Market size and forecast 2025-2030

Chart on Fine-pored silica gel - Market size and forecast 2025-2030 ($ million)
Data Table on Fine-pored silica gel - Market size and forecast 2025-2030 ($ million)
Chart on Fine-pored silica gel - Year-over-year growth 2025-2030 (%)
Data Table on Fine-pored silica gel - Year-over-year growth 2025-2030 (%)

10.6 Market opportunity by Type

Market opportunity by Type ($ million)
Data Table on Market opportunity by Type ($ million)

11. Customer Landscape

11.1 Customer landscape overview

Analysis of price sensitivity, lifecycle, customer purchase basket, adoption rates, and purchase criteria

12. Geographic Landscape

12.1 Geographic segmentation

Chart on Market share by geography 2025-2030 (%)
Data Table on Market share by geography 2025-2030 (%)

12.2 Geographic comparison

Chart on Geographic comparison
Data Table on Geographic comparison

12.3 APAC - Market size and forecast 2025-2030

Chart on APAC - Market size and forecast 2025-2030 ($ million)
Data Table on APAC - Market size and forecast 2025-2030 ($ million)
Chart on APAC - Year-over-year growth 2025-2030 (%)
Data Table on APAC - Year-over-year growth 2025-2030 (%)
Chart on Regional Comparison - APAC
Data Table on Regional Comparison - APAC

12.3.1 China - Market size and forecast 2025-2030

Chart on China - Market size and forecast 2025-2030 ($ million)
Data Table on China - Market size and forecast 2025-2030 ($ million)
Chart on China - Year-over-year growth 2025-2030 (%)
Data Table on China - Year-over-year growth 2025-2030 (%)

12.3.2 India - Market size and forecast 2025-2030

Chart on India - Market size and forecast 2025-2030 ($ million)
Data Table on India - Market size and forecast 2025-2030 ($ million)
Chart on India - Year-over-year growth 2025-2030 (%)
Data Table on India - Year-over-year growth 2025-2030 (%)

12.3.3 Japan - Market size and forecast 2025-2030

Chart on Japan - Market size and forecast 2025-2030 ($ million)
Data Table on Japan - Market size and forecast 2025-2030 ($ million)
Chart on Japan - Year-over-year growth 2025-2030 (%)
Data Table on Japan - Year-over-year growth 2025-2030 (%)

12.3.4 South Korea - Market size and forecast 2025-2030

Chart on South Korea - Market size and forecast 2025-2030 ($ million)
Data Table on South Korea - Market size and forecast 2025-2030 ($ million)
Chart on South Korea - Year-over-year growth 2025-2030 (%)
Data Table on South Korea - Year-over-year growth 2025-2030 (%)

12.3.5 Australia - Market size and forecast 2025-2030

Chart on Australia - Market size and forecast 2025-2030 ($ million)
Data Table on Australia - Market size and forecast 2025-2030 ($ million)
Chart on Australia - Year-over-year growth 2025-2030 (%)
Data Table on Australia - Year-over-year growth 2025-2030 (%)

12.3.6 Singapore - Market size and forecast 2025-2030

Chart on Singapore - Market size and forecast 2025-2030 ($ million)
Data Table on Singapore - Market size and forecast 2025-2030 ($ million)
Chart on Singapore - Year-over-year growth 2025-2030 (%)
Data Table on Singapore - Year-over-year growth 2025-2030 (%)

12.4 North America - Market size and forecast 2025-2030

Chart on North America - Market size and forecast 2025-2030 ($ million)
Data Table on North America - Market size and forecast 2025-2030 ($ million)
Chart on North America - Year-over-year growth 2025-2030 (%)
Data Table on North America - Year-over-year growth 2025-2030 (%)
Chart on Regional Comparison - North America
Data Table on Regional Comparison - North America

12.4.1 US - Market size and forecast 2025-2030

Chart on US - Market size and forecast 2025-2030 ($ million)
Data Table on US - Market size and forecast 2025-2030 ($ million)
Chart on US - Year-over-year growth 2025-2030 (%)
Data Table on US - Year-over-year growth 2025-2030 (%)

12.4.2 Canada - Market size and forecast 2025-2030

Chart on Canada - Market size and forecast 2025-2030 ($ million)
Data Table on Canada - Market size and forecast 2025-2030 ($ million)
Chart on Canada - Year-over-year growth 2025-2030 (%)
Data Table on Canada - Year-over-year growth 2025-2030 (%)

12.4.3 Mexico - Market size and forecast 2025-2030

Chart on Mexico - Market size and forecast 2025-2030 ($ million)
Data Table on Mexico - Market size and forecast 2025-2030 ($ million)
Chart on Mexico - Year-over-year growth 2025-2030 (%)
Data Table on Mexico - Year-over-year growth 2025-2030 (%)

12.5 Europe - Market size and forecast 2025-2030

Chart on Europe - Market size and forecast 2025-2030 ($ million)
Data Table on Europe - Market size and forecast 2025-2030 ($ million)
Chart on Europe - Year-over-year growth 2025-2030 (%)
Data Table on Europe - Year-over-year growth 2025-2030 (%)
Chart on Regional Comparison - Europe
Data Table on Regional Comparison - Europe

12.5.1 Germany - Market size and forecast 2025-2030

Chart on Germany - Market size and forecast 2025-2030 ($ million)
Data Table on Germany - Market size and forecast 2025-2030 ($ million)
Chart on Germany - Year-over-year growth 2025-2030 (%)
Data Table on Germany - Year-over-year growth 2025-2030 (%)

12.5.2 France - Market size and forecast 2025-2030

Chart on France - Market size and forecast 2025-2030 ($ million)
Data Table on France - Market size and forecast 2025-2030 ($ million)
Chart on France - Year-over-year growth 2025-2030 (%)
Data Table on France - Year-over-year growth 2025-2030 (%)

12.5.3 UK - Market size and forecast 2025-2030

Chart on UK - Market size and forecast 2025-2030 ($ million)
Data Table on UK - Market size and forecast 2025-2030 ($ million)
Chart on UK - Year-over-year growth 2025-2030 (%)
Data Table on UK - Year-over-year growth 2025-2030 (%)

12.5.4 Italy - Market size and forecast 2025-2030

Chart on Italy - Market size and forecast 2025-2030 ($ million)
Data Table on Italy - Market size and forecast 2025-2030 ($ million)
Chart on Italy - Year-over-year growth 2025-2030 (%)
Data Table on Italy - Year-over-year growth 2025-2030 (%)

12.5.5 Spain - Market size and forecast 2025-2030

Chart on Spain - Market size and forecast 2025-2030 ($ million)
Data Table on Spain - Market size and forecast 2025-2030 ($ million)
Chart on Spain - Year-over-year growth 2025-2030 (%)
Data Table on Spain - Year-over-year growth 2025-2030 (%)

12.5.6 The Netherlands - Market size and forecast 2025-2030

Chart on The Netherlands - Market size and forecast 2025-2030 ($ million)
Data Table on The Netherlands - Market size and forecast 2025-2030 ($ million)
Chart on The Netherlands - Year-over-year growth 2025-2030 (%)
Data Table on The Netherlands - Year-over-year growth 2025-2030 (%)

12.6 South America - Market size and forecast 2025-2030

Chart on South America - Market size and forecast 2025-2030 ($ million)
Data Table on South America - Market size and forecast 2025-2030 ($ million)
Chart on South America - Year-over-year growth 2025-2030 (%)
Data Table on South America - Year-over-year growth 2025-2030 (%)
Chart on Regional Comparison - South America
Data Table on Regional Comparison - South America

12.6.1 Brazil - Market size and forecast 2025-2030

Chart on Brazil - Market size and forecast 2025-2030 ($ million)
Data Table on Brazil - Market size and forecast 2025-2030 ($ million)
Chart on Brazil - Year-over-year growth 2025-2030 (%)
Data Table on Brazil - Year-over-year growth 2025-2030 (%)

12.6.2 Argentina - Market size and forecast 2025-2030

Chart on Argentina - Market size and forecast 2025-2030 ($ million)
Data Table on Argentina - Market size and forecast 2025-2030 ($ million)
Chart on Argentina - Year-over-year growth 2025-2030 (%)
Data Table on Argentina - Year-over-year growth 2025-2030 (%)

12.6.3 Chile - Market size and forecast 2025-2030

Chart on Chile - Market size and forecast 2025-2030 ($ million)
Data Table on Chile - Market size and forecast 2025-2030 ($ million)
Chart on Chile - Year-over-year growth 2025-2030 (%)
Data Table on Chile - Year-over-year growth 2025-2030 (%)

12.7 Middle East and Africa - Market size and forecast 2025-2030

Chart on Middle East and Africa - Market size and forecast 2025-2030 ($ million)
Data Table on Middle East and Africa - Market size and forecast 2025-2030 ($ million)
Chart on Middle East and Africa - Year-over-year growth 2025-2030 (%)
Data Table on Middle East and Africa - Year-over-year growth 2025-2030 (%)
Chart on Regional Comparison - Middle East and Africa
Data Table on Regional Comparison - Middle East and Africa

12.7.1 Saudi Arabia - Market size and forecast 2025-2030

Chart on Saudi Arabia - Market size and forecast 2025-2030 ($ million)
Data Table on Saudi Arabia - Market size and forecast 2025-2030 ($ million)
Chart on Saudi Arabia - Year-over-year growth 2025-2030 (%)
Data Table on Saudi Arabia - Year-over-year growth 2025-2030 (%)

12.7.2 South Africa - Market size and forecast 2025-2030

Chart on South Africa - Market size and forecast 2025-2030 ($ million)
Data Table on South Africa - Market size and forecast 2025-2030 ($ million)
Chart on South Africa - Year-over-year growth 2025-2030 (%)
Data Table on South Africa - Year-over-year growth 2025-2030 (%)

12.7.3 UAE - Market size and forecast 2025-2030

Chart on UAE - Market size and forecast 2025-2030 ($ million)
Data Table on UAE - Market size and forecast 2025-2030 ($ million)
Chart on UAE - Year-over-year growth 2025-2030 (%)
Data Table on UAE - Year-over-year growth 2025-2030 (%)

12.7.4 Egypt - Market size and forecast 2025-2030

Chart on Egypt - Market size and forecast 2025-2030 ($ million)
Data Table on Egypt - Market size and forecast 2025-2030 ($ million)
Chart on Egypt - Year-over-year growth 2025-2030 (%)
Data Table on Egypt - Year-over-year growth 2025-2030 (%)

12.7.5 Nigeria - Market size and forecast 2025-2030

Chart on Nigeria - Market size and forecast 2025-2030 ($ million)
Data Table on Nigeria - Market size and forecast 2025-2030 ($ million)
Chart on Nigeria - Year-over-year growth 2025-2030 (%)
Data Table on Nigeria - Year-over-year growth 2025-2030 (%)

12.8 Market opportunity by geography

Market opportunity by geography ($ million)
Data Tables on Market opportunity by geography ($ million)

13. Drivers, Challenges, and Opportunity

13.1 Market drivers

Expanding demand for pharmaceutical purification and chromatography
Integration of silica technologies in green energy and electronics
Advancements in sustainable industrial desiccants and adsorbents

13.2 Market challenges

Regulatory compliance and health safety standards
Supply chain resilience and asset optimization
Geopolitical volatility and foreign exchange headwinds

13.3 Impact of drivers and challenges

Impact of drivers and challenges in 2025 and 2030

13.4 Market opportunities

Strategic pivot toward high purity bio based silica formulations
Advancement of specialized chromatography and pharmaceutical purification
Operational consolidation and regional asset optimization

14. Competitive Landscape

14.1 Overview

14.2

Overview on criticality of inputs and factors of differentiation

14.3 Landscape disruption

Overview on factors of disruption

14.4 Industry risks

Impact of key risks on business

15. Competitive Analysis

15.1 Companies profiled

Companies covered

15.2 Company ranking index

15.3 Market positioning of companies

Matrix on companies position and classification

15.4 AGC Inc.

AGC Inc. - Overview
AGC Inc. - Business segments
AGC Inc. - Key news
AGC Inc. - Key offerings
AGC Inc. - Segment focus
SWOT

15.5 BASF SE

BASF SE - Overview
BASF SE - Business segments
BASF SE - Key news
BASF SE - Key offerings
BASF SE - Segment focus
SWOT

15.6 Capitol Scientific Inc.

Capitol Scientific Inc. - Overview
Capitol Scientific Inc. - Product / Service
Capitol Scientific Inc. - Key offerings
SWOT

15.7 Clariant International Ltd.

Clariant International Ltd. - Overview
Clariant International Ltd. - Business segments
Clariant International Ltd. - Key news
Clariant International Ltd. - Key offerings
Clariant International Ltd. - Segment focus
SWOT

15.8 Desiccare Inc.

Desiccare Inc. - Overview
Desiccare Inc. - Product / Service
Desiccare Inc. - Key offerings
SWOT

15.9 Ecovyst Inc.

Ecovyst Inc. - Overview
Ecovyst Inc. - Business segments
Ecovyst Inc. - Key offerings
Ecovyst Inc. - Segment focus
SWOT

15.10 FUJI SILYSIA CHEMICAL LTD.

FUJI SILYSIA CHEMICAL LTD. - Overview
FUJI SILYSIA CHEMICAL LTD. - Product / Service
FUJI SILYSIA CHEMICAL LTD. - Key offerings
SWOT

15.11 GeeJay Chemicals Ltd.

GeeJay Chemicals Ltd. - Overview
GeeJay Chemicals Ltd. - Product / Service
GeeJay Chemicals Ltd. - Key offerings
SWOT

15.12 HengYe Inc.

HengYe Inc. - Overview
HengYe Inc. - Product / Service
HengYe Inc. - Key offerings
SWOT

15.13 Merck KGaA

Merck KGaA - Overview
Merck KGaA - Business segments
Merck KGaA - Key news
Merck KGaA - Key offerings
Merck KGaA - Segment focus
SWOT

15.14 OSAKA SODA CO. Ltd.

OSAKA SODA CO. Ltd. - Overview
OSAKA SODA CO. Ltd. - Business segments
OSAKA SODA CO. Ltd. - Key offerings
OSAKA SODA CO. Ltd. - Segment focus
SWOT

15.15 Shandong Sinchem Silica Gel Co. Ltd.

Shandong Sinchem Silica Gel Co. Ltd. - Overview
Shandong Sinchem Silica Gel Co. Ltd. - Product / Service
Shandong Sinchem Silica Gel Co. Ltd. - Key offerings
SWOT

15.16 SiliCycle Inc.

SiliCycle Inc. - Overview
SiliCycle Inc. - Product / Service
SiliCycle Inc. - Key offerings
SWOT

15.17 Solvay SA

Solvay SA - Overview
Solvay SA - Business segments
Solvay SA - Key news
Solvay SA - Key offerings
Solvay SA - Segment focus
SWOT

15.18 Thermo Fisher Scientific Inc.

Thermo Fisher Scientific Inc. - Overview
Thermo Fisher Scientific Inc. - Business segments
Thermo Fisher Scientific Inc. - Key news
Thermo Fisher Scientific Inc. - Key offerings
Thermo Fisher Scientific Inc. - Segment focus
SWOT

16. Appendix

16.1 Scope of the report

Market definition
Objectives
Notes and caveats

16.2 Inclusions and exclusions checklist

Inclusions checklist
Exclusions checklist

16.3 Currency conversion rates for US$

16.4 Research methodology

16.5 Data procurement

Information sources

16.6 Data validation

16.7 Validation techniques employed for market sizing

16.8 Data synthesis

16.9 360 degree market analysis

16.10 List of abbreviations

Research Methodology

Technavio presents a detailed picture of the market by way of study, synthesis, and summation of data from multiple sources. The analysts have presented the various facets of the market with a particular focus on identifying the key industry influencers. The data thus presented is comprehensive, reliable, and the result of extensive research, both primary and secondary.

INFORMATION SOURCES

Primary sources

  • Manufacturers and suppliers
  • Channel partners
  • Industry experts
  • Strategic decision makers

Secondary sources

  • Industry journals and periodicals
  • Government data
  • Financial reports of key industry players
  • Historical data
  • Press releases

DATA ANALYSIS

Data Synthesis

  • Collation of data
  • Estimation of key figures
  • Analysis of derived insights

Data Validation

  • Triangulation with data models
  • Reference against proprietary databases
  • Corroboration with industry experts

REPORT WRITING

Qualitative

  • Market drivers
  • Market challenges
  • Market trends
  • Five forces analysis

Quantitative

  • Market size and forecast
  • Market segmentation
  • Geographical insights
  • Competitive landscape

Interested in this report?

Get your sample now to see our research methodology and insights!

Download Now

Frequently Asked Questions

Silica Gel market growth will increase by USD 569.5 million during 2026-2030.

The Silica Gel market is expected to grow at a CAGR of 8.9% during 2026-2030.

Silica Gel market is segmented by Application (Oil and gas industry, Petrochemical, Pharmaceutical, Consumer goods, Others) Product type (Indicative silica gel, Non-indicative silica gel) Type (Coarse-pored silica gel, Mesoporous silica gel, Fine-pored silica gel)

AGC Inc., BASF SE, Capitol Scientific Inc., Cilicant Pvt. Ltd., Clariant International Ltd., Desiccare Inc., Ecovyst Inc., Evonik Industries AG, FUJI SILYSIA CHEMICAL LTD., GeeJay Chemicals Ltd., HengYe Inc., International Silica Gel Co. Ltd., Merck KGaA, Natland International Corp., Nouryon Chemicals Holding B.V., OSAKA SODA CO. Ltd., Shandong Sinchem Silica Gel Co. Ltd., SiliCycle Inc., Solvay SA, Thermo Fisher Scientific Inc. are a few of the key vendors in the Silica Gel market.

APAC will register the highest growth rate of 50.5% among the other regions. Therefore, the Silica Gel market in APAC is expected to garner significant business opportunities for the vendors during the forecast period.

China, India, Japan, South Korea, Australia, Singapore, US, Canada, Mexico, Germany, France, UK, Italy, Spain, The Netherlands, Brazil, Argentina, Chile, Saudi Arabia, South Africa, UAE, Egypt, Nigeria

  • Expanding demand for pharmaceutical purification and chromatography is the driving factor this market.

The Silica Gel market vendors should focus on grabbing business opportunities from the Application segment as it accounted for the largest market share in the base year.
RIA - Research AI Assistant
Ask RIA