Silicon Anode Battery Market Size 2025-2029
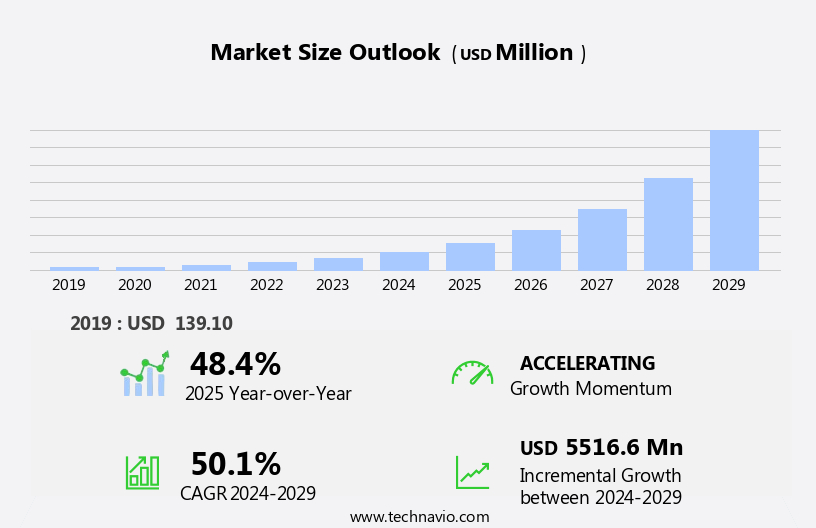
The silicon anode battery market size is forecast to increase by USD 5.52 billion at a CAGR of 50.1% between 2024 and 2029.
- The market is experiencing significant growth, driven primarily by the augmented demand from the consumer electronics sector. This trend is attributed to the superior energy density and longer cycle life offered by silicon anodes compared to traditional lithium-ion batteries. Key market drivers also include the development of advanced electrode architectures and solid electrolyte interfaces (SEI), which are crucial in improving the overall performance and safety of silicon anode batteries. However, the market growth is not without challenges. One of the major hurdles is the high cost and scalability issues associated with the production of silicon anode batteries.
- The high production costs are primarily due to the complex manufacturing processes and the requirement for high-purity silicon material. Additionally, the lack of mature production technologies and the need for significant research and development investments further add to the challenges. Companies seeking to capitalize on the market opportunities and navigate these challenges effectively must focus on optimizing production processes, reducing material costs, and collaborating with research institutions to develop scalable manufacturing technologies. By addressing these challenges, market participants can tap into the vast potential of the market and establish a competitive edge in the rapidly evolving energy storage landscape.
What will be the Size of the Silicon Anode Battery Market during the forecast period?

Request Free Sample
- The market is experiencing significant advancements, driven by innovations in electrochemical impedance spectroscopy and the use of materials such as silicon nitride and silicon alloy in electrode coating and fabrication. Solid electrolyte interphase technology and overcharging protection are crucial for ensuring the longevity of these batteries. Battery swapping and wireless charging are gaining traction in the market, contributing to the evolution of a sustainable battery economy. Battery monitoring, diagnostics, and second life applications are essential for extending battery life and managing waste. Calendar life, battery aging, and lithium plating are key areas of focus for research and development, as are battery module design, smart battery systems, and prognostics.
- Transmission electron microscopy and cyclic voltammetry are essential tools for understanding battery performance at the molecular level. Fast charging infrastructure and the battery industry roadmap are shaping the future of the market, with trends including lithium-ion battery recycling, thermal runaway mitigation, and the development of silicon-graphene composites and green batteries. Battery leasing and innovation centers are emerging as important business models, as the market continues to prioritize battery technology trends and advancements in electrode design and battery prognostics. Silicon oxide and battery cell research are also critical components of the market's growth trajectory.
How is this Silicon Anode Battery Industry segmented?
The silicon anode battery industry research report provides comprehensive data (region-wise segment analysis), with forecasts and estimates in "USD million" for the period 2025-2029, as well as historical data from 2019-2023 for the following segments.
- Application
- Automotive
- Consumer electronics
- Grid & Renewable Energy
- Medical Devices
- Aerospace
- Others
- Capacity
- Less than 1500 mAh
- 1500 mAh to 2500 mAh
- Above 2500 mAh
- Type
- Silicon-Carbon Composites
- Nanowires
- Pure Silicon Anodes
- Geography
- North America
- Europe
- Middle East and Africa
- APAC
- Australia
- China
- India
- Japan
- South Korea
- South America
- Rest of World (ROW)
By Application Insights
The automotive segment is estimated to witness significant growth during the forecast period.
In the realm of battery technology, silicon anode batteries have emerged as a promising solution for various industries, with a significant focus on the electric vehicle (EV) sector. These batteries offer several advantages that address critical concerns and contribute to the mainstream adoption of EVs. Firstly, silicon anode batteries boast higher energy density compared to traditional lithium-ion batteries. This attribute enables EVs to travel further distances on a single charge, extending their range and catering to consumer demands for greater convenience. Secondly, the fast charging capabilities of silicon anode batteries are a game-changer for the EV industry. By absorbing and releasing lithium ions more efficiently, these batteries enable faster charging times, enhancing the practicality and convenience of EV ownership.
Lastly, the lightweight nature of silicon anode batteries is another significant advantage. As battery weight is a crucial factor in EV design, the reduced weight of these batteries can contribute to the overall weight reduction of EV battery packs, leading to improved energy efficiency and potentially lower carbon footprints. The potential applications of silicon anode batteries extend beyond the automotive industry. They also hold potential in consumer electronics, grid storage, and renewable energy systems. As research and development efforts continue, these batteries may also find a place in aerospace, military applications, and battery recycling. The integration of silicon anodes in batteries is a complex process that involves several components, including anode material, battery manufacturing, battery testing, battery management systems, and raw materials.
Ensuring safety regulations are met while optimizing performance and cost is essential for market adoption. In the energy storage landscape, silicon anode batteries are poised to revolutionize the way we power our world, offering improved energy density, faster charging times, and reduced weight. As the market evolves, it is essential to consider the environmental impact, energy efficiency, and supply chain implications of these advanced battery technologies.

Get a glance at the market report of share of various segments Request Free Sample
The Automotive segment was valued at USD 53.90 billion in 2019 and showed a gradual increase during the forecast period.
Regional Analysis
APAC is estimated to contribute 43% to the growth of the global market during the forecast period.Technavio’s analysts have elaborately explained the regional trends and drivers that shape the market during the forecast period.

For more insights on the market size of various regions, Request Free Sample
In the realm of technology and innovation, the additive manufacturing market for metal components is experiencing significant growth, particularly in sectors such as electric vehicles, battery manufacturing, and the aerospace industry. The integration of advanced materials like silicon nanoparticles, carbon nanotubes, and silicon composite in anode production is driving performance optimization and cost savings in lithium-ion batteries. Environmental impact is a critical consideration in today's market, with a focus on energy efficiency, renewable energy, and reducing carbon footprints. Fast charging and high-voltage batteries are essential for electric vehicles and grid storage, necessitating improvements in battery capacity, energy density, and cycle life.
Battery testing, battery management systems, and recycling are key components of the battery value chain. Market adoption is accelerating due to advancements in lithium metal batteries, solid-state batteries, and battery standardization. The consumer electronics sector also benefits from these advancements, with portable devices requiring smaller, more efficient batteries. Cost optimization and safety regulations are essential factors in the market. Performance optimization and raw materials play a significant role in improving battery capacity and energy density while ensuring safety and reliability. The military applications sector is also adopting additive manufacturing for high-performance, lightweight components. The supply chain is a crucial aspect of the market, with battery manufacturing and battery recycling being key areas of focus.
The interplay between these elements is shaping the market dynamics and trends.
Market Dynamics
Our researchers analyzed the data with 2024 as the base year, along with the key drivers, trends, and challenges. A holistic analysis of drivers will help companies refine their marketing strategies to gain a competitive advantage.
What are the key market drivers leading to the rise in the adoption of Silicon Anode Battery Industry?
- Augmented demand from consumer electronics is the key driver of the market.
- The global consumer market is experiencing significant growth due to urbanization and the rise of dual-income families, leading to increased disposable incomes worldwide. This economic trend is reflected in the consumer confidence index, which indicates higher levels of spending in various markets. The economic recovery in major emerging markets, particularly in Asia, is driving this growth. Strong income growth in these regions is helping to reduce poverty and expand the middle class population, contributing to a continued upward trend during the forecast period.
- This demographic shift is expected to have a substantial impact on various industries, including the energy storage market, with an increasing demand for advanced battery technologies such as silicon anode batteries. The growing middle class population in emerging economies, with their large consumer bases, is expected to fuel the market's expansion in the coming years.
What are the market trends shaping the Silicon Anode Battery Industry?
- Development of electrode architectures and solid electrolyte interfaces (SEI) is the upcoming market trend.
- Silicon anode batteries have gained significant attention due to their potential to offer higher energy density and longer cycle life compared to traditional lithium-ion batteries. Innovative electrode architectures, such as nanostructured silicon, silicon nanowires, porous silicon, and silicon-carbon composites, are integral to the development of silicon anode batteries. These architectures accommodate volume changes and alleviate mechanical stress, providing high surface areas, short diffusion lengths, and robust mechanical support. Conductive additives, like carbon nanotubes, graphene, and conductive polymers, are incorporated into electrode formulations to enhance electron transport and reduce internal resistance, thereby improving battery performance and charging/discharging rates.
- Advanced electrode manufacturing techniques, including 3D printing and laser patterning, offer precise control over electrode morphology and conductivity, leading to improved electrochemical performance. The focus on enhancing the electrical conductivity of silicon-based electrodes is crucial for optimizing battery efficiency and performance.
What challenges does the Silicon Anode Battery Industry face during its growth?
- High cost and scalability issues in silicon anode battery production is a key challenge affecting the industry growth.
- Silicon, a common battery material, contributes significantly to battery production costs despite being more abundant and inexpensive than some alternatives, such as nickel. The refining process for silicon is energy-intensive and costly, and its incorporation into battery electrodes requires additional materials and processing steps. The synthesis of silicon anode materials, particularly in nanostructured forms for optimal battery performance, is complex and costly.
- High-temperature processes and specialized equipment are necessary, along with production costs. Moreover, the mixing of silicon with binders, conductive additives, and electrolytes increases overall manufacturing costs. These factors challenge the affordability and widespread adoption of silicon anode batteries.
Exclusive Customer Landscape
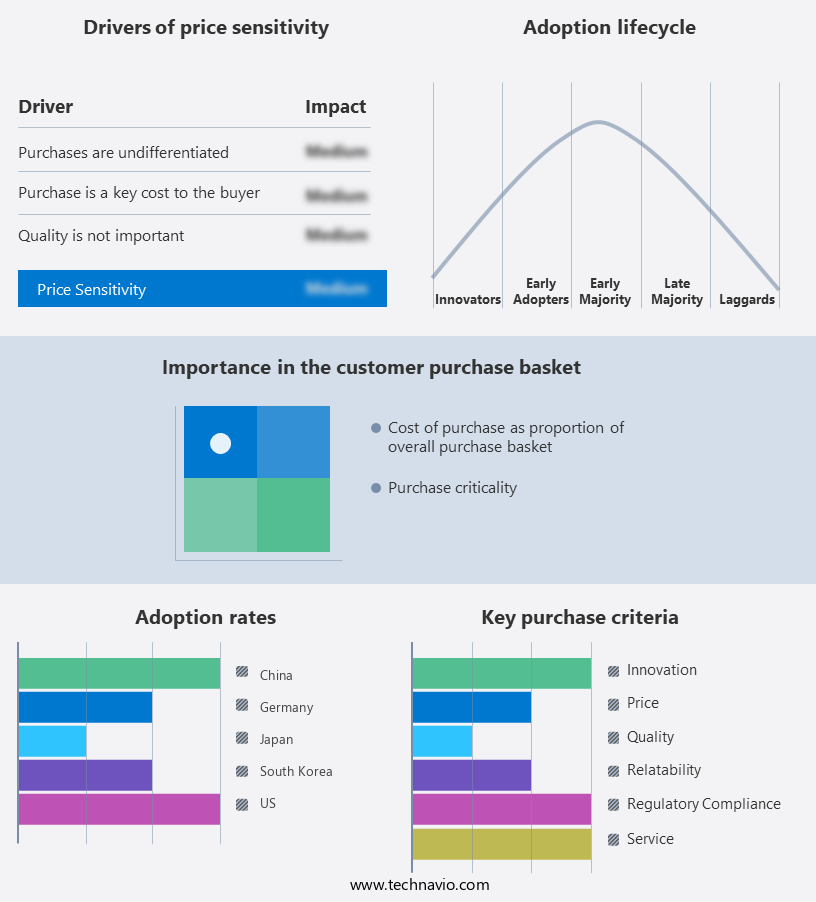
The silicon anode battery market forecasting report includes the adoption lifecycle of the market, covering from the innovator’s stage to the laggard’s stage. It focuses on adoption rates in different regions based on penetration. Furthermore, the silicon anode battery market report also includes key purchase criteria and drivers of price sensitivity to help companies evaluate and develop their market growth analysis strategies.

Customer Landscape
Key Companies & Market Insights
Companies are implementing various strategies, such as strategic alliances, silicon anode battery market forecast, partnerships, mergers and acquisitions, geographical expansion, and product/service launches, to enhance their presence in the industry.
Advano (USA) - Amprius, the innovative technology company, introduces silicon anode batteries under its brand. These batteries boast impressive energy and power densities, enabling rapid charge rates and versatile temperature operations.
The industry research and growth report includes detailed analyses of the competitive landscape of the market and information about key companies, including:
- Advano (USA)
- Alkegen (SiFAB) (USA)
- Amprius Technologies (USA)
- BTR New Material Group Co. Ltd. (China)
- California Lithium Battery (USA)
- Daejoo Electronic Materials Co. Ltd. (South Korea)
- E-magy (Netherlands)
- Enevate Corp. (USA)
- Enovix Corp. (USA)
- Global Graphene Group Inc. (USA)
- Group14 Technologies (USA)
- HPQ Silicon Inc. (Canada)
- Ionblox Inc. (USA)
- LeydenJar Technologies BV (Netherlands)
- Nanograf Corp. (USA)
- Nanospan Inc. (USA)
- NanoXplore Inc. (Canada)
- NEO Battery Materials LTD. (Canada)
- Nexeon Ltd. (UK)
- OneD Battery Sciences (USA)
- Sicona Battery Technologies (Australia)
- Sila Nanotechnologies Inc. (USA)
- Talga Group Ltd. (Australia)
- Targray Technology International (Canada)
- TruSpin Nanomaterial Innovation Inc. (USA)
- XG Sciences (USA
Qualitative and quantitative analysis of companies has been conducted to help clients understand the wider business environment as well as the strengths and weaknesses of key industry players. Data is qualitatively analyzed to categorize companies as pure play, category-focused, industry-focused, and diversified; it is quantitatively analyzed to categorize companies as dominant, leading, strong, tentative, and weak.
Research Analyst Overview
The global electrochemical performance of batteries continues to be a focal point in various industries, with electric vehicles (EVs) and consumer electronics leading the charge. One of the key components undergoing significant research and development is the anode material, specifically silicon nanoparticles, which are gaining traction due to their potential advantages in lithium-ion batteries. Battery manufacturing has been a critical aspect of the energy storage sector, with continuous efforts to improve the environmental impact and cost optimization. The integration of silicon anodes in lithium-ion batteries has been a promising development, as they offer enhanced fast charging capabilities and higher energy density compared to traditional graphite anodes.
The supply chain for battery manufacturing has experienced considerable evolution, with the demand for silicon anodes growing in response to the increasing popularity of EVs and the need for energy storage solutions in grid applications, renewable energy systems, and portable devices. The aerospace industry and military applications have also shown interest in the potential of silicon anodes for high-voltage batteries. Carbon nanotubes have been another area of interest in battery research, as they can improve battery performance by enhancing conductivity and cycle life. Lithium metal batteries and solid-state batteries are two emerging technologies that could potentially benefit from the use of silicon anodes, offering further advancements in energy density and safety.
Battery testing plays a crucial role in assessing the performance and safety of energy storage systems. Life cycle analysis is an essential aspect of battery testing, as it provides valuable insights into the environmental impact of battery production, usage, and disposal. Market adoption of silicon anode batteries is expected to increase as they meet the growing demand for longer battery life, faster charging times, and higher energy efficiency. Battery recycling is another area of focus, as the circular economy gains importance in the energy storage sector. The development of effective battery recycling processes is crucial for minimizing the carbon footprint and reducing the need for raw materials.
Safety regulations and performance optimization are ongoing concerns in the battery industry, as the demand for safer and more efficient energy storage solutions continues to grow. The standardization of batteries is also a significant factor in facilitating their adoption in various applications, from consumer electronics to grid storage and transportation. The electrochemical performance of batteries, specifically those utilizing silicon anodes, continues to be a vital area of research and development in various industries. The potential benefits of silicon anodes, such as enhanced energy density, faster charging times, and improved safety, make them an attractive option for energy storage applications in EVs, consumer electronics, grid storage, renewable energy, and aerospace industries.
Ongoing efforts in battery manufacturing, testing, recycling, and standardization are essential for the continued growth and adoption of silicon anode batteries.
Market Scope
|
Report Coverage
|
Details
|
Page number
|
222
|
Base year
|
2024
|
Historic period
|
2019-2023 |
Forecast period
|
2025-2029
|
Growth momentum & CAGR
|
Accelerate at a CAGR of 50.1%
|
Market growth 2025-2029
|
USD 5516.6 million
|
Market structure
|
Fragmented
|
YoY growth 2024-2025(%)
|
48.4
|
Key countries
|
US, Canada, UK, Germany, Japan, France, China, India, South Korea, Australia, UAE, and Brazil
|
Competitive landscape
|
Leading Companies, Market Positioning of Companies, Competitive Strategies, and Industry Risks
|
Request Free Sample
What are the Key Data Covered in this Silicon Anode Battery Market Research and Growth Report?
- CAGR of the Silicon Anode Battery industry during the forecast period
- Detailed information on factors that will drive the growth and forecasting between 2025 and 2029
- Precise estimation of the size of the market and its contribution of the industry in focus to the parent market
- Accurate predictions about upcoming growth and trends and changes in consumer behaviour
- Growth of the market across APAC, North America, Europe, Middle East and Africa, and South America
- Thorough analysis of the market’s competitive landscape and detailed information about companies
- Comprehensive analysis of factors that will challenge the silicon anode battery market growth of industry companies
We can help! Our analysts can customize this silicon anode battery market research report to meet your requirements.
Get in touch
1 Executive Summary
- 1.1 Market overview
- Executive Summary - Chart on Market Overview
- Executive Summary - Data Table on Market Overview
- Executive Summary - Chart on Global Market Characteristics
- Executive Summary - Chart on Market by Geography
- Executive Summary - Chart on Market Segmentation by Application
- Executive Summary - Chart on Market Segmentation by End-user
- Executive Summary - Chart on Market Segmentation by Capacity
- Executive Summary - Chart on Incremental Growth
- Executive Summary - Data Table on Incremental Growth
- Executive Summary - Chart on Company Market Positioning
2 Technavio Analysis
- 2.1 Analysis of price sensitivity, lifecycle, customer purchase basket, adoption rates, and purchase criteria
- Analysis of price sensitivity, lifecycle, customer purchase basket, adoption rates, and purchase criteria
- 2.2 Criticality of inputs and Factors of differentiation
- Overview on criticality of inputs and factors of differentiation
- 2.3 Factors of disruption
- Overview on factors of disruption
- 2.4 Impact of drivers and challenges
- Impact of drivers and challenges in 2024 and 2029
3 Market Landscape
- 3.1 Market ecosystem
- Parent Market
- Data Table on - Parent Market
- 3.2 Market characteristics
- Market characteristics analysis
4 Market Sizing
- 4.1 Market definition
- Offerings of companies included in the market definition
- 4.2 Market segment analysis
- 4.4 Market outlook: Forecast for 2024-2029
- Chart on Global - Market size and forecast 2024-2029 ($ million)
- Data Table on Global - Market size and forecast 2024-2029 ($ million)
- Chart on Global Market: Year-over-year growth 2024-2029 (%)
- Data Table on Global Market: Year-over-year growth 2024-2029 (%)
5 Historic Market Size
- 5.1 Global Silicon Anode Battery Market 2019 - 2023
- Historic Market Size - Data Table on Global Silicon Anode Battery Market 2019 - 2023 ($ million)
- 5.2 Application segment analysis 2019 - 2023
- Historic Market Size - Application Segment 2019 - 2023 ($ million)
- 5.3 End-user segment analysis 2019 - 2023
- Historic Market Size - End-user Segment 2019 - 2023 ($ million)
- 5.4 Capacity segment analysis 2019 - 2023
- Historic Market Size - Capacity Segment 2019 - 2023 ($ million)
- 5.5 Geography segment analysis 2019 - 2023
- Historic Market Size - Geography Segment 2019 - 2023 ($ million)
- 5.6 Country segment analysis 2019 - 2023
- Historic Market Size - Country Segment 2019 - 2023 ($ million)
6 Qualitative Analysis
- 6.1 Impact of AI in Global Silicon Anode Battery Market
7 Five Forces Analysis
- 7.1 Five forces summary
- Five forces analysis - Comparison between 2024 and 2029
- 7.2 Bargaining power of buyers
- Bargaining power of buyers - Impact of key factors 2024 and 2029
- 7.3 Bargaining power of suppliers
- Bargaining power of suppliers - Impact of key factors in 2024 and 2029
- 7.4 Threat of new entrants
- Threat of new entrants - Impact of key factors in 2024 and 2029
- 7.5 Threat of substitutes
- Threat of substitutes - Impact of key factors in 2024 and 2029
- 7.6 Threat of rivalry
- Threat of rivalry - Impact of key factors in 2024 and 2029
- 7.7 Market condition
- Chart on Market condition - Five forces 2024 and 2029
8 Market Segmentation by Application
- 8.1 Market segments
- Chart on Application - Market share (2024-2029) (%)
- Data Table on Application - Market share (2024-2029) (%)
- 8.2 Comparison by Application
- Chart on Comparison by Application
- Data Table on Comparison by Application
- 8.3 Automotive - Market size and forecast (2024-2029)
- Chart on Automotive - Market size and forecast (2024-2029) ($ million)
- Data Table on Automotive - Market size and forecast (2024-2029) ($ million)
- Chart on Automotive - Year-over-year growth (2024-2029) (%)
- Data Table on Automotive - Year-over-year growth (2024-2029) (%)
- 8.4 Consumer electronics - Market size and forecast (2024-2029)
- Chart on Consumer electronics - Market size and forecast (2024-2029) ($ million)
- Data Table on Consumer electronics - Market size and forecast (2024-2029) ($ million)
- Chart on Consumer electronics - Year-over-year growth (2024-2029) (%)
- Data Table on Consumer electronics - Year-over-year growth (2024-2029) (%)
- 8.5 Grid & Renewable Energy - Market size and forecast (2024-2029)
- Chart on Grid & Renewable Energy - Market size and forecast (2024-2029) ($ million)
- Data Table on Grid & Renewable Energy - Market size and forecast (2024-2029) ($ million)
- Chart on Grid & Renewable Energy - Year-over-year growth (2024-2029) (%)
- Data Table on Grid & Renewable Energy - Year-over-year growth (2024-2029) (%)
- 8.6 Medical Devices - Market size and forecast (2024-2029)
- Chart on Medical Devices - Market size and forecast (2024-2029) ($ million)
- Data Table on Medical Devices - Market size and forecast (2024-2029) ($ million)
- Chart on Medical Devices - Year-over-year growth (2024-2029) (%)
- Data Table on Medical Devices - Year-over-year growth (2024-2029) (%)
- 8.7 Aerospace - Market size and forecast (2024-2029)
- Chart on Aerospace - Market size and forecast (2024-2029) ($ million)
- Data Table on Aerospace - Market size and forecast (2024-2029) ($ million)
- Chart on Aerospace - Year-over-year growth (2024-2029) (%)
- Data Table on Aerospace - Year-over-year growth (2024-2029) (%)
- 8.8 Others - Market size and forecast (2024-2029)
- Chart on Others - Market size and forecast (2024-2029) ($ million)
- Data Table on Others - Market size and forecast (2024-2029) ($ million)
- Chart on Others - Year-over-year growth (2024-2029) (%)
- Data Table on Others - Year-over-year growth (2024-2029) (%)
- 8.9 Market opportunity by Application
- Market opportunity by Application ($ million)
- Data Table on Market opportunity by Application ($ million)
9 Market Segmentation by End-user
- 9.1 Market segments
- Chart on End-user - Market share 2024-2029 (%)
- Data Table on End-user - Market share 2024-2029 (%)
- 9.2 Comparison by End-user
- Chart on Comparison by End-user
- Data Table on Comparison by End-user
- 9.3 Commercial - Market size and forecast 2024-2029
- Chart on Commercial - Market size and forecast 2024-2029 ($ million)
- Data Table on Commercial - Market size and forecast 2024-2029 ($ million)
- Chart on Commercial - Year-over-year growth 2024-2029 (%)
- Data Table on Commercial - Year-over-year growth 2024-2029 (%)
- 9.4 Industrial - Market size and forecast 2024-2029
- Chart on Industrial - Market size and forecast 2024-2029 ($ million)
- Data Table on Industrial - Market size and forecast 2024-2029 ($ million)
- Chart on Industrial - Year-over-year growth 2024-2029 (%)
- Data Table on Industrial - Year-over-year growth 2024-2029 (%)
- 9.5 Residential - Market size and forecast 2024-2029
- Chart on Residential - Market size and forecast 2024-2029 ($ million)
- Data Table on Residential - Market size and forecast 2024-2029 ($ million)
- Chart on Residential - Year-over-year growth 2024-2029 (%)
- Data Table on Residential - Year-over-year growth 2024-2029 (%)
- 9.6 Market opportunity by End-user
- Market opportunity by End-user ($ million)
- Data Table on Market opportunity by End-user ($ million)
10 Market Segmentation by Capacity
- 10.1 Market segments
- Chart on Capacity - Market share (2024-2029) (%)
- Data Table on Capacity - Market share (2024-2029) (%)
- 10.2 Comparison by Capacity
- Chart on Comparison by Capacity
- Data Table on Comparison by Capacity
- 10.3 Less than 1500 mAh - Market size and forecast (2024-2029)
- Chart on Less than 1500 mAh - Market size and forecast (2024-2029) ($ million)
- Data Table on Less than 1500 mAh - Market size and forecast (2024-2029) ($ million)
- Chart on Less than 1500 mAh - Year-over-year growth (2024-2029) (%)
- Data Table on Less than 1500 mAh - Year-over-year growth (2024-2029) (%)
- 1500 mAh to 2500 mAh - Market size and forecast (2024-2029)
- Chart on 1500 mAh to 2500 mAh - Market size and forecast (2024-2029) ($ million)
- Data Table on 1500 mAh to 2500 mAh - Market size and forecast (2024-2029) ($ million)
- Chart on 1500 mAh to 2500 mAh - Year-over-year growth (2024-2029) (%)
- Data Table on 1500 mAh to 2500 mAh - Year-over-year growth (2024-2029) (%)
- 10.5 Above 2500 mAh - Market size and forecast (2024-2029)
- Chart on Above 2500 mAh - Market size and forecast (2024-2029) ($ million)
- Data Table on Above 2500 mAh - Market size and forecast (2024-2029) ($ million)
- Chart on Above 2500 mAh - Year-over-year growth (2024-2029) (%)
- Data Table on Above 2500 mAh - Year-over-year growth (2024-2029) (%)
- 10.6 Market opportunity by Capacity
- Market opportunity by Capacity ($ million)
- Data Table on Market opportunity by Capacity ($ million)
11 Market Segmentation by Type
- 11.1 Market segments
- Chart on Type - Market share (2024-2029) (%)
- Data Table on Type - Market share (2024-2029) (%)
- 11.2 Comparison by Type
- Chart on Comparison by Type
- Data Table on Comparison by Type
- 11.3 Silicon-Carbon Composites - Market size and forecast (2024-2029)
- Chart on Silicon-Carbon Composites - Market size and forecast (2024-2029) ($ million)
- Data Table on Silicon-Carbon Composites - Market size and forecast (2024-2029) ($ million)
- Chart on Silicon-Carbon Composites - Year-over-year growth (2024-2029) (%)
- Data Table on Silicon-Carbon Composites - Year-over-year growth (2024-2029) (%)
- 11.4 Nanowires - Market size and forecast (2024-2029)
- Chart on Nanowires - Market size and forecast (2024-2029) ($ million)
- Data Table on Nanowires - Market size and forecast (2024-2029) ($ million)
- Chart on Nanowires - Year-over-year growth (2024-2029) (%)
- Data Table on Nanowires - Year-over-year growth (2024-2029) (%)
- 11.5 Pure Silicon Anodes - Market size and forecast (2024-2029)
- Chart on Pure Silicon Anodes - Market size and forecast (2024-2029) ($ million)
- Data Table on Pure Silicon Anodes - Market size and forecast (2024-2029) ($ million)
- Chart on Pure Silicon Anodes - Year-over-year growth (2024-2029) (%)
- Data Table on Pure Silicon Anodes - Year-over-year growth (2024-2029) (%)
- 11.6 Market opportunity by Type
- Market opportunity by Type ($ million)
- Data Table on Market opportunity by Type ($ million)
12 Customer Landscape
- 12.1 Customer landscape overview
- Analysis of price sensitivity, lifecycle, customer purchase basket, adoption rates, and purchase criteria
13 Geographic Landscape
- 13.1 Geographic segmentation
- Chart on Market share by geography 2024-2029 (%)
- Data Table on Market share by geography 2024-2029 (%)
- 13.2 Geographic comparison
- Chart on Geographic comparison
- Data Table on Geographic comparison
- 13.3 APAC - Market size and forecast 2024-2029
- Chart on APAC - Market size and forecast 2024-2029 ($ million)
- Data Table on APAC - Market size and forecast 2024-2029 ($ million)
- Chart on APAC - Year-over-year growth 2024-2029 (%)
- Data Table on APAC - Year-over-year growth 2024-2029 (%)
- 13.4 North America - Market size and forecast 2024-2029
- Chart on North America - Market size and forecast 2024-2029 ($ million)
- Data Table on North America - Market size and forecast 2024-2029 ($ million)
- Chart on North America - Year-over-year growth 2024-2029 (%)
- Data Table on North America - Year-over-year growth 2024-2029 (%)
- 13.5 Europe - Market size and forecast 2024-2029
- Chart on Europe - Market size and forecast 2024-2029 ($ million)
- Data Table on Europe - Market size and forecast 2024-2029 ($ million)
- Chart on Europe - Year-over-year growth 2024-2029 (%)
- Data Table on Europe - Year-over-year growth 2024-2029 (%)
- 13.6 Middle East and Africa - Market size and forecast 2024-2029
- Chart on Middle East and Africa - Market size and forecast 2024-2029 ($ million)
- Data Table on Middle East and Africa - Market size and forecast 2024-2029 ($ million)
- Chart on Middle East and Africa - Year-over-year growth 2024-2029 (%)
- Data Table on Middle East and Africa - Year-over-year growth 2024-2029 (%)
- 13.7 South America - Market size and forecast 2024-2029
- Chart on South America - Market size and forecast 2024-2029 ($ million)
- Data Table on South America - Market size and forecast 2024-2029 ($ million)
- Chart on South America - Year-over-year growth 2024-2029 (%)
- Data Table on South America - Year-over-year growth 2024-2029 (%)
- 13.8 US - Market size and forecast 2024-2029
- Chart on US - Market size and forecast 2024-2029 ($ million)
- Data Table on US - Market size and forecast 2024-2029 ($ million)
- Chart on US - Year-over-year growth 2024-2029 (%)
- Data Table on US - Year-over-year growth 2024-2029 (%)
- 13.9 China - Market size and forecast 2024-2029
- Chart on China - Market size and forecast 2024-2029 ($ million)
- Data Table on China - Market size and forecast 2024-2029 ($ million)
- Chart on China - Year-over-year growth 2024-2029 (%)
- Data Table on China - Year-over-year growth 2024-2029 (%)
- 13.10 Japan - Market size and forecast 2024-2029
- Chart on Japan - Market size and forecast 2024-2029 ($ million)
- Data Table on Japan - Market size and forecast 2024-2029 ($ million)
- Chart on Japan - Year-over-year growth 2024-2029 (%)
- Data Table on Japan - Year-over-year growth 2024-2029 (%)
- 13.11 India - Market size and forecast 2024-2029
- Chart on India - Market size and forecast 2024-2029 ($ million)
- Data Table on India - Market size and forecast 2024-2029 ($ million)
- Chart on India - Year-over-year growth 2024-2029 (%)
- Data Table on India - Year-over-year growth 2024-2029 (%)
- 13.12 South Korea - Market size and forecast 2024-2029
- Chart on South Korea - Market size and forecast 2024-2029 ($ million)
- Data Table on South Korea - Market size and forecast 2024-2029 ($ million)
- Chart on South Korea - Year-over-year growth 2024-2029 (%)
- Data Table on South Korea - Year-over-year growth 2024-2029 (%)
- 13.13 UK - Market size and forecast 2024-2029
- Chart on UK - Market size and forecast 2024-2029 ($ million)
- Data Table on UK - Market size and forecast 2024-2029 ($ million)
- Chart on UK - Year-over-year growth 2024-2029 (%)
- Data Table on UK - Year-over-year growth 2024-2029 (%)
- 13.14 Canada - Market size and forecast 2024-2029
- Chart on Canada - Market size and forecast 2024-2029 ($ million)
- Data Table on Canada - Market size and forecast 2024-2029 ($ million)
- Chart on Canada - Year-over-year growth 2024-2029 (%)
- Data Table on Canada - Year-over-year growth 2024-2029 (%)
- 13.15 Germany - Market size and forecast 2024-2029
- Chart on Germany - Market size and forecast 2024-2029 ($ million)
- Data Table on Germany - Market size and forecast 2024-2029 ($ million)
- Chart on Germany - Year-over-year growth 2024-2029 (%)
- Data Table on Germany - Year-over-year growth 2024-2029 (%)
- 13.16 Australia - Market size and forecast 2024-2029
- Chart on Australia - Market size and forecast 2024-2029 ($ million)
- Data Table on Australia - Market size and forecast 2024-2029 ($ million)
- Chart on Australia - Year-over-year growth 2024-2029 (%)
- Data Table on Australia - Year-over-year growth 2024-2029 (%)
- 13.17 France - Market size and forecast 2024-2029
- Chart on France - Market size and forecast 2024-2029 ($ million)
- Data Table on France - Market size and forecast 2024-2029 ($ million)
- Chart on France - Year-over-year growth 2024-2029 (%)
- Data Table on France - Year-over-year growth 2024-2029 (%)
- 13.18 Market opportunity by geography
- Market opportunity by geography ($ million)
- Data Tables on Market opportunity by geography ($ million)
- 13.19 UAE - Market size and forecast (2024-2029)
- Chart on UAE - Market size and forecast (2024-2029) ($ million)
- Data Table on UAE - Market size and forecast (2024-2029) ($ million)
- Chart on UAE - Year-over-year growth (2024-2029) (%)
- Data Table on UAE - Year-over-year growth (2024-2029) (%)
- 13.20 Brazil - Market size and forecast (2024-2029)
- Chart on Brazil - Market size and forecast (2024-2029) ($ million)
- Data Table on Brazil - Market size and forecast (2024-2029) ($ million)
- Chart on Brazil - Year-over-year growth (2024-2029) (%)
- Data Table on Brazil - Year-over-year growth (2024-2029) (%)
- 13.21 Rest of World (ROW) - Market size and forecast (2024-2029)
- Chart on Rest of World (ROW) - Market size and forecast (2024-2029) ($ million)
- Data Table on Rest of World (ROW) - Market size and forecast (2024-2029) ($ million)
- Chart on Rest of World (ROW) - Year-over-year growth (2024-2029) (%)
- Data Table on Rest of World (ROW) - Year-over-year growth (2024-2029) (%)
14 Drivers, Challenges, and Opportunity/Restraints
- 14.3 Impact of drivers and challenges
- Impact of drivers and challenges in 2024 and 2029
- 14.4 Market opportunities/restraints
15 Competitive Landscape
- 15.2 Competitive Landscape
- Overview on criticality of inputs and factors of differentiation
- 15.3 Landscape disruption
- Overview on factors of disruption
- 15.4 Industry risks
- Impact of key risks on business
16 Competitive Analysis
- 16.2 Market positioning of companies
- Matrix on companies position and classification
- 16.3 Advano (USA)
- Advano (USA) - Overview
- Advano (USA) - Product / Service
- Advano (USA) - Key offerings
- 16.4 Alkegen (SiFAB) (USA)
- Alkegen (SiFAB) (USA) - Overview
- Alkegen (SiFAB) (USA) - Product / Service
- Alkegen (SiFAB) (USA) - Key offerings
- 16.5 Amprius Technologies (USA)
- Amprius Technologies (USA) - Overview
- Amprius Technologies (USA) - Product / Service
- Amprius Technologies (USA) - Key offerings
- 16.6 BTR New Material Group Co. Ltd. (China)
- BTR New Material Group Co. Ltd. (China) - Overview
- BTR New Material Group Co. Ltd. (China) - Product / Service
- BTR New Material Group Co. Ltd. (China) - Key offerings
- 16.7 California Lithium Battery (USA)
- California Lithium Battery (USA) - Overview
- California Lithium Battery (USA) - Product / Service
- California Lithium Battery (USA) - Key offerings
- 16.8 Daejoo Electronic Materials Co. Ltd. (South Korea)
- Daejoo Electronic Materials Co. Ltd. (South Korea) - Overview
- Daejoo Electronic Materials Co. Ltd. (South Korea) - Product / Service
- Daejoo Electronic Materials Co. Ltd. (South Korea) - Key offerings
- 16.9 E-magy (Netherlands)
- E-magy (Netherlands) - Overview
- E-magy (Netherlands) - Product / Service
- E-magy (Netherlands) - Key offerings
- 16.10 Enevate Corp. (USA)
- Enevate Corp. (USA) - Overview
- Enevate Corp. (USA) - Product / Service
- Enevate Corp. (USA) - Key offerings
- 16.11 Enovix Corp. (USA)
- Enovix Corp. (USA) - Overview
- Enovix Corp. (USA) - Product / Service
- Enovix Corp. (USA) - Key offerings
- 16.12 Global Graphene Group Inc. (USA)
- Global Graphene Group Inc. (USA) - Overview
- Global Graphene Group Inc. (USA) - Product / Service
- Global Graphene Group Inc. (USA) - Key offerings
- 16.13 Group14 Technologies (USA)
- Group14 Technologies (USA) - Overview
- Group14 Technologies (USA) - Product / Service
- Group14 Technologies (USA) - Key offerings
- 16.14 HPQ Silicon Inc. (Canada)
- HPQ Silicon Inc. (Canada) - Overview
- HPQ Silicon Inc. (Canada) - Product / Service
- HPQ Silicon Inc. (Canada) - Key offerings
- 16.15 Ionblox Inc. (USA)
- Ionblox Inc. (USA) - Overview
- Ionblox Inc. (USA) - Product / Service
- Ionblox Inc. (USA) - Key offerings
- 16.16 LeydenJar Technologies BV (Netherlands)
- LeydenJar Technologies BV (Netherlands) - Overview
- LeydenJar Technologies BV (Netherlands) - Product / Service
- LeydenJar Technologies BV (Netherlands) - Key offerings
- 16.17 Nanograf Corp. (USA)
- Nanograf Corp. (USA) - Overview
- Nanograf Corp. (USA) - Product / Service
- Nanograf Corp. (USA) - Key offerings
- 16.18 Nanospan Inc. (USA)
- Nanospan Inc. (USA) - Overview
- Nanospan Inc. (USA) - Product / Service
- Nanospan Inc. (USA) - Key offerings
- 16.19 NanoXplore Inc. (Canada)
- NanoXplore Inc. (Canada) - Overview
- NanoXplore Inc. (Canada) - Product / Service
- NanoXplore Inc. (Canada) - Key offerings
- 16.20 NEO Battery Materials LTD. (Canada)
- NEO Battery Materials LTD. (Canada) - Overview
- NEO Battery Materials LTD. (Canada) - Product / Service
- NEO Battery Materials LTD. (Canada) - Key offerings
- 16.21 Nexeon Ltd. (UK)
- Nexeon Ltd. (UK) - Overview
- Nexeon Ltd. (UK) - Product / Service
- Nexeon Ltd. (UK) - Key offerings
- 16.22 OneD Battery Sciences (USA)
- OneD Battery Sciences (USA) - Overview
- OneD Battery Sciences (USA) - Product / Service
- OneD Battery Sciences (USA) - Key offerings
- 16.23 Sicona Battery Technologies (Australia)
- Sicona Battery Technologies (Australia) - Overview
- Sicona Battery Technologies (Australia) - Product / Service
- Sicona Battery Technologies (Australia) - Key offerings
- 16.24 Sila Nanotechnologies Inc. (USA)
- Sila Nanotechnologies Inc. (USA) - Overview
- Sila Nanotechnologies Inc. (USA) - Product / Service
- Sila Nanotechnologies Inc. (USA) - Key offerings
- 16.25 Talga Group Ltd. (Australia)
- Talga Group Ltd. (Australia) - Overview
- Talga Group Ltd. (Australia) - Product / Service
- Talga Group Ltd. (Australia) - Key offerings
- 16.26 Targray Technology International (Canada)
- Targray Technology International (Canada) - Overview
- Targray Technology International (Canada) - Product / Service
- Targray Technology International (Canada) - Key offerings
- 16.27 TruSpin Nanomaterial Innovation Inc. (USA)
- TruSpin Nanomaterial Innovation Inc. (USA) - Overview
- TruSpin Nanomaterial Innovation Inc. (USA) - Product / Service
- TruSpin Nanomaterial Innovation Inc. (USA) - Key offerings
- 16.28 XG Sciences (USA
- XG Sciences (USA - Overview
- XG Sciences (USA - Product / Service
- XG Sciences (USA - Key offerings
- 16.29 Advano
- Advano - Overview
- Advano - Product / Service
- Advano - Key offerings
- 16.30 Amprius Technologies Inc.
- Amprius Technologies Inc. - Overview
- Amprius Technologies Inc. - Product / Service
- Amprius Technologies Inc. - Key offerings
- 16.31 BTR New material Group Co. Ltd.
- BTR New material Group Co. Ltd. - Overview
- BTR New material Group Co. Ltd. - Product / Service
- BTR New material Group Co. Ltd. - Key offerings
- 16.32 E-magy
- E-magy - Overview
- E-magy - Product / Service
- E-magy - Key offerings
- 16.33 Enevate Corp.
- Enevate Corp. - Overview
- Enevate Corp. - Product / Service
- Enevate Corp. - Key offerings
- 16.34 Enovix Corp.
- Enovix Corp. - Overview
- Enovix Corp. - Product / Service
- Enovix Corp. - Key offerings
- 16.35 Group14 Technologies
- Group14 Technologies - Overview
- Group14 Technologies - Product / Service
- Group14 Technologies - Key offerings
- 16.36 Nanograf Corp.
- Nanograf Corp. - Overview
- Nanograf Corp. - Product / Service
- Nanograf Corp. - Key offerings
- 16.37 Nanospan Inc.
- Nanospan Inc. - Overview
- Nanospan Inc. - Product / Service
- Nanospan Inc. - Key offerings
- 16.38 NanoXplore Inc.
- NanoXplore Inc. - Overview
- NanoXplore Inc. - Product / Service
- NanoXplore Inc. - Key offerings
- 16.39 NEO Battery Materials LTD.
- NEO Battery Materials LTD. - Overview
- NEO Battery Materials LTD. - Product / Service
- NEO Battery Materials LTD. - Key offerings
- 16.40 Nexeon Ltd.
- Nexeon Ltd. - Overview
- Nexeon Ltd. - Product / Service
- Nexeon Ltd. - Key offerings
- 16.41 OneD Battery Sciences
- OneD Battery Sciences - Overview
- OneD Battery Sciences - Product / Service
- OneD Battery Sciences - Key offerings
- 16.42 Sicona Battery Technologies
- Sicona Battery Technologies - Overview
- Sicona Battery Technologies - Product / Service
- Sicona Battery Technologies - Key offerings
- 16.43 Sila Nanotechnologies Inc.
- Sila Nanotechnologies Inc. - Overview
- Sila Nanotechnologies Inc. - Product / Service
- Sila Nanotechnologies Inc. - Key offerings
- 16.44 Talga Group Ltd.
- Talga Group Ltd. - Overview
- Talga Group Ltd. - Product / Service
- Talga Group Ltd. - Key offerings
- 16.45 TruSpin Nanomaterial Innovation Inc.
- TruSpin Nanomaterial Innovation Inc. - Overview
- TruSpin Nanomaterial Innovation Inc. - Product / Service
- TruSpin Nanomaterial Innovation Inc. - Key offerings
17 Appendix
- 17.2 Inclusions and exclusions checklist
- Inclusions checklist
- Exclusions checklist
- 17.3 Currency conversion rates for US$
- Currency conversion rates for US$
- 17.4 Research methodology
- 17.7 Validation techniques employed for market sizing
- Validation techniques employed for market sizing
- 17.9 360 degree market analysis
- 360 degree market analysis
- 17.10 List of abbreviations