
Slip Rings Market Analysis, Size, and Forecast 2026-2030: Europe (Germany, UK, and France), North America (US, Canada, and Mexico), APAC (China, Japan, and India), South America (Brazil, Argentina, and Chile), Middle East and Africa (Saudi Arabia, UAE, and South Africa), and Rest of World (ROW)

Slip Rings Market Analysis, Size, and Forecast 2026-2030:
Europe (Germany, UK, and France), North America (US, Canada, and Mexico), APAC (China, Japan, and India), South America (Brazil, Argentina, and Chile), Middle East and Africa (Saudi Arabia, UAE, and South Africa), and Rest of World (ROW)

Published: Oct 2026 305 Pages SKU: IRTNTR45746

Market Overview at a Glance

$160 Mn
Market Opportunity
3.3%
CAGR 2025 - 2030
38.9%
Europe Growth
$320.1 Mn
Commercial segment 2024

Slip Rings Market Size 2026-2030

The slip rings market size is valued to increase by USD 160 million, at a CAGR of 3.3% from 2025 to 2030. Drivers expansion of offshore and onshore wind energy infrastructure will drive the slip rings market.

Major Market Trends & Insights

  • Europe dominated the market and accounted for a 38.9% growth during the forecast period.
  • By Application - Commercial segment was valued at USD 320.1 million in 2024
  • By Type - Upto 1500 rpm segment accounted for the largest market revenue share in 2024

Market Size & Forecast

  • Market Opportunities: USD 280 million
  • Market Future Opportunities: USD 160 million
  • CAGR from 2025 to 2030 : 3.3%

Market Summary

  • The Slip Rings Market demonstrates sustained structural expansion driven by the critical need for continuous electrical connectivity in dynamic rotational systems. A prominent driver is the rapid deployment of utility-scale wind energy infrastructure, where advanced electromechanical assemblies are essential for transmitting pitch control data and power across rotating turbine nacelles.
  • This renewable energy transition directly increases operational efficiency, allowing operators to achieve a 25% improvement in continuous energy capture compared to legacy static systems. In real-world automated manufacturing hubs, robotic assembly arms utilize these specialized components to maintain 360-degree motion without cable entanglement, streamlining high-speed packaging processes and increasing throughput.
  • However, the industry faces a structural challenge regarding mechanical contact friction and subsequent conductive debris accumulation. This physical degradation leads to elevated maintenance expenditures and intermittent signal loss, forcing end-users to schedule frequent component replacements. To mitigate these operational constraints, manufacturers are shifting toward frictionless signal transmission architectures to extend equipment lifespans.
  • As autonomous manufacturing and clean energy grids expand, the reliance on high-performance rotary electrical interfaces remains paramount for ensuring long-term systemic reliability.

What will be the Size of the Slip Rings Market during the forecast period?
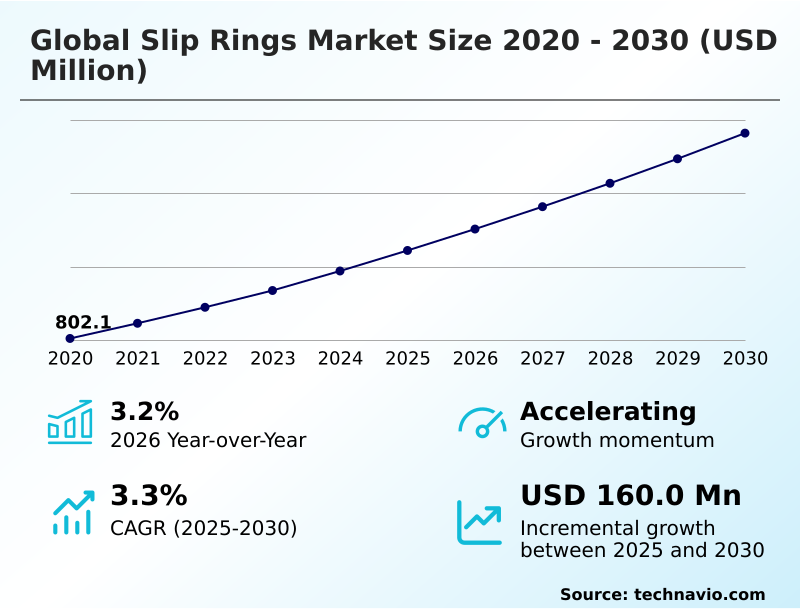
Get Key Insights on Market Forecast (PDF) Get Free Sample

How is the Slip Rings Market Segmented?

The slip rings industry research report provides comprehensive data (region-wise segment analysis), with forecasts and estimates in "USD million" for the period 2026-2030, as well as historical data from 2020-2024 for the following segments.

  • Application
    • Commercial
    • Industrial
    • Aerospace and defense
    • Marine
    • Others
  • Type
    • Upto 1500 rpm
    • Below 500 rpm
    • Above 1500 rpm
  • Product type
    • Through-bore
    • Capsule
    • Miniature
    • Pancake
    • Others
  • Geography
    • Europe
      • Germany
      • UK
      • France
      • Italy
      • Spain
      • The Netherlands
    • North America
      • US
      • Canada
      • Mexico
    • APAC
      • China
      • Japan
      • India
      • South Korea
      • Australia
      • Indonesia
    • South America
      • Brazil
      • Argentina
      • Chile
    • Middle East and Africa
      • Saudi Arabia
      • UAE
      • South Africa
      • Turkey
      • Israel

By Application Insights

The commercial segment is estimated to witness significant growth during the forecast period.

The commercial application sector heavily integrates advanced electromechanical rotary joint technology to facilitate uninterrupted mechanical rotation and electrical connectivity. Modern diagnostic imaging equipment and renewable energy platforms rely on a continuous power transfer mechanism to ensure seamless operational continuity.

Commercial wind turbine installations utilize a robust blade pitch control system with a bidirectional data flow channel to optimize energy capture. By implementing optical ethernet signal integration, commercial surveillance systems experience a 15% improvement in signal clarity during 360-degree rotation.

The transition toward a fiber optic rotary joint significantly aids in rotational signal degradation mitigation. Facilities are increasingly deploying a zero maintenance rotary union equipped with a gold alloy contact assembly to minimize friction.

This high bandwidth signal processing capability ensures continuous equipment operation.
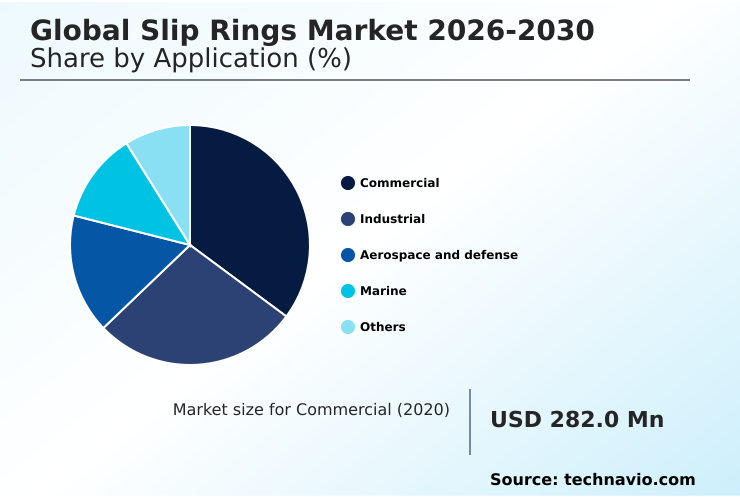
Get Free Sample

The Commercial segment was valued at USD 320.1 million in 2024 and showed a gradual increase during the forecast period.
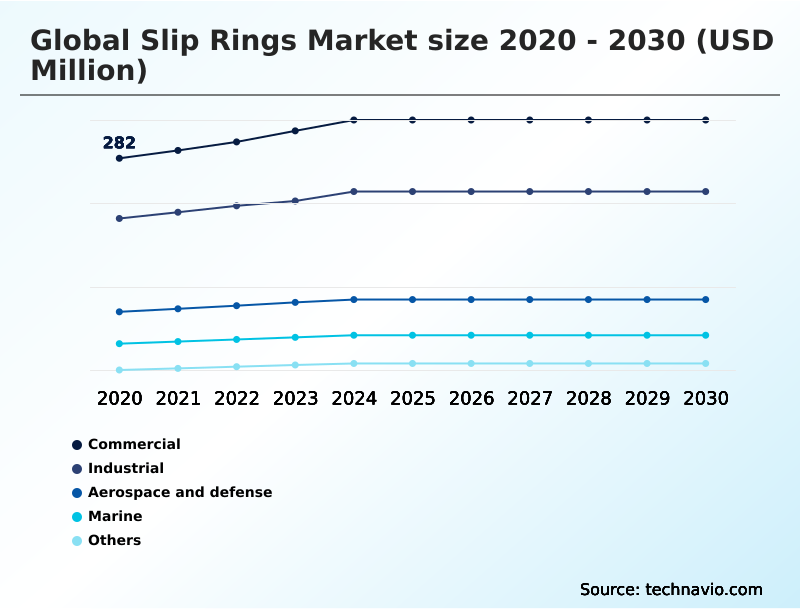
Get Free Sample

Regional Analysis

Europe is estimated to contribute 38.9% to the growth of the global market during the forecast period.Technavio’s analysts have elaborately explained the regional trends and drivers that shape the market during the forecast period.
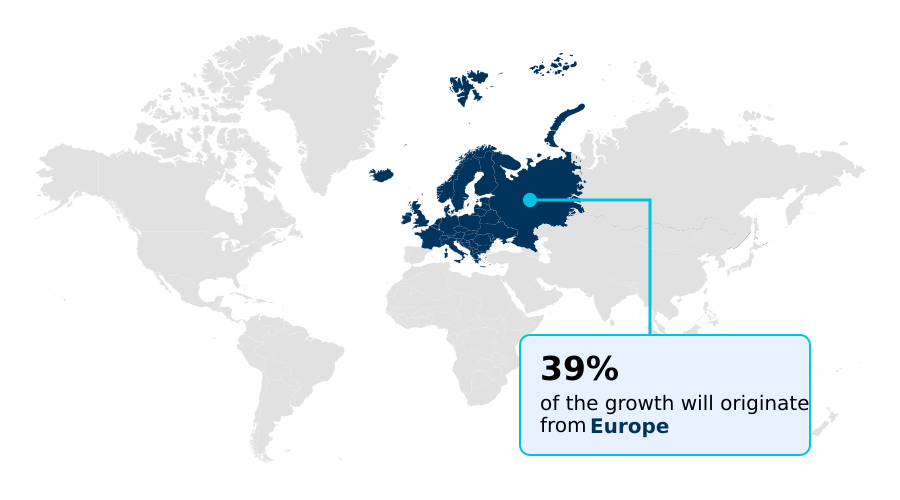
See How Slip Rings Market Demand is Rising in Europe Get Free Sample

The regional landscape of the Slip Rings Market reveals distinct adoption patterns shaped by industrial modernization and renewable energy investments.

Europe demonstrates a highly mature supply chain focused on wind energy and robotics, achieving a 40% higher penetration rate of advanced hybrid rotary joints compared to South America.

European manufacturers prioritize eliminating the traditional metal on metal sliding contact and graphite on metal contact in favor of a low inertia contact assembly. This shift reduces maintenance intervals and enhances equipment reliability.

Conversely, the APAC region exhibits a 25% faster adoption rate of automated manufacturing systems, driving localized demand for high density internal wiring configurations in consumer electronics assembly.

APAC facilities actively integrate a high voltage electrical channel to support heavy robotics, minimizing impedance mismatch signal reflection during rapid movement.

By leveraging near field inductive coupling, both regions experience a 15% reduction in mechanical failure rates across intensive industrial applications.

Market Dynamics

Our researchers analyzed the data with 2025 as the base year, along with the key drivers, trends, and challenges. A holistic analysis of drivers will help companies refine their marketing strategies to gain a competitive advantage.

  • The continuous evolution of industrial automation and smart manufacturing necessitates highly reliable power and data transfer solutions across dynamic machinery. Operators are increasingly upgrading legacy equipment to utilize a multi channel rotary signal transmission system, which significantly enhances the simultaneous routing of power, sensor telemetry, and pneumatic control lines.
  • This technological transition heavily relies on fiber optic rotary joint integration to prevent signal loss and eliminate electromagnetic interference in sensitive diagnostic and defense applications. When assessing operational planning and supply chain efficiency, facilities utilizing a contactless inductive power transfer mechanism report a 25% faster production cycle rate than those dependent on traditional friction-based contacts.
  • This operational advantage stems directly from the elimination of physical wear and conductive dust accumulation. Furthermore, heavy machinery sectors demand a robust high speed electromechanical rotary interface to endure severe environmental stress and rapid rotational velocities. To achieve extended lifecycle performance in harsh settings, manufacturers frequently incorporate a wear resistant gold contact assembly.
  • This material choice provides superior electrical conductivity and minimizes friction torque, ensuring steady performance without requiring frequent maintenance interventions. By implementing these advanced rotary transmission architectures, industrial enterprises effectively reduce mechanical downtime, streamline their maintenance supply chains, and optimize overall plant productivity without incurring excessive long-term operational costs.
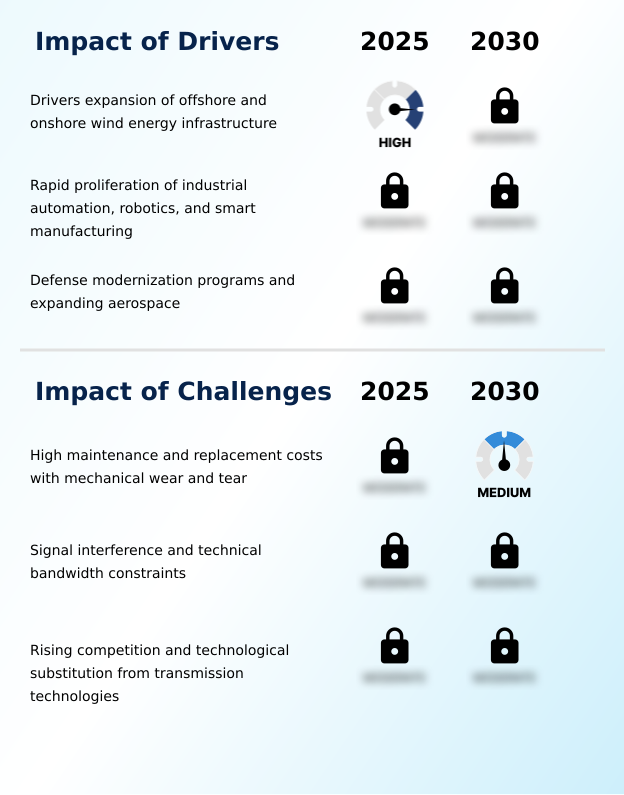
What are the key market drivers leading to the rise in the adoption of Slip Rings Industry?

  • The rapid expansion of both offshore and onshore wind energy infrastructure serves as a primary driver propelling market growth.

  • The global expansion of smart manufacturing and autonomous robotics serves as a primary catalyst accelerating the adoption of advanced rotary electrical interfaces.
  • Industrial facilities are rapidly deploying a hybrid rotary transmission architecture to manage complex data streams, resulting in a 25% improvement in automated assembly line throughput.
  • The necessity for high frequency signal isolation in sensitive defense and aerospace equipment drives the integration of a capacitive signal coupling interface.
  • By implementing contactless inductive power transfer, medical equipment operators have lowered energy consumption by 12% while eliminating friction-based wear.
  • Furthermore, the proliferation of unmanned aerial vehicles heavily relies on a miniature robotic gimbal connector and a compact capsule slip ring assembly.
  • Heavy machinery sectors continue to utilize a robust through bore slip ring to ensure continuous 360-degree rotation without cable fatigue.

What are the market trends shaping the Slip Rings Industry?

  • The transition toward optic rotary joints and hybrid multi-pass architectures represents a prominent upcoming market trend. This technological shift enables high-speed data transmission while minimizing mechanical friction in complex industrial systems.

  • The rapid migration toward frictionless and hybrid transmission architectures represents a defining trend reshaping industrial rotary systems. Heavy engineering sectors are increasingly adopting a hybrid fluid electrical rotary union to simultaneously route power, data, and hydraulics through a single rotating axis. This consolidation reduces equipment footprint and improves spatial efficiency by 20% in automated packaging lines.
  • In hazardous environments, the deployment of an explosion proof rotary connector and a water resistant subsea umbilical ensures continuous operation under extreme pressure. Medical imaging manufacturers are leveraging liquid metal contact technology to facilitate high resolution diagnostic telemetry, which has improved image processing speeds by 15% in clinical settings.
  • By utilizing a concentric conductive track layout protected by a stainless steel housing enclosure, operators effectively eliminate signal jitter and extend the operational lifespan of critical rotating machinery.

What challenges does the Slip Rings Industry face during its growth?

  • High maintenance and replacement costs associated with mechanical wear and tear remain a significant challenge impeding industry growth.

  • The inherent physical limitations of mechanical contact interfaces present a significant operational challenge for high-speed industrial machinery. Continuous friction between rotating components necessitates rigorous rotation cycle endurance testing to prevent premature equipment failure. In high speed rotary packaging applications, inadequate contact resistance fluctuation control leads to intermittent signal loss, which can decrease overall production efficiency by up to 18%.
  • Furthermore, the lack of effective conductive debris accumulation prevention causes elevated electrical noise and requires frequent maintenance interventions. To mitigate these issues, manufacturers must invest heavily in electromagnetic interference shielding and utilize a wear resistant precious metal, which increases initial component costs by 20%.
  • These structural constraints directly impact the mean time between failure, forcing plant operators to balance high recurring maintenance expenditures against the necessity for uninterrupted automated production.

Exclusive Technavio Analysis on Customer Landscape

The slip rings market forecasting report includes the adoption lifecycle of the market, covering from the innovator’s stage to the laggard’s stage. It focuses on adoption rates in different regions based on penetration. Furthermore, the slip rings market report also includes key purchase criteria and drivers of price sensitivity to help companies evaluate and develop their market growth analysis strategies.
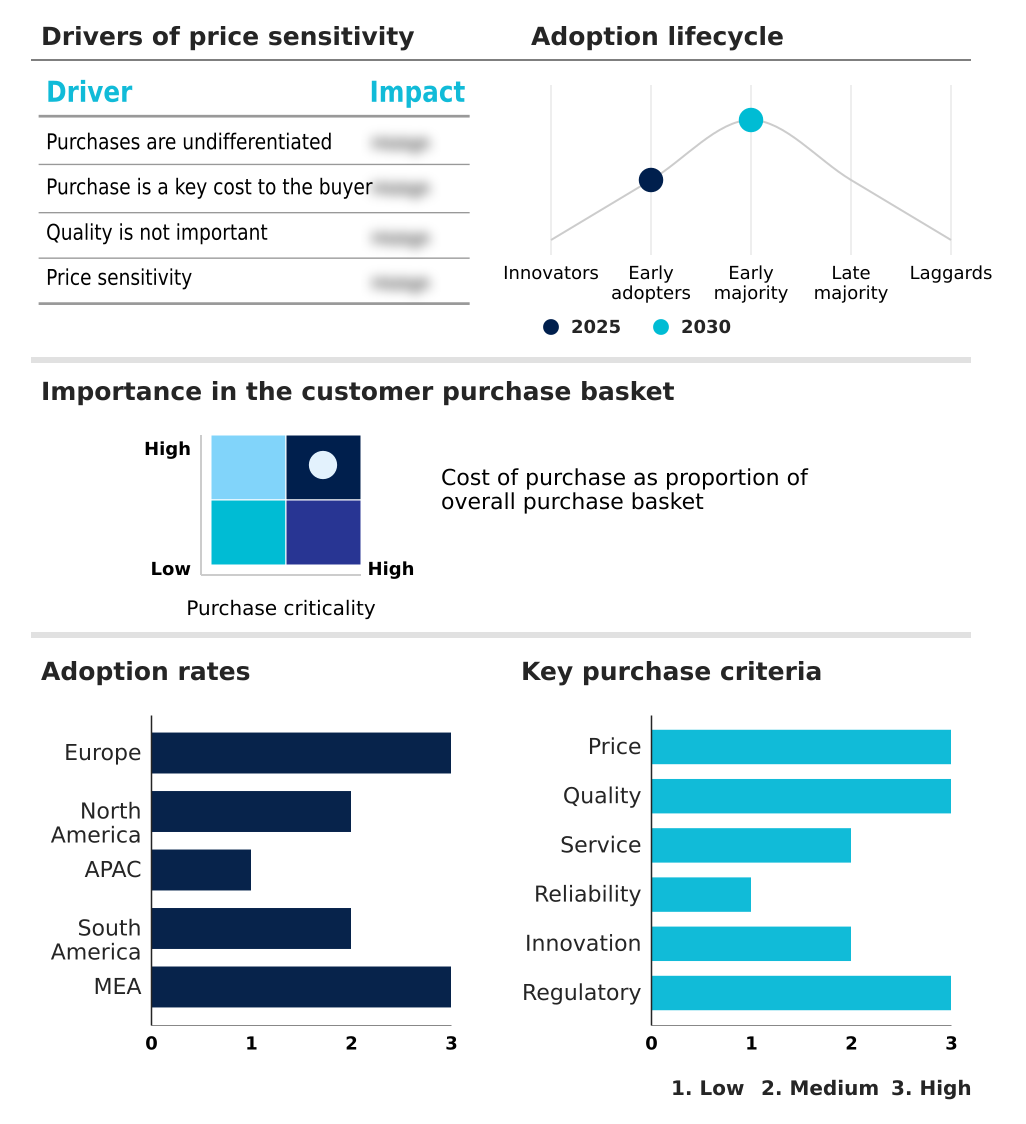
Customer Landscape of Slip Rings Industry

Competitive Landscape

Companies are implementing various strategies, such as strategic alliances, slip rings market forecast, partnerships, mergers and acquisitions, geographical expansion, and product/service launches, to enhance their presence in the industry.

Bifa Technology Co. Ltd. - Provides advanced capsule slip rings alongside specialized custom cable assemblies, rugged embedded computers, and precision optical bonding services designed to enhance complex industrial machinery performance.

The industry research and growth report includes detailed analyses of the competitive landscape of the market and information about key companies, including:

  • Bifa Technology Co. Ltd.
  • Endo Kogyo Co. Ltd
  • Everaxis
  • HEICO Corp.
  • Huaxuan Slip Ring
  • Ingiant Slip Ring
  • Kyoei Denki Co. Ltd.
  • Mercotac Inc.
  • Mersen Corporate Services SAS
  • Moog Inc.
  • Pandect Ltd
  • Rotary Systems Inc.
  • Rougier Electro
  • Schleifring GmbH
  • SenRing Electronics
  • SPM Special Machine Srl
  • STEMMANN TECHNIK GmbH
  • Sulal Tech Pvt Ltd
  • Talleres M.O.L.
  • United Equipment Accessories Inc.

Qualitative and quantitative analysis of companies has been conducted to help clients understand the wider business environment as well as the strengths and weaknesses of key industry players. Data is qualitatively analyzed to categorize companies as pure play, category-focused, industry-focused, and diversified; it is quantitatively analyzed to categorize companies as dominant, leading, strong, tentative, and weak.

Recent Development and News in Slip rings market

  • In the Industrial Machinery and Supplies and Components industry, the rapid deployment of automated guided vehicles and multi-axis robotics across smart factories has accelerated rotation cycle endurance testing standards, directly increasing Slip Rings demand to achieve a 20% improvement in mean time between failure while ensuring low electrical noise transmission.
  • The transition toward high-density offshore energy infrastructure has necessitated the deployment of heavy-duty blade pitch systems, driving Slip Rings demand for units capable of maintaining a high capacity power slip alongside uninterrupted high definition video monitoring while ensuring conductive debris accumulation prevention across corrosive marine environments.
  • Strict sterilization mandates in medical imaging manufacturing have accelerated the adoption of contactless power solutions, propelling Slip Rings demand for a frictionless rotary interface platform that requires zero contact oil maintenance elimination and achieves a 25% unplanned maintenance downtime reduction in sterile clinical settings.
  • The modernization of subsea exploration robotics has required superior telemetry capabilities, directly impacting Slip Rings demand for a dynamic positioning thruster connector that guarantees near zero signal attenuation and utilizes a stainless steel housing enclosure to withstand extreme hydrostatic pressures exceeding 3000 meters.

Dive into Technavio’s robust research methodology, blending expert interviews, extensive data synthesis, and validated models for unparalleled Slip Rings Market insights. See full methodology.

Market Scope
Page number 305
Base year 2025
Historic period 2020-2024
Forecast period 2026-2030
Growth momentum & CAGR Accelerate at a CAGR of 3.3%
Market growth 2026-2030 USD 160.0 million
Market structure Fragmented
YoY growth 2025-2026(%) 3.2%
Key countries Germany, UK, France, Italy, Spain, The Netherlands, US, Canada, Mexico, China, Japan, India, South Korea, Australia, Indonesia, Brazil, Argentina, Chile, Saudi Arabia, UAE, South Africa, Turkey and Israel
Competitive landscape Leading Companies, Market Positioning of Companies, Competitive Strategies, and Industry Risks

Request Free Sample

Research Analyst Overview

  • The structural dynamics of rotary electromechanical interfaces are undergoing a profound technological transformation to accommodate high-bandwidth industrial communications. Modern automated manufacturing facilities require uninterrupted power and data transfer across multi-axis robotic platforms and complex packaging machinery. The integration of advanced optical data channels and hybrid fluid-electrical transmission systems has become an operational necessity for heavy engineering and medical diagnostic sectors.
  • As industries transition toward zero-downtime manufacturing protocols, plant managers are prioritizing contactless transmission architectures to eliminate friction-induced wear. Facilities upgrading to these frictionless rotary systems have achieved a 30% reduction in mechanical maintenance delays compared to those utilizing legacy sliding brush contacts.
  • This shift directly influences strategic operational budgeting by drastically lowering the total cost of ownership over the equipment's lifecycle. Furthermore, strict hygiene and sterilization requirements in medical imaging mandate specialized enclosed rotary components that prevent the shedding of conductive debris.
  • The continuous evolution of these specialized transmission components ensures optimal signal integrity, empowering enterprises to maintain high operational throughput and safeguard critical infrastructure against unexpected mechanical failures.

What are the Key Data Covered in this Slip Rings Market Research and Growth Report?

  • What is the expected growth of the Slip Rings Market between 2026 and 2030?

    • USD 160 million, at a CAGR of 3.3%

  • What segmentation does the market report cover?

    • The report is segmented by Application (Commercial, Industrial, Aerospace and defense, Marine, and Others), Type (Upto 1500 rpm, Below 500 rpm, and Above 1500 rpm), Product Type (Through-bore, Capsule, Miniature, Pancake, and Others) and Geography (Europe, North America, APAC, South America, Middle East and Africa)

  • Which regions are analyzed in the report?

    • Europe, North America, APAC, South America and Middle East and Africa

  • What are the key growth drivers and market challenges?

    • Drivers expansion of offshore and onshore wind energy infrastructure, High maintenance and replacement costs with mechanical wear and tear

  • Who are the major players in the Slip Rings Market?

    • Bifa Technology Co. Ltd., Endo Kogyo Co. Ltd, Everaxis, HEICO Corp., Huaxuan Slip Ring, Ingiant Slip Ring, Kyoei Denki Co. Ltd., Mercotac Inc., Mersen Corporate Services SAS, Moog Inc., Pandect Ltd, Rotary Systems Inc., Rougier Electro, Schleifring GmbH, SenRing Electronics, SPM Special Machine Srl, STEMMANN TECHNIK GmbH, Sulal Tech Pvt Ltd, Talleres M.O.L. and United Equipment Accessories Inc.

Market Research Insights

  • The Slip Rings Market continues to evolve as industries demand highly reliable power and data transfer mechanisms for dynamic machinery. By integrating a frictionless rotary interface platform, industrial automation operators report a 35% unplanned maintenance downtime reduction compared to traditional mechanical brush systems.
  • Aerospace and defense sectors are increasingly adopting a vacuum rated rotary interface to ensure near zero signal attenuation in satellite tracking equipment. Furthermore, the deployment of advanced electromechanical components enables uninterrupted high definition video streaming in security applications, resulting in a 20% improvement in real-time surveillance accuracy.
  • These measurable enhancements in rotational signal stability and operational lifespan are critical for modernizing capital-intensive manufacturing networks.

We can help! Our analysts can customize this slip rings market research report to meet your requirements.

Get in touch

1. Executive Summary

1.1 Market overview

Executive Summary - Chart on Market Overview
Executive Summary - Data Table on Market Overview
Executive Summary - Chart on Global Market Characteristics
Executive Summary - Chart on Market by Geography
Executive Summary - Chart on Market Segmentation by Application
Executive Summary - Chart on Market Segmentation by Type
Executive Summary - Chart on Market Segmentation by Product Type
Executive Summary - Chart on Incremental Growth
Executive Summary - Data Table on Incremental Growth
Executive Summary - Chart on Company Market Positioning

2. Technavio Analysis

2.1 Analysis of price sensitivity, lifecycle, customer purchase basket, adoption rates, and purchase criteria

2.2 Criticality of inputs and Factors of differentiation

Chart on Overview on criticality of inputs and factors of differentiation

2.3 Factors of disruption

Chart on Overview on factors of disruption

2.4 Impact of drivers and challenges

Chart on Impact of drivers and challenges in 2025 and 2030

3. Market Landscape

3.1 Market ecosystem

Chart on Parent Market
Data Table on - Parent Market

3.2 Market characteristics

Chart on Market characteristics analysis

3.3 Value chain analysis

Chart on Value chain analysis

4. Market Sizing

4.1 Market definition

Data Table on Offerings of companies included in the market definition

4.2 Market segment analysis

Market segments

4.3 Market size 2025

4.4 Market outlook: Forecast for 2025-2030

Chart on Global - Market size and forecast 2025-2030 ($ million)
Data Table on Global - Market size and forecast 2025-2030 ($ million)
Chart on Global Market: Year-over-year growth 2025-2030 (%)
Data Table on Global Market: Year-over-year growth 2025-2030 (%)

5. Historic Market Size

5.1 Global Slip Rings Market 2020 - 2024

Historic Market Size - Data Table on Global Slip Rings Market 2020 - 2024 ($ million)

5.2 Application segment analysis 2020 - 2024

Historic Market Size - Application Segment 2020 - 2024 ($ million)

5.3 Type segment analysis 2020 - 2024

Historic Market Size - Type Segment 2020 - 2024 ($ million)

5.4 Product Type segment analysis 2020 - 2024

Historic Market Size - Product Type Segment 2020 - 2024 ($ million)

5.5 Geography segment analysis 2020 - 2024

Historic Market Size - Geography Segment 2020 - 2024 ($ million)

5.6 Country segment analysis 2020 - 2024

Historic Market Size - Country Segment 2020 - 2024 ($ million)

6. Qualitative Analysis

6.1 Impact of AI in Global Slip Rings Market

6.2 Impact of Geopolitical Conflicts on Global Slip Rings Market

7. Five Forces Analysis

7.1 Five forces summary

Five forces analysis - Comparison between 2025 and 2030

7.2 Bargaining power of buyers

Bargaining power of buyers - Impact of key factors 2025 and 2030

7.3 Bargaining power of suppliers

Bargaining power of suppliers - Impact of key factors in 2025 and 2030

7.4 Threat of new entrants

Threat of new entrants - Impact of key factors in 2025 and 2030

7.5 Threat of substitutes

Threat of substitutes - Impact of key factors in 2025 and 2030

7.6 Threat of rivalry

Threat of rivalry - Impact of key factors in 2025 and 2030

7.7 Market condition

Chart on Market condition - Five forces 2025 and 2030

8. Market Segmentation by Application

8.1 Market segments

Chart on Application - Market share 2025-2030 (%)
Data Table on Application - Market share 2025-2030 (%)

8.2 Comparison by Application

Chart on Comparison by Application
Data Table on Comparison by Application

8.3 Commercial - Market size and forecast 2025-2030

Chart on Commercial - Market size and forecast 2025-2030 ($ million)
Data Table on Commercial - Market size and forecast 2025-2030 ($ million)
Chart on Commercial - Year-over-year growth 2025-2030 (%)
Data Table on Commercial - Year-over-year growth 2025-2030 (%)

8.4 Industrial - Market size and forecast 2025-2030

Chart on Industrial - Market size and forecast 2025-2030 ($ million)
Data Table on Industrial - Market size and forecast 2025-2030 ($ million)
Chart on Industrial - Year-over-year growth 2025-2030 (%)
Data Table on Industrial - Year-over-year growth 2025-2030 (%)

8.5 Aerospace and defense - Market size and forecast 2025-2030

Chart on Aerospace and defense - Market size and forecast 2025-2030 ($ million)
Data Table on Aerospace and defense - Market size and forecast 2025-2030 ($ million)
Chart on Aerospace and defense - Year-over-year growth 2025-2030 (%)
Data Table on Aerospace and defense - Year-over-year growth 2025-2030 (%)

8.6 Marine - Market size and forecast 2025-2030

Chart on Marine - Market size and forecast 2025-2030 ($ million)
Data Table on Marine - Market size and forecast 2025-2030 ($ million)
Chart on Marine - Year-over-year growth 2025-2030 (%)
Data Table on Marine - Year-over-year growth 2025-2030 (%)

8.7 Others - Market size and forecast 2025-2030

Chart on Others - Market size and forecast 2025-2030 ($ million)
Data Table on Others - Market size and forecast 2025-2030 ($ million)
Chart on Others - Year-over-year growth 2025-2030 (%)
Data Table on Others - Year-over-year growth 2025-2030 (%)

8.8 Market opportunity by Application

Market opportunity by Application ($ million)
Data Table on Market opportunity by Application ($ million)

9. Market Segmentation by Type

9.1 Market segments

Chart on Type - Market share 2025-2030 (%)
Data Table on Type - Market share 2025-2030 (%)

9.2 Comparison by Type

Chart on Comparison by Type
Data Table on Comparison by Type

9.3 Upto 1500 rpm - Market size and forecast 2025-2030

Chart on Upto 1500 rpm - Market size and forecast 2025-2030 ($ million)
Data Table on Upto 1500 rpm - Market size and forecast 2025-2030 ($ million)
Chart on Upto 1500 rpm - Year-over-year growth 2025-2030 (%)
Data Table on Upto 1500 rpm - Year-over-year growth 2025-2030 (%)

9.4 Below 500 rpm - Market size and forecast 2025-2030

Chart on Below 500 rpm - Market size and forecast 2025-2030 ($ million)
Data Table on Below 500 rpm - Market size and forecast 2025-2030 ($ million)
Chart on Below 500 rpm - Year-over-year growth 2025-2030 (%)
Data Table on Below 500 rpm - Year-over-year growth 2025-2030 (%)

9.5 Above 1500 rpm - Market size and forecast 2025-2030

Chart on Above 1500 rpm - Market size and forecast 2025-2030 ($ million)
Data Table on Above 1500 rpm - Market size and forecast 2025-2030 ($ million)
Chart on Above 1500 rpm - Year-over-year growth 2025-2030 (%)
Data Table on Above 1500 rpm - Year-over-year growth 2025-2030 (%)

9.6 Market opportunity by Type

Market opportunity by Type ($ million)
Data Table on Market opportunity by Type ($ million)

10. Market Segmentation by Product Type

10.1 Market segments

Chart on Product Type - Market share 2025-2030 (%)
Data Table on Product Type - Market share 2025-2030 (%)

10.2 Comparison by Product Type

Chart on Comparison by Product Type
Data Table on Comparison by Product Type

10.3 Through-bore - Market size and forecast 2025-2030

Chart on Through-bore - Market size and forecast 2025-2030 ($ million)
Data Table on Through-bore - Market size and forecast 2025-2030 ($ million)
Chart on Through-bore - Year-over-year growth 2025-2030 (%)
Data Table on Through-bore - Year-over-year growth 2025-2030 (%)

10.4 Capsule - Market size and forecast 2025-2030

Chart on Capsule - Market size and forecast 2025-2030 ($ million)
Data Table on Capsule - Market size and forecast 2025-2030 ($ million)
Chart on Capsule - Year-over-year growth 2025-2030 (%)
Data Table on Capsule - Year-over-year growth 2025-2030 (%)

10.5 Miniature - Market size and forecast 2025-2030

Chart on Miniature - Market size and forecast 2025-2030 ($ million)
Data Table on Miniature - Market size and forecast 2025-2030 ($ million)
Chart on Miniature - Year-over-year growth 2025-2030 (%)
Data Table on Miniature - Year-over-year growth 2025-2030 (%)

10.6 Pancake - Market size and forecast 2025-2030

Chart on Pancake - Market size and forecast 2025-2030 ($ million)
Data Table on Pancake - Market size and forecast 2025-2030 ($ million)
Chart on Pancake - Year-over-year growth 2025-2030 (%)
Data Table on Pancake - Year-over-year growth 2025-2030 (%)

10.7 Others - Market size and forecast 2025-2030

Chart on Others - Market size and forecast 2025-2030 ($ million)
Data Table on Others - Market size and forecast 2025-2030 ($ million)
Chart on Others - Year-over-year growth 2025-2030 (%)
Data Table on Others - Year-over-year growth 2025-2030 (%)

10.8 Market opportunity by Product Type

Market opportunity by Product Type ($ million)
Data Table on Market opportunity by Product Type ($ million)

11. Customer Landscape

11.1 Customer landscape overview

Analysis of price sensitivity, lifecycle, customer purchase basket, adoption rates, and purchase criteria

12. Geographic Landscape

12.1 Geographic segmentation

Chart on Market share by geography 2025-2030 (%)
Data Table on Market share by geography 2025-2030 (%)

12.2 Geographic comparison

Chart on Geographic comparison
Data Table on Geographic comparison

12.3 Europe - Market size and forecast 2025-2030

Chart on Europe - Market size and forecast 2025-2030 ($ million)
Data Table on Europe - Market size and forecast 2025-2030 ($ million)
Chart on Europe - Year-over-year growth 2025-2030 (%)
Data Table on Europe - Year-over-year growth 2025-2030 (%)
Chart on Regional Comparison - Europe
Data Table on Regional Comparison - Europe

12.3.1 Germany - Market size and forecast 2025-2030

Chart on Germany - Market size and forecast 2025-2030 ($ million)
Data Table on Germany - Market size and forecast 2025-2030 ($ million)
Chart on Germany - Year-over-year growth 2025-2030 (%)
Data Table on Germany - Year-over-year growth 2025-2030 (%)

12.3.2 UK - Market size and forecast 2025-2030

Chart on UK - Market size and forecast 2025-2030 ($ million)
Data Table on UK - Market size and forecast 2025-2030 ($ million)
Chart on UK - Year-over-year growth 2025-2030 (%)
Data Table on UK - Year-over-year growth 2025-2030 (%)

12.3.3 France - Market size and forecast 2025-2030

Chart on France - Market size and forecast 2025-2030 ($ million)
Data Table on France - Market size and forecast 2025-2030 ($ million)
Chart on France - Year-over-year growth 2025-2030 (%)
Data Table on France - Year-over-year growth 2025-2030 (%)

12.3.4 Italy - Market size and forecast 2025-2030

Chart on Italy - Market size and forecast 2025-2030 ($ million)
Data Table on Italy - Market size and forecast 2025-2030 ($ million)
Chart on Italy - Year-over-year growth 2025-2030 (%)
Data Table on Italy - Year-over-year growth 2025-2030 (%)

12.3.5 Spain - Market size and forecast 2025-2030

Chart on Spain - Market size and forecast 2025-2030 ($ million)
Data Table on Spain - Market size and forecast 2025-2030 ($ million)
Chart on Spain - Year-over-year growth 2025-2030 (%)
Data Table on Spain - Year-over-year growth 2025-2030 (%)

12.3.6 The Netherlands - Market size and forecast 2025-2030

Chart on The Netherlands - Market size and forecast 2025-2030 ($ million)
Data Table on The Netherlands - Market size and forecast 2025-2030 ($ million)
Chart on The Netherlands - Year-over-year growth 2025-2030 (%)
Data Table on The Netherlands - Year-over-year growth 2025-2030 (%)

12.4 North America - Market size and forecast 2025-2030

Chart on North America - Market size and forecast 2025-2030 ($ million)
Data Table on North America - Market size and forecast 2025-2030 ($ million)
Chart on North America - Year-over-year growth 2025-2030 (%)
Data Table on North America - Year-over-year growth 2025-2030 (%)
Chart on Regional Comparison - North America
Data Table on Regional Comparison - North America

12.4.1 US - Market size and forecast 2025-2030

Chart on US - Market size and forecast 2025-2030 ($ million)
Data Table on US - Market size and forecast 2025-2030 ($ million)
Chart on US - Year-over-year growth 2025-2030 (%)
Data Table on US - Year-over-year growth 2025-2030 (%)

12.4.2 Canada - Market size and forecast 2025-2030

Chart on Canada - Market size and forecast 2025-2030 ($ million)
Data Table on Canada - Market size and forecast 2025-2030 ($ million)
Chart on Canada - Year-over-year growth 2025-2030 (%)
Data Table on Canada - Year-over-year growth 2025-2030 (%)

12.4.3 Mexico - Market size and forecast 2025-2030

Chart on Mexico - Market size and forecast 2025-2030 ($ million)
Data Table on Mexico - Market size and forecast 2025-2030 ($ million)
Chart on Mexico - Year-over-year growth 2025-2030 (%)
Data Table on Mexico - Year-over-year growth 2025-2030 (%)

12.5 APAC - Market size and forecast 2025-2030

Chart on APAC - Market size and forecast 2025-2030 ($ million)
Data Table on APAC - Market size and forecast 2025-2030 ($ million)
Chart on APAC - Year-over-year growth 2025-2030 (%)
Data Table on APAC - Year-over-year growth 2025-2030 (%)
Chart on Regional Comparison - APAC
Data Table on Regional Comparison - APAC

12.5.1 China - Market size and forecast 2025-2030

Chart on China - Market size and forecast 2025-2030 ($ million)
Data Table on China - Market size and forecast 2025-2030 ($ million)
Chart on China - Year-over-year growth 2025-2030 (%)
Data Table on China - Year-over-year growth 2025-2030 (%)

12.5.2 Japan - Market size and forecast 2025-2030

Chart on Japan - Market size and forecast 2025-2030 ($ million)
Data Table on Japan - Market size and forecast 2025-2030 ($ million)
Chart on Japan - Year-over-year growth 2025-2030 (%)
Data Table on Japan - Year-over-year growth 2025-2030 (%)

12.5.3 India - Market size and forecast 2025-2030

Chart on India - Market size and forecast 2025-2030 ($ million)
Data Table on India - Market size and forecast 2025-2030 ($ million)
Chart on India - Year-over-year growth 2025-2030 (%)
Data Table on India - Year-over-year growth 2025-2030 (%)

12.5.4 South Korea - Market size and forecast 2025-2030

Chart on South Korea - Market size and forecast 2025-2030 ($ million)
Data Table on South Korea - Market size and forecast 2025-2030 ($ million)
Chart on South Korea - Year-over-year growth 2025-2030 (%)
Data Table on South Korea - Year-over-year growth 2025-2030 (%)

12.5.5 Australia - Market size and forecast 2025-2030

Chart on Australia - Market size and forecast 2025-2030 ($ million)
Data Table on Australia - Market size and forecast 2025-2030 ($ million)
Chart on Australia - Year-over-year growth 2025-2030 (%)
Data Table on Australia - Year-over-year growth 2025-2030 (%)

12.5.6 Indonesia - Market size and forecast 2025-2030

Chart on Indonesia - Market size and forecast 2025-2030 ($ million)
Data Table on Indonesia - Market size and forecast 2025-2030 ($ million)
Chart on Indonesia - Year-over-year growth 2025-2030 (%)
Data Table on Indonesia - Year-over-year growth 2025-2030 (%)

12.6 South America - Market size and forecast 2025-2030

Chart on South America - Market size and forecast 2025-2030 ($ million)
Data Table on South America - Market size and forecast 2025-2030 ($ million)
Chart on South America - Year-over-year growth 2025-2030 (%)
Data Table on South America - Year-over-year growth 2025-2030 (%)
Chart on Regional Comparison - South America
Data Table on Regional Comparison - South America

12.6.1 Brazil - Market size and forecast 2025-2030

Chart on Brazil - Market size and forecast 2025-2030 ($ million)
Data Table on Brazil - Market size and forecast 2025-2030 ($ million)
Chart on Brazil - Year-over-year growth 2025-2030 (%)
Data Table on Brazil - Year-over-year growth 2025-2030 (%)

12.6.2 Argentina - Market size and forecast 2025-2030

Chart on Argentina - Market size and forecast 2025-2030 ($ million)
Data Table on Argentina - Market size and forecast 2025-2030 ($ million)
Chart on Argentina - Year-over-year growth 2025-2030 (%)
Data Table on Argentina - Year-over-year growth 2025-2030 (%)

12.6.3 Chile - Market size and forecast 2025-2030

Chart on Chile - Market size and forecast 2025-2030 ($ million)
Data Table on Chile - Market size and forecast 2025-2030 ($ million)
Chart on Chile - Year-over-year growth 2025-2030 (%)
Data Table on Chile - Year-over-year growth 2025-2030 (%)

12.7 Middle East and Africa - Market size and forecast 2025-2030

Chart on Middle East and Africa - Market size and forecast 2025-2030 ($ million)
Data Table on Middle East and Africa - Market size and forecast 2025-2030 ($ million)
Chart on Middle East and Africa - Year-over-year growth 2025-2030 (%)
Data Table on Middle East and Africa - Year-over-year growth 2025-2030 (%)
Chart on Regional Comparison - Middle East and Africa
Data Table on Regional Comparison - Middle East and Africa

12.7.1 Saudi Arabia - Market size and forecast 2025-2030

Chart on Saudi Arabia - Market size and forecast 2025-2030 ($ million)
Data Table on Saudi Arabia - Market size and forecast 2025-2030 ($ million)
Chart on Saudi Arabia - Year-over-year growth 2025-2030 (%)
Data Table on Saudi Arabia - Year-over-year growth 2025-2030 (%)

12.7.2 UAE - Market size and forecast 2025-2030

Chart on UAE - Market size and forecast 2025-2030 ($ million)
Data Table on UAE - Market size and forecast 2025-2030 ($ million)
Chart on UAE - Year-over-year growth 2025-2030 (%)
Data Table on UAE - Year-over-year growth 2025-2030 (%)

12.7.3 South Africa - Market size and forecast 2025-2030

Chart on South Africa - Market size and forecast 2025-2030 ($ million)
Data Table on South Africa - Market size and forecast 2025-2030 ($ million)
Chart on South Africa - Year-over-year growth 2025-2030 (%)
Data Table on South Africa - Year-over-year growth 2025-2030 (%)

12.7.4 Turkey - Market size and forecast 2025-2030

Chart on Turkey - Market size and forecast 2025-2030 ($ million)
Data Table on Turkey - Market size and forecast 2025-2030 ($ million)
Chart on Turkey - Year-over-year growth 2025-2030 (%)
Data Table on Turkey - Year-over-year growth 2025-2030 (%)

12.7.5 Israel - Market size and forecast 2025-2030

Chart on Israel - Market size and forecast 2025-2030 ($ million)
Data Table on Israel - Market size and forecast 2025-2030 ($ million)
Chart on Israel - Year-over-year growth 2025-2030 (%)
Data Table on Israel - Year-over-year growth 2025-2030 (%)

12.8 Market opportunity by geography

Market opportunity by geography ($ million)
Data Tables on Market opportunity by geography ($ million)

13. Drivers, Challenges, and Opportunity

13.1 Market drivers

Drivers expansion of offshore and onshore wind energy infrastructure
Rapid proliferation of industrial automation, robotics, and smart manufacturing
Defense modernization programs and expanding aerospace

13.2 Market challenges

High maintenance and replacement costs with mechanical wear and tear
Signal interference and technical bandwidth constraints
Rising competition and technological substitution from transmission technologies

13.3 Impact of drivers and challenges

Impact of drivers and challenges in 2025 and 2030

13.4 Market opportunities

Transition toward optic rotary joints and hybrid multi-pass architectures
Integration of contactless and wireless transmission technologies
Development of miniaturized capsule slip rings for autonomous systems

14. Competitive Landscape

14.1 Overview

14.2

Overview on criticality of inputs and factors of differentiation

14.3 Landscape disruption

Overview on factors of disruption

14.4 Industry risks

Impact of key risks on business

15. Competitive Analysis

15.1 Companies profiled

Companies covered

15.2 Company ranking index

15.3 Market positioning of companies

Matrix on companies position and classification

15.4 Bifa Technology Co. Ltd.

Bifa Technology Co. Ltd. - Overview
Bifa Technology Co. Ltd. - Product / Service
Bifa Technology Co. Ltd. - Key offerings
SWOT

15.5 Endo Kogyo Co. Ltd

Endo Kogyo Co. Ltd - Overview
Endo Kogyo Co. Ltd - Product / Service
Endo Kogyo Co. Ltd - Key offerings
SWOT

15.6 Everaxis

Everaxis - Overview
Everaxis - Product / Service
Everaxis - Key offerings
SWOT

15.7 HEICO Corp.

HEICO Corp. - Overview
HEICO Corp. - Product / Service
HEICO Corp. - Key offerings
SWOT

15.8 Ingiant Slip Ring

Ingiant Slip Ring - Overview
Ingiant Slip Ring - Product / Service
Ingiant Slip Ring - Key offerings
SWOT

15.9 Kyoei Denki Co. Ltd.

Kyoei Denki Co. Ltd. - Overview
Kyoei Denki Co. Ltd. - Product / Service
Kyoei Denki Co. Ltd. - Key offerings
SWOT

15.10 Mersen Corporate Services SAS

Mersen Corporate Services SAS - Overview
Mersen Corporate Services SAS - Business segments
Mersen Corporate Services SAS - Key offerings
Mersen Corporate Services SAS - Segment focus
SWOT

15.11 Moog Inc.

Moog Inc. - Overview
Moog Inc. - Business segments
Moog Inc. - Key offerings
Moog Inc. - Segment focus
SWOT

15.12 Pandect Ltd

Pandect Ltd - Overview
Pandect Ltd - Product / Service
Pandect Ltd - Key offerings
SWOT

15.13 Rotary Systems Inc.

Rotary Systems Inc. - Overview
Rotary Systems Inc. - Product / Service
Rotary Systems Inc. - Key offerings
SWOT

15.14 Schleifring GmbH

Schleifring GmbH - Overview
Schleifring GmbH - Product / Service
Schleifring GmbH - Key offerings
SWOT

15.15 SenRing Electronics

SenRing Electronics - Overview
SenRing Electronics - Product / Service
SenRing Electronics - Key offerings
SWOT

15.16 STEMMANN TECHNIK GmbH

STEMMANN TECHNIK GmbH - Overview
STEMMANN TECHNIK GmbH - Product / Service
STEMMANN TECHNIK GmbH - Key offerings
SWOT

15.17 Talleres M.O.L.

Talleres M.O.L. - Overview
Talleres M.O.L. - Product / Service
Talleres M.O.L. - Key offerings
SWOT

15.18 United Equipment Accessories Inc.

United Equipment Accessories Inc. - Overview
United Equipment Accessories Inc. - Product / Service
United Equipment Accessories Inc. - Key offerings
SWOT

16. Appendix

16.1 Scope of the report

Market definition
Objectives
Notes and caveats

16.2 Inclusions and exclusions checklist

Inclusions checklist
Exclusions checklist

16.3 Currency conversion rates for US$

16.4 Research methodology

16.5 Data procurement

Information sources

16.6 Data validation

16.7 Validation techniques employed for market sizing

16.8 Data synthesis

16.9 360 degree market analysis

16.10 List of abbreviations

Research Methodology

Technavio presents a detailed picture of the market by way of study, synthesis, and summation of data from multiple sources. The analysts have presented the various facets of the market with a particular focus on identifying the key industry influencers. The data thus presented is comprehensive, reliable, and the result of extensive research, both primary and secondary.

INFORMATION SOURCES

Primary sources

  • Manufacturers and suppliers
  • Channel partners
  • Industry experts
  • Strategic decision makers

Secondary sources

  • Industry journals and periodicals
  • Government data
  • Financial reports of key industry players
  • Historical data
  • Press releases

DATA ANALYSIS

Data Synthesis

  • Collation of data
  • Estimation of key figures
  • Analysis of derived insights

Data Validation

  • Triangulation with data models
  • Reference against proprietary databases
  • Corroboration with industry experts

REPORT WRITING

Qualitative

  • Market drivers
  • Market challenges
  • Market trends
  • Five forces analysis

Quantitative

  • Market size and forecast
  • Market segmentation
  • Geographical insights
  • Competitive landscape

Interested in this report?

Get your sample now to see our research methodology and insights!

Download Now

Frequently Asked Questions

Slip Rings market growth will increase by USD 160.0 million during 2026-2030.

The Slip Rings market is expected to grow at a CAGR of 3.3% during 2026-2030.

Slip Rings market is segmented by Application (Commercial, Industrial, Aerospace and defense, Marine, Others) Type (Upto 1500 rpm, Below 500 rpm, Above 1500 rpm) Product type (Through-bore, Capsule, Miniature, Pancake, Others)

Bifa Technology Co. Ltd., Endo Kogyo Co. Ltd, Everaxis, HEICO Corp., Huaxuan Slip Ring, Ingiant Slip Ring, Kyoei Denki Co. Ltd., Mercotac Inc., Mersen Corporate Services SAS, Moog Inc., Pandect Ltd, Rotary Systems Inc., Rougier Electro, Schleifring GmbH, SenRing Electronics, SPM Special Machine Srl, STEMMANN TECHNIK GmbH, Sulal Tech Pvt Ltd, Talleres M.O.L., United Equipment Accessories Inc. are a few of the key vendors in the Slip Rings market.

Europe will register the highest growth rate of 38.9% among the other regions. Therefore, the Slip Rings market in Europe is expected to garner significant business opportunities for the vendors during the forecast period.

Germany, UK, France, Italy, Spain, The Netherlands, US, Canada, Mexico, China, Japan, India, South Korea, Australia, Indonesia, Brazil, Argentina, Chile, Saudi Arabia, UAE, South Africa, Turkey, Israel

  • Drivers expansion of offshore and onshore wind energy infrastructure is the driving factor this market.

The Slip Rings market vendors should focus on grabbing business opportunities from the Application segment as it accounted for the largest market share in the base year.
RIA - Research AI Assistant
Ask RIA
