Packaging Machinery Market Size 2025-2029
The packaging machinery market size is forecast to increase by USD 15.6 billion, at a CAGR of 4.6% between 2024 and 2029.
- The market is experiencing significant growth due to the increasing demand for efficient and automated packaging solutions across various industries. One of the key drivers fueling this trend is the growing use of advanced technologies, such as pneumatic systems, in the development of packaging machinery. Pneumatic technology offers numerous benefits, including energy efficiency, ease of use, and versatility, making it an attractive option for manufacturers seeking to streamline their production processes. However, the market also faces challenges that require careful consideration. Stringent regulations governing the manufacturing and use of packaging machinery pose significant obstacles for market participants.
- Compliance with these regulations can be costly and time-consuming, necessitating substantial investments in research and development to ensure adherence. Companies must navigate these regulatory hurdles while also addressing the evolving needs of their customers and staying competitive in a rapidly changing market. To succeed, they must be agile, innovative, and responsive, continually seeking new ways to meet the demands of an increasingly sophisticated consumer base.
What will be the Size of the Packaging Machinery Market during the forecast period?

Explore in-depth regional segment analysis with market size data - historical 2019-2023 and forecasts 2025-2029 - in the full report.
Request Free Sample
The market continues to evolve, driven by advancements in technology and shifting consumer preferences. Protective packaging solutions, such as barrier films and coatings, are increasingly in demand to ensure product safety and longevity. Corrugated cardboard remains a staple in the industry, but digital printing and machine vision technologies are transforming its capabilities. Flexographic printing and offset printing offer versatility in labeling and branding. Food packaging applications require stringent compliance with FDA regulations and EU packaging directives. Industrial robotics and automation systems streamline production lines, optimizing line speed and integration. Secondary packaging, such as cartoning machines and palletizing robots, ensure efficient and effective distribution.
Packaging software and line maintenance are crucial for process optimization and quality control. Sustainable packaging innovations, including compostable and recyclable materials, are gaining traction. Tertiary packaging, such as pallets and shipping containers, reduce packaging waste. Packaging industry events provide a platform for showcasing the latest technologies and trends. Primary packaging, including filling machines and bagging machines, must meet the highest standards for product protection. Seal integrity testing and inspection systems ensure the quality and safety of the final product. Pharmaceutical packaging and industrial packaging applications require specialized solutions, such as laminated films and reduced packaging waste.
Packaging data analysis and production line management are essential for cost optimization and continuous improvement. The market's dynamism is reflected in its ongoing unfolding, with new technologies and regulations shaping its future.
How is this Packaging Machinery Industry segmented?
The packaging machinery industry research report provides comprehensive data (region-wise segment analysis), with forecasts and estimates in "USD billion" for the period 2025-2029, as well as historical data from 2019-2023 for the following segments.
- End-user
- Food
- Beverage
- Pharmaceutical
- Chemicals
- Others
- Product
- FFS machines
- Labeling and coding machines
- Closing and sealing machines
- Wrapping and bundling machines
- Others
- Type Of Packaging
- General packaging
- Modified atmosphere packaging (MAP)
- Vacuum packaging
- Geography
- North America
- US
- Canada
- Europe
- France
- Germany
- Italy
- UK
- APAC
- China
- India
- Japan
- South Korea
- Rest of World (ROW)
- North America
By End-user Insights
The food segment is estimated to witness significant growth during the forecast period.
The market encompasses various segments, including food, pharmaceutical, industrial, and consumer goods, among others. The food segment is the largest end-user in this market, driven by the increasing sales of packaged food and changing lifestyle trends. Food manufacturers prioritize the use of rigid packaging solutions, such as canning and plastic films, to ensure product protection and appeal to consumers. Canned food, in particular, is experiencing significant growth due to its long shelf-life and convenience. In addition, the demand for sustainable and eco-friendly packaging materials, like compostable and recyclable options, is gaining traction in response to environmental concerns.
Packaging testing plays a crucial role in ensuring product quality and safety, with testing methods including compression, drop, vibration, and seal integrity. Conveyor systems and case packing machines facilitate efficient production lines, while service contracts and spare parts ensure machine uptime. Machine vision and barcode printing streamline the packaging process, enabling real-time data analysis and production line management. Flexible packaging, including plastic films and laminated materials, offers advantages in terms of cost optimization and reduced waste. Automation systems, such as palletizing robots and filling machines, contribute to increased packaging line efficiency and productivity. Industrial robotics and inspection systems further enhance the automation process, ensuring consistent product quality and reducing human error.
Pharmaceutical packaging requires strict adherence to regulations, such as FDA compliance and EU packaging directives, to maintain product safety and efficacy. Corrugated cardboard and glass containers are commonly used for pharmaceutical packaging due to their protective properties. Packaging innovations, such as digital printing, machine vision, and sustainable materials, continue to shape the market landscape, offering opportunities for growth and differentiation. Overall, the market is a dynamic and evolving industry, driven by consumer preferences, technological advancements, and regulatory requirements.
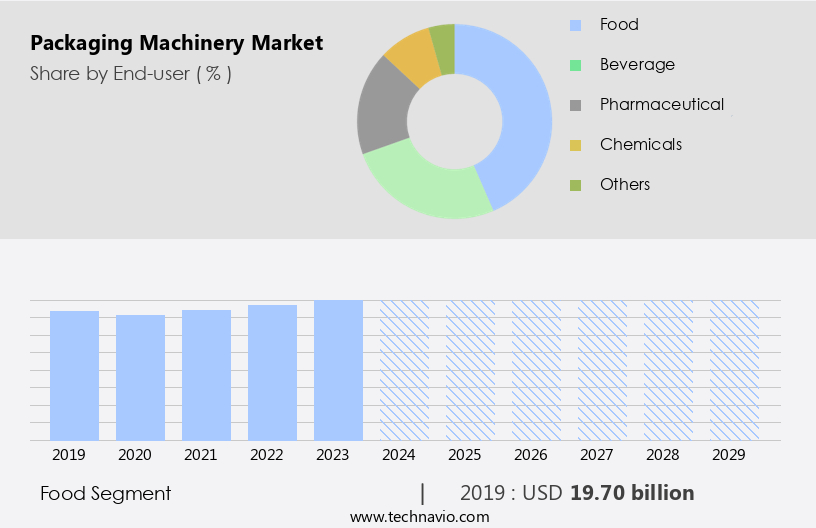
The Food segment was valued at USD 19.70 billion in 2019 and showed a gradual increase during the forecast period.
Regional Analysis
North America is estimated to contribute 30% to the growth of the global market during the forecast period.Technavio’s analysts have elaborately explained the regional trends and drivers that shape the market during the forecast period.

The market experiences dynamic growth in 2024, with APAC holding a substantial share. This region's market expansion is driven by developing economies like China and India, where the rapid expansion of industries such as e-commerce, FMCG, and personal care creates a significant demand for packaging machinery. APAC's manufacturing sector, which is highly concentrated, also contributes to the increased need for packaging solutions. Moreover, the e-commerce industry's growth in countries like China, India, and Japan further boosts the market. Packaging testing, digital printing, conveyor systems, case packing machines, service contracts, and packaging design are integral components of the market, with a focus on sustainable and eco-friendly packaging materials, such as barrier films, compostable packaging, and recyclable packaging.
Food packaging, pharmaceutical packaging, and industrial packaging are key application areas, with automation systems, machine vision, and inspection systems ensuring quality control and FDA compliance. The market also incorporates packaging innovations, such as palletizing robots, filling machines, and flow wrapping machines, to optimize production line efficiency and reduce packaging waste. Packaging software, printing technology, and packaging industry events facilitate process optimization, while packaging regulations and packaging data analysis ensure adherence to food safety standards and production line management.
Market Dynamics
Our researchers analyzed the data with 2024 as the base year, along with the key drivers, trends, and challenges. A holistic analysis of drivers will help companies refine their marketing strategies to gain a competitive advantage.
What are the key market drivers leading to the rise in the adoption of Packaging Machinery Industry?
- The escalating demand for packaging solutions in various industries serves as the primary market catalyst, driving the significant growth of the packaging machinery sector.
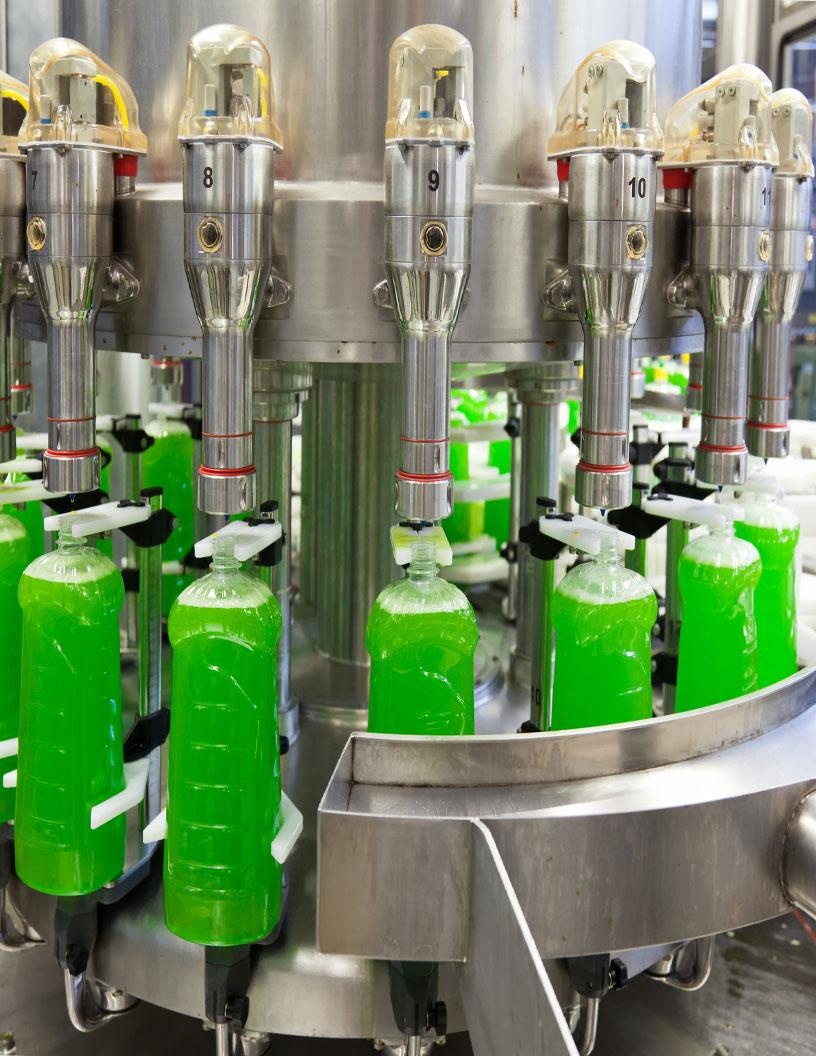
- Packaging machinery plays a crucial role in various industries, including food and beverage, pharmaceuticals, personal care, and consumer goods, by ensuring product protection and efficient distribution. In the food and beverage sector, packaging machinery is essential for tamper resistance and providing specialized physical, chemical, and biological protection. Proper packaging preserves food quality and reduces post-harvest losses, enabling reliable and rapid distribution within the value chain. Notable applications of packaging machinery in this industry include readymade food packaging, snack packaging, beer packaging, soft drinks packaging, energy drinks packaging, alcoholic beverages packaging, and ready-to-drink iced tea packaging. Industrial packaging solutions, such as bagging machines, filling machines, and laminated films, contribute to the market's growth.
- Additionally, advancements in technology, including process optimization, protective coatings, barcode printing, industrial robotics, and vibration tests, enhance the efficiency and quality of packaging machinery. Spare parts and quality control are essential aspects of the market, ensuring the longevity and performance of the equipment.
What are the market trends shaping the Packaging Machinery Industry?
- The increasing adoption of pneumatic technology in packaging machinery signifies a notable market trend. This technological advancement is a significant development in the packaging industry.
- Pneumatic technology plays a significant role in the market, particularly in applications requiring high-speed and precise movements. This technology, which utilizes compressed air to drive motion and actuate machine sequences, offers several advantages. Pneumatic systems are reliable, compact, and lightweight, making them an ideal choice for cost-effective control and actuation. In the packaging industry, pneumatic technology is extensively used in cartoning machines and form fill seal (FFS) machines. For instance, in cartoning machines, pneumatics facilitate the indexing of blank cartons onto the production line, move glue guns or other sealing devices, and drive components that form carton folds.
- The technology's ability to provide point-to-point movements and indexing makes it indispensable in these applications. Similarly, in FFS machines, pneumatics help control the filling process by actuating valves and moving various components. Moreover, pneumatic technology's integration with packaging software, labeling machines, and secondary packaging equipment enables line speed optimization, packaging line maintenance, and line integration. Adherence to FDA compliance and EU packaging directives is also facilitated through the use of pneumatic technology, ensuring the production of safe and compliant consumer goods packaging. Pneumatic technology's role in the packaging industry is not only limited to these applications but extends to printing technology, such as flexographic printing, where it is used to control the movement of printing plates and other components.
- Packaging machinery events and industry trends continue to emphasize the importance of innovative and efficient packaging solutions, further highlighting the significance of pneumatic technology in the market.
What challenges does the Packaging Machinery Industry face during its growth?
- The stringent regulations governing the manufacturing sector, particularly in packaging machinery, pose a significant challenge to the industry's growth trajectory.
- Packaging machinery manufacturers face the challenge of ensuring their equipment complies with regulatory bodies' and government agencies' packaging regulations. Compliance with these standards is mandatory for use in packaging operations. The British Retail Consortium (BRC) and the Institute of Packaging (IOP) collaboratively established the BRC/IOP Global Standards for Packaging and Packaging Materials. To meet these standards, manufacturers must ensure the quality and safety of the packaging their equipment produces. Good Manufacturing Practice (GMP) programs help ensure materials meet food contact standards and that products adhere to applicable regulations and intended uses. Packaging data analysis and production line management are crucial for optimizing packaging costs and improving efficiency.
- Technologies such as automation systems, compression test equipment, seal integrity testing, and inspection systems contribute to these objectives. Metal cans, flexible packaging, glass containers, and other packaging types continue to evolve with innovations, including recyclable and sustainable options. Food safety standards remain a top priority, emphasizing the importance of maintaining aseptic conditions during packaging processes. Flow wrapping machines and other packaging equipment play a significant role in enhancing packaging efficiency. Advanced technologies like automation systems, inspection systems, and data analysis tools enable manufacturers to streamline their operations and improve overall productivity. By focusing on these aspects, manufacturers can ensure their packaging machinery meets the evolving demands of the industry while maintaining the highest standards of quality and safety.
Exclusive Customer Landscape
The packaging machinery market forecasting report includes the adoption lifecycle of the market, covering from the innovator’s stage to the laggard’s stage. It focuses on adoption rates in different regions based on penetration. Furthermore, the packaging machinery market report also includes key purchase criteria and drivers of price sensitivity to help companies evaluate and develop their market growth analysis strategies.
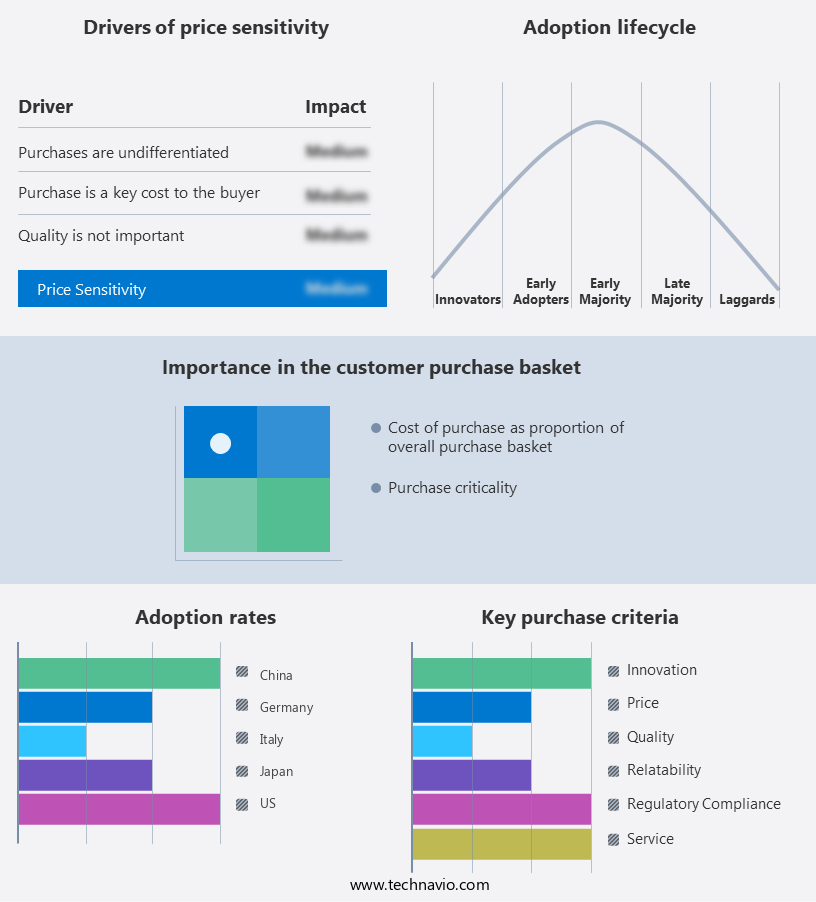
Customer Landscape
Key Companies & Market Insights
Companies are implementing various strategies, such as strategic alliances, packaging machinery market forecast, partnerships, mergers and acquisitions, geographical expansion, and product/service launches, to enhance their presence in the industry.
Aetnagroup S.p.A - This company specializes in providing advanced packaging machinery solutions. Our product line includes semi-automatic wrapping machines equipped with smart technology. These innovative systems streamline the packaging process, enhancing efficiency and productivity. Our commitment to cutting-edge technology ensures that our clients remain competitive in the marketplace. Our packaging machinery solutions cater to various industries, delivering customized, high-quality packaging for diverse product types. By integrating technology into our machinery, we enable businesses to optimize their operations and reduce costs. Our dedication to continuous improvement and innovation sets us apart from competitors.
The industry research and growth report includes detailed analyses of the competitive landscape of the market and information about key companies, including:
- Aetnagroup S.p.A
- B and H Packaging Ltd
- Barry Wehmiller Group Inc.
- CKD Corp.
- Coesia SpA
- Douglas Machine Inc.
- Duravant LLC
- FUJI MACHINERY Co. Ltd.
- GEA Group AG
- IMA Industria Macchine Automatiche Spa
- KHS GmbH
- Krones AG
- Langley Holdings Plc
- Maillis International SA
- Pro Mach Inc.
- Rovema GmbH
- SACMI Group
- SIG Group AG
- Syntegon Technology GmbH
- Tetra Laval SA
Qualitative and quantitative analysis of companies has been conducted to help clients understand the wider business environment as well as the strengths and weaknesses of key industry players. Data is qualitatively analyzed to categorize companies as pure play, category-focused, industry-focused, and diversified; it is quantitatively analyzed to categorize companies as dominant, leading, strong, tentative, and weak.
Recent Development and News in Packaging Machinery Market
- In February 2023, Körber AG, a global technology leader in intralogistics, announced the launch of its new packaging machinery brand, Körber Packaging Systems. This strategic move aims to combine the company's existing packaging machinery businesses under one roof, creating a more streamlined and comprehensive offering for customers (Körber AG press release, 2023).
- In March 2024, Bosch Packaging Technology and Siemens AG signed a collaboration agreement to integrate Bosch's packaging machinery portfolio with Siemens' MindSphere industrial IoT platform. This partnership aims to provide customers with enhanced connectivity, data analytics, and predictive maintenance services (Bosch Packaging Technology press release, 2024).
- In May 2024, Tetra Pak, a leading food processing and packaging solutions company, invested â¬100 million in its manufacturing site in Leingarten, Germany, to expand its production capacity for carton packaging equipment. This expansion is expected to increase the company's market share in the European market (Tetra Pak press release, 2024).
- In October 2025, Amcor, a global packaging solutions provider, acquired the flexible packaging business of Constantia Flexibles for â¬1.3 billion. This acquisition strengthens Amcor's position in the flexible packaging market and expands its geographic reach into new regions (Amcor press release, 2025).
Research Analyst Overview
- The market encompasses various aspects of production lines, including simulation, commissioning, upgrade, training, ergonomics, safety, documentation, expansion, troubleshooting, automation, retrofit, robotics, maintenance, design, validation, software, modernization, qualification, sensors, layout, shutdown, optimization, and startup. These elements continually evolve to meet the demands of businesses seeking efficient, safe, and sustainable packaging solutions. Packaging line simulation enables companies to test processes virtually before implementation, reducing potential errors and downtime. Commissioning ensures smooth start-up of new machinery, while upgrades and retrofits enhance line performance and extend equipment life. Training equips operators with the necessary skills to maximize productivity and minimize errors. Ergonomics and safety are critical considerations, with packaging lines designed to minimize strain on workers and provide a safe working environment.
- Documentation and validation processes ensure regulatory compliance and product quality. Expansion and optimization enable businesses to scale operations and increase throughput. Sensors and automation technologies streamline processes, improve accuracy, and reduce labor costs. Maintenance strategies focus on predictive and preventive measures to minimize downtime and prolong machinery life. Packaging line modernization and sustainability initiatives prioritize energy efficiency and waste reduction, aligning with corporate social responsibility goals.
Dive into Technavio’s robust research methodology, blending expert interviews, extensive data synthesis, and validated models for unparalleled Packaging Machinery Market insights. See full methodology.
|
Market Scope |
|
|
Report Coverage |
Details |
|
Page number |
232 |
|
Base year |
2024 |
|
Historic period |
2019-2023 |
|
Forecast period |
2025-2029 |
|
Growth momentum & CAGR |
Accelerate at a CAGR of 4.6% |
|
Market growth 2025-2029 |
USD 15.6 billion |
|
Market structure |
Fragmented |
|
YoY growth 2024-2025(%) |
4.4 |
|
Key countries |
US, China, Japan, India, South Korea, Germany, Canada, UK, France, and Italy |
|
Competitive landscape |
Leading Companies, Market Positioning of Companies, Competitive Strategies, and Industry Risks |
What are the Key Data Covered in this Packaging Machinery Market Research and Growth Report?
- CAGR of the Packaging Machinery industry during the forecast period
- Detailed information on factors that will drive the growth and forecasting between 2025 and 2029
- Precise estimation of the size of the market and its contribution of the industry in focus to the parent market
- Accurate predictions about upcoming growth and trends and changes in consumer behaviour
- Growth of the market across APAC, North America, Europe, South America, and Middle East and Africa
- Thorough analysis of the market’s competitive landscape and detailed information about companies
- Comprehensive analysis of factors that will challenge the packaging machinery market growth of industry companies
We can help! Our analysts can customize this packaging machinery market research report to meet your requirements.
 RIA -
RIA - 
