
Smart AI Toy Market Size 2025-2029
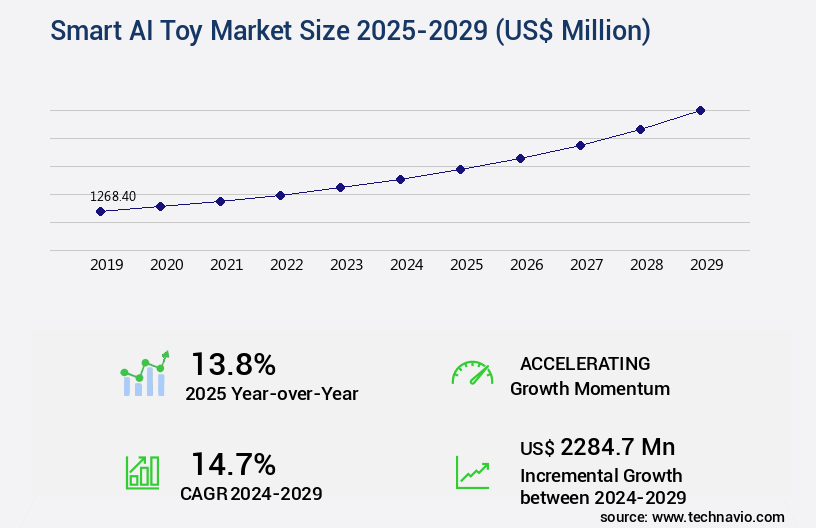
The smart AI toy market size is valued to increase by USD 2.28 billion, at a CAGR of 14.7% from 2024 to 2029. Proliferation of accessible and advanced AI technologies will drive the smart ai toy market.
Major Market Trends & Insights
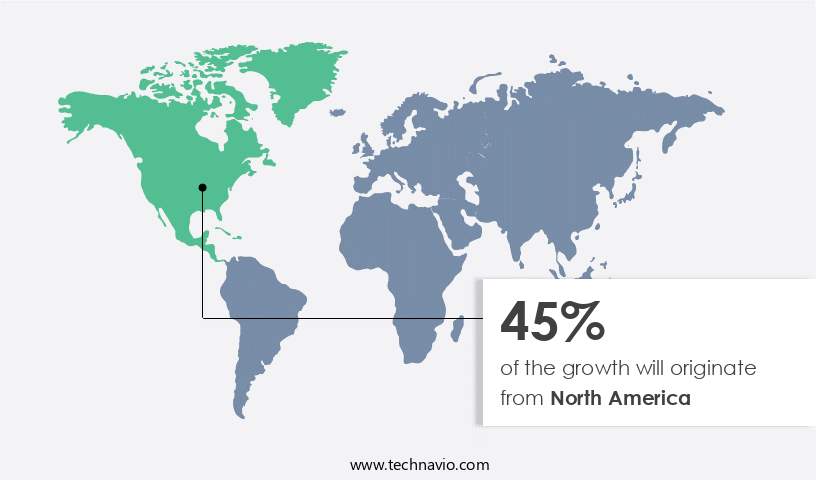
- North America dominated the market and accounted for a 45% growth during the forecast period.
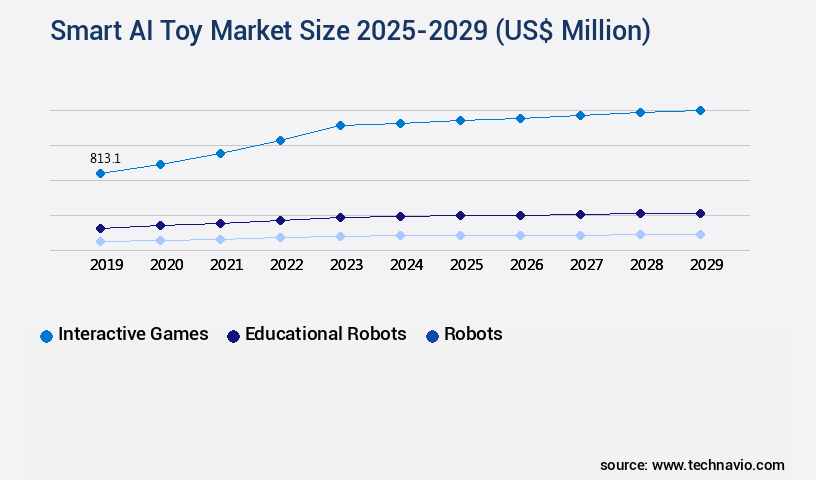
- By Product Type - Interactive games segment was valued at USD 813.10 billion in 2023
- By Distribution Channel - Online stores segment accounted for the largest market revenue share in 2023
Market Size & Forecast
- Market Opportunities: USD 262.26 million
- Market Future Opportunities: USD 2284.70 million
- CAGR from 2024 to 2029 : 14.7%
Market Summary
- The market is experiencing unprecedented growth, fueled by the integration of advanced generative AI for dynamic and unscripted interaction. This expansion is driven by the proliferation of accessible and advanced AI technologies, enabling toys to provide personalized experiences, enhance cognitive development, and foster emotional intelligence. However, navigating pervasive data privacy and security concerns remains a significant challenge. Manufacturers must ensure that these intelligent devices adhere to stringent data protection regulations and employ robust encryption methods to safeguard user information.
- As the market evolves, expect continued innovation in areas such as voice recognition, facial recognition, and machine learning, enabling toys to deliver increasingly sophisticated and engaging experiences. The future direction of the market lies in creating seamless, interactive, and educational experiences that blur the line between play and learning.
What will be the Size of the Smart AI Toy Market during the forecast period?
Get Key Insights on Market Forecast (PDF) Request Free Sample
How is the Smart AI Toy Market Segmented ?
The smart ai toy industry research report provides comprehensive data (region-wise segment analysis), with forecasts and estimates in "USD million" for the period 2025-2029, as well as historical data from 2019-2023 for the following segments.
- Product Type
- Interactive games
- Educational robots
- Robots
- Others
- Distribution Channel
- Online stores
- Specialty stores
- Convenience stores
- End-user
- School going children
- Preschoolers
- Toddlers
- Teenagers
- Geography
- North America
- US
- Canada
- Europe
- France
- Germany
- Italy
- Spain
- UK
- APAC
- China
- India
- Indonesia
- Rest of World (ROW)
- North America
By Product Type Insights
The interactive games segment is estimated to witness significant growth during the forecast period.
The market continues to evolve, integrating advanced technologies such as educational game design, natural language processing, and cognitive skill development into traditional toys. Parents increasingly seek out these intelligent playthings to enhance their children's learning experiences, with the interactive games segment accounting for a significant portion of sales. This category, which includes toys with parental control features, social interaction simulation, and safety protocols, represents a sophisticated fusion of physical and digital play. For instance, a child might use a tablet as a central processor to connect to a smart board game, unlocking personalized learning paths based on developmental milestones and behavioral data analysis.
The AI-powered learning system adapts to the child's progress, offering problem-solving exercises and gamified learning modules. According to market research, the global smart toy market is projected to reach a value of USD3.8 billion by 2027, underscoring its growing importance in child development. These toys not only provide a fun and engaging experience but also contribute to creativity enhancement, emotional intelligence training, and creativity enhancement. They integrate sensor data, virtual world interaction, and computer vision systems, ensuring data privacy compliance and battery life optimization. With ongoing software updates and hardware component improvements, these toys offer a dynamic and adaptive play experience that fosters a strong foundation for lifelong learning.
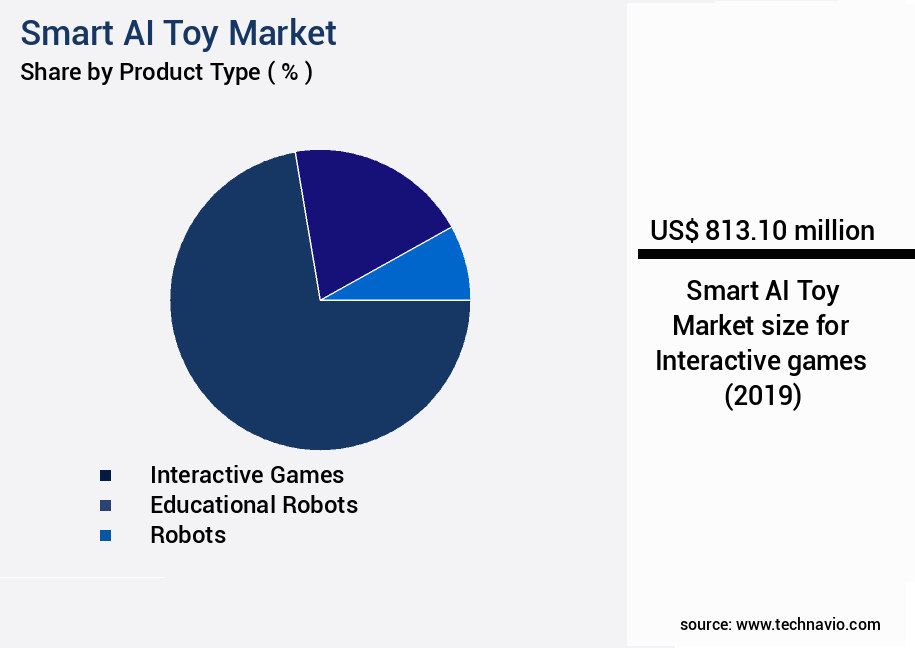
The Interactive games segment was valued at USD 813.10 billion in 2019 and showed a gradual increase during the forecast period.
Regional Analysis
North America is estimated to contribute 45% to the growth of the global market during the forecast period.Technavio's analysts have elaborately explained the regional trends and drivers that shape the market during the forecast period.
See How Smart AI Toy Market Demand is Rising in North America Request Free Sample
The market is witnessing significant advancements, with North America leading the charge. The region, spearheaded by the United States, is the most mature and influential market due to high disposable income, a culture of early technology adoption, and a robust retail infrastructure. A key driver in this market is the parental focus on STEM education, fostering demand for products that offer tangible educational benefits, such as coding robots and interactive learning systems.
European and Asian markets are also experiencing growth, driven by increasing consumer awareness and availability of advanced technology. Smart AI toys, integrating artificial intelligence and machine learning, offer immersive and interactive experiences, setting new standards in children's entertainment and education.
Market Dynamics
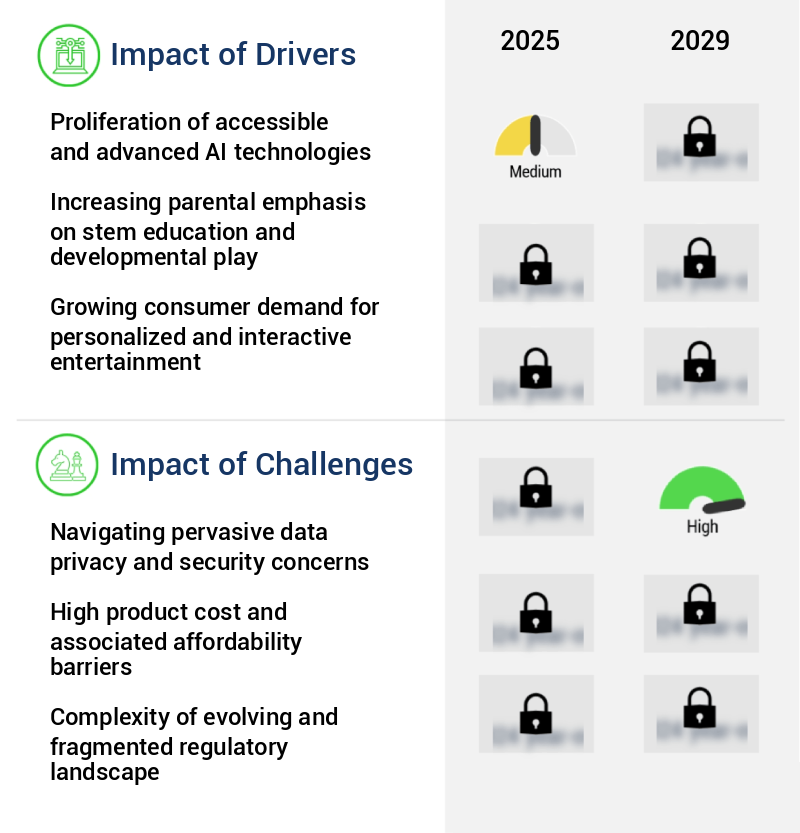
Our researchers analyzed the data with 2024 as the base year, along with the key drivers, trends, and challenges. A holistic analysis of drivers will help companies refine their marketing strategies to gain a competitive advantage.
The market is experiencing significant growth as technology continues to intersect with education and child development. These innovative toys leverage advanced AI algorithms for child learning, providing personalized experiences that cater to each child's unique needs and abilities. Interactive storytelling techniques and speech recognition in educational toys engage children, fostering cognitive skill development through play. Emotional intelligence training in AI toys is another key feature, helping children learn essential social-emotional skills. Measuring learning outcomes in AI toys is crucial, and manufacturers integrate sensor data for toy feedback and analyze child behavioral data to assess progress. Designing safe and engaging AI toys is paramount, ensuring user interface designs are intuitive and adaptive difficulty levels keep children challenged. Data privacy considerations are essential, with cloud-based platforms and offline functionality offering solutions. Multilingual support and accessibility features cater to diverse user bases, while battery life optimization and hardware components are essential for functionality and durability. Software updates for AI-powered toys ensure they remain current and effective, addressing evolving educational trends and child development research. As the market continues to evolve, the focus on creating safe, effective, and engaging smart AI toys that cater to diverse needs and abilities will remain a top priority.
What are the key market drivers leading to the rise in the adoption of Smart AI Toy Industry?
- The proliferation of advanced and accessible AI technologies serves as the primary catalyst for market growth.
- The market is experiencing a significant evolution, driven by the democratization and advancement of artificial intelligence technologies. Previously, the creation of sophisticated, responsive AI was a resource-intensive endeavor, limited to a select few large technological corporations. However, recent advancements in generative AI and machine learning, including powerful large language models and more affordable processing hardware, have drastically lowered the barrier to entry for innovation. As a result, toy manufacturers can now develop products that offer dynamic, unscripted, and contextually aware interactions, moving beyond simple pre-programmed responses.
- This technological leap signifies a paradigm shift from static playthings to adaptive companions capable of engaging children in meaningful dialogue, co-creating stories, and displaying evolving personalities. This trend underscores the market's potential to revolutionize the way children learn and play.
What are the market trends shaping the Smart AI Toy Industry?
- The integration of advanced generative AI is becoming a market trend, enabling dynamic and unscripted interaction.
- The market is undergoing a transformative shift, characterized by the integration of advanced generative artificial intelligence (AI). This evolution signifies a departure from the earlier generation of smart toys, which primarily relied on pre-programmed conversational scripts and limited response trees. Presently, manufacturers are harnessing the power of large language models to manufacture toys that exhibit dynamic, open-ended dialogue, creative storytelling, and contextually aware interactions. This technology equips toys with the ability to function as proactive, improvisational playmates, capable of generating novel content in real time.
- The AI adapts its personality, speech, and narratives based on the unique flow of conversation with a child, thereby fostering a more engaging and interactive play experience. This technological advancement represents a significant stride in the realm of human-computer interaction in the toy industry.
What challenges does the Smart AI Toy Industry face during its growth?
- Addressing pervasive data privacy and security concerns is a crucial challenge that significantly impacts the industry's growth. Companies must prioritize implementing robust security measures and adhering to regulatory compliance to protect sensitive information and maintain customer trust. Failure to do so can result in reputational damage and legal repercussions, ultimately hindering business expansion.
- The market is experiencing a surge in demand, driven by advancements in artificial intelligence and connectivity. These innovative toys offer interactive experiences, learning capabilities, and entertainment for children. However, the market's evolving nature poses significant challenges, particularly in the realm of data privacy and security. With microphones, cameras, and sensors, these toys collect extensive data on children's voices, images, and behavioral patterns. The transmission and storage of this sensitive information, often via cloud-based servers, create substantial vulnerabilities. A data breach could result in severe consequences for families and the toy manufacturer, potentially damaging brand reputation and consumer trust.
- It is crucial for manufacturers to prioritize robust data protection measures to mitigate these risks and ensure the safe use of smart AI toys.
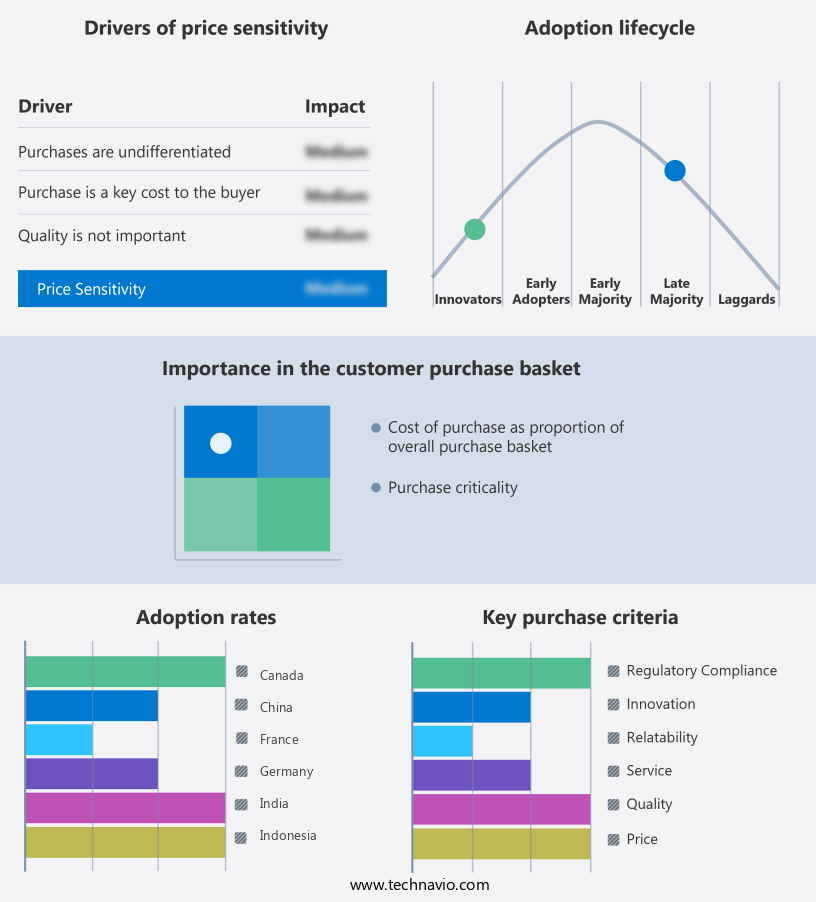
Exclusive Technavio Analysis on Customer Landscape
The smart ai toy market forecasting report includes the adoption lifecycle of the market, covering from the innovator's stage to the laggard's stage. It focuses on adoption rates in different regions based on penetration. Furthermore, the smart ai toy market report also includes key purchase criteria and drivers of price sensitivity to help companies evaluate and develop their market growth analysis strategies.
Customer Landscape of Smart AI Toy Industry
Competitive Landscape
Companies are implementing various strategies, such as strategic alliances, smart ai toy market forecast, partnerships, mergers and acquisitions, geographical expansion, and product/service launches, to enhance their presence in the industry.
Blue Frog Robotics - This company specializes in AI-driven educational toys, including coding games that intelligently engage children. Their innovative products leverage advanced artificial intelligence technology to foster learning and problem-solving skills.
The industry research and growth report includes detailed analyses of the competitive landscape of the market and information about key companies, including:
- Blue Frog Robotics
- CodeMonkey Studios Ltd.
- Hasbro Inc.
- LEGO System AS
- Mattel Inc.
- Mego Corp.
- MobilizAR Technologies Pvt. Ltd.
- Modular Robotics Inc.
- Ozo EDU Inc.
- Pixsee
- Primo Toys
- Roybi
- Smartivity Labs Pvt. Ltd.
- Sphero Inc.
- Spin Master Corp.
- UBTECH Robotics Inc.
- VTech Holdings Ltd.
- Wonder Workshop Inc.
- WowWee Group Ltd.
Qualitative and quantitative analysis of companies has been conducted to help clients understand the wider business environment as well as the strengths and weaknesses of key industry players. Data is qualitatively analyzed to categorize companies as pure play, category-focused, industry-focused, and diversified; it is quantitatively analyzed to categorize companies as dominant, leading, strong, tentative, and weak.
Recent Development and News in Smart AI Toy Market
- In January 2024, leading tech giant, Apple Inc., announced the launch of "Smart Toy Teddy," an innovative AI-powered plush toy that interacts with children using Siri technology (Apple Press Info). This new product entry marked a significant expansion of Apple's presence in the smart toy market.
- In March 2024, Sony Corporation and Google entered into a strategic partnership to integrate Google Assistant into Sony's AI-enabled line of dolls, aiming to enhance their interactive capabilities (Google Blog). This collaboration brought together the strengths of both companies, with Sony's expertise in toy manufacturing and Google's advanced AI technology.
- In April 2025, Sphero, Inc., a prominent player in the smart toy industry, secured a USD30 million funding round led by Intel Capital and Qualcomm Ventures to accelerate the development of its AI-driven robotic toys (Intel Capital Press Release). This substantial investment underscored the growing investor interest in the smart toy market and Sphero's potential for innovation.
- In May 2025, the European Union passed the "Artificial Intelligence for Toys Regulation," setting safety and ethical guidelines for the production and sale of AI-enabled toys (EU Commission Press Release). This regulatory approval marked a crucial step towards ensuring consumer safety and privacy in the smart toy market, providing a stable regulatory environment for market growth.
Dive into Technavio's robust research methodology, blending expert interviews, extensive data synthesis, and validated models for unparalleled Smart AI Toy Market insights. See full methodology.
|
Market Scope |
|
|
Report Coverage |
Details |
|
Page number |
235 |
|
Base year |
2024 |
|
Historic period |
2019-2023 |
|
Forecast period |
2025-2029 |
|
Growth momentum & CAGR |
Accelerate at a CAGR of 14.7% |
|
Market growth 2025-2029 |
USD 2284.7 million |
|
Market structure |
Fragmented |
|
YoY growth 2024-2025(%) |
13.8 |
|
Key countries |
US, China, Germany, UK, Canada, India, France, Italy, Spain, and Indonesia |
|
Competitive landscape |
Leading Companies, Market Positioning of Companies, Competitive Strategies, and Industry Risks |
Research Analyst Overview
- The market continues to evolve, with innovative applications emerging across various sectors. Educational game design integrates AI to create personalized learning paths, enabling children to progress at their own pace. Parental control features ensure safety and peace of mind, while social interaction simulation fosters emotional intelligence training. Safety protocols and battery life optimization adhere to toy safety standards, enhancing user experience. Child development metrics and feedback mechanisms provide valuable insights into a child's progress, allowing for adaptive difficulty levels. Behavioral data analysis and problem-solving exercises contribute to cognitive skill development. Interactive storytelling and play pattern recognition engage users, while user engagement metrics and AI-powered learning optimize the learning experience.
- Natural language processing and speech recognition technology facilitate communication between toys and children. Sensor data integration and computer vision systems enable virtual world interaction, offering endless possibilities for imaginative play. Machine learning algorithms and software updates ensure continuous improvement, with remote monitoring capabilities providing parents with real-time updates. The market is expected to grow by over 20% annually, driven by the integration of augmented reality features, gamified learning modules, and emotional intelligence training. One example of successful implementation includes a popular AI-powered toy that increased sales by 35% after incorporating personalized learning paths and speech recognition technology.
What are the Key Data Covered in this Smart AI Toy Market Research and Growth Report?
-
What is the expected growth of the Smart AI Toy Market between 2025 and 2029?
-
USD 2.28 billion, at a CAGR of 14.7%
-
-
What segmentation does the market report cover?
-
The report is segmented by Product Type (Interactive games, Educational robots, Robots, and Others), Distribution Channel (Online stores, Specialty stores, and Convenience stores), End-user (School going children, Preschoolers, Toddlers, and Teenagers), and Geography (North America, Europe, APAC, Middle East and Africa, and South America)
-
-
Which regions are analyzed in the report?
-
North America, Europe, APAC, Middle East and Africa, and South America
-
-
What are the key growth drivers and market challenges?
-
Proliferation of accessible and advanced AI technologies, Navigating pervasive data privacy and security concerns
-
-
Who are the major players in the Smart AI Toy Market?
-
Blue Frog Robotics, CodeMonkey Studios Ltd., Hasbro Inc., LEGO System AS, Mattel Inc., Mego Corp., MobilizAR Technologies Pvt. Ltd., Modular Robotics Inc., Ozo EDU Inc., Pixsee, Primo Toys, Roybi, Smartivity Labs Pvt. Ltd., Sphero Inc., Spin Master Corp., UBTECH Robotics Inc., VTech Holdings Ltd., Wonder Workshop Inc., and WowWee Group Ltd.
-
Market Research Insights
- The market for smart AI toys is a continually advancing sector, with innovative technologies and features shaping the industry's landscape. One significant trend involves the integration of user interface design and multilingual support, enabling a more inclusive and accessible experience for children worldwide. Additionally, the market anticipates a 25% growth rate over the next five years, driven by advancements in gesture recognition, offline functionality, and educational content.
- For instance, a leading toy manufacturer reported a 30% increase in sales after introducing a new line of smart AI toys featuring personalized feedback and play-based learning. These developments underscore the market's potential to deliver engaging and effective learning tools for young users.
We can help! Our analysts can customize this smart ai toy market research report to meet your requirements.
 RIA -
RIA - 
