Smart Toys Market Analysis North America, Europe, APAC, Middle East and Africa, South America - US, China, Japan, UK, Germany - Size and Forecast 2024-2028

Smart Toys Market Analysis North America, Europe, APAC, Middle East and Africa, South America - US, China, Japan, UK, Germany - Size and Forecast 2024-2028

Published: Jul 2024 164 Pages SKU: IRTNTR44886

Market Overview at a Glance

$7.39 B
Market Opportunity
17.61%
CAGR
13.4
YoY growth 2023-2024(%)

Smart Toys Market Size 2024-2028 

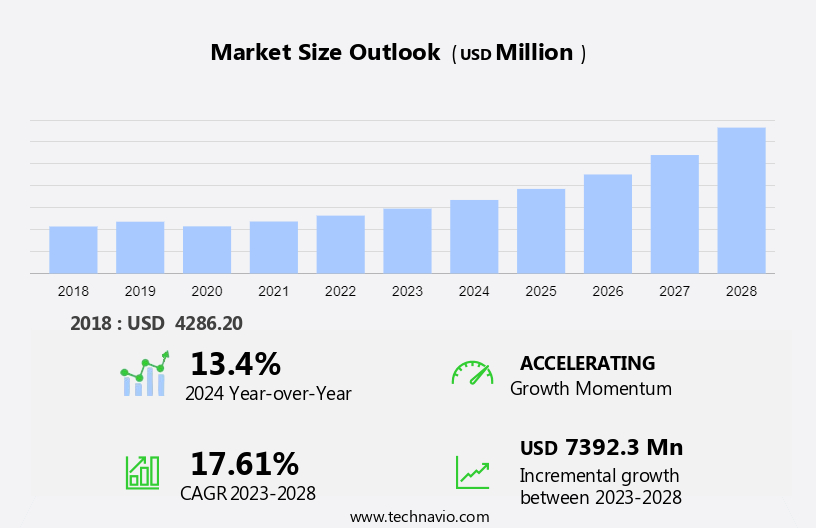
The smart toys market size is forecast to increase by USD 7.39 billion at a CAGR of 17.61% between 2023 and 2028. The market is experiencing significant growth due to the increasing digital engagement of tech-savvy youngsters. Interactive games and educational robots are gaining popularity as they offer unique learning experiences. Advanced technologies such as Radio-Frequency Identification (RFID) and Near Field Communication (NFC) are being integrated into toys, enabling offline and online interactions. The adoption of STEM toys for children's skills enhancement is another driving factor. However, the high availability of substitutes may pose a challenge to market growth. Companies must focus on innovation and providing value-added features to maintain a competitive edge. This market analysis report provides an in-depth examination of these trends and challenges, offering insights into the future growth prospects of the smart toys industry.

Market Analysis

Smart Toys Market Size

 Request Free Sample

The market is witnessing significant growth as technology continues to play a pivotal role in children's education. These innovative toys integrate science, technology, engineering, and mathematics (STEM) concepts into play, making learning fun and engaging. Smart toys are not just toys; they are interactive devices designed to stimulate creativity and critical thinking skills. They use various technologies like robotics, AI algorithms, and IoT to create lucrative experiences.

Moreover, one of the most popular trends in the market is education-based toys. Companies like Fisher-Price and Mattel Creations Virtual have introduced AI-powered toys that teach STEM content through gamification. For instance, Fisher-Price's Brown Toy Box series uses cause-and-effect interactions to help children understand basic concepts in science and math. Similarly, Smartgurlz offers robotics kits that allow girls to build and code their own robots. Another trend is the integration of blockchain technology into smart toys. Companies like Velan Studios and Rarible are developing digital collectibles that can be bought, sold, and traded on the blockchain. This not only adds a new layer of excitement to play but also introduces children to the concept of digital ownership and transactions.

Further, the middle class family population is a significant target demographic for smart toys. Parents are increasingly looking for ways to provide their children with high-quality educational experiences at home. Smart toys offer an affordable and convenient solution, allowing children to learn while having fun. In conclusion, the market is witnessing rapid growth as technology continues to transform the way children learn. Education-based toys, gamification, and blockchain integration are some of the key trends driving this growth. Smart toys provide an engaging and interactive way for children to learn STEM concepts, making them an essential tool for modern education.

Market Segmentation

The market research report provides comprehensive data (region-wise segment analysis), with forecasts and estimates in "USD million" for the period 2024-2028, as well as historical data from 2018-2022 for the following segments.
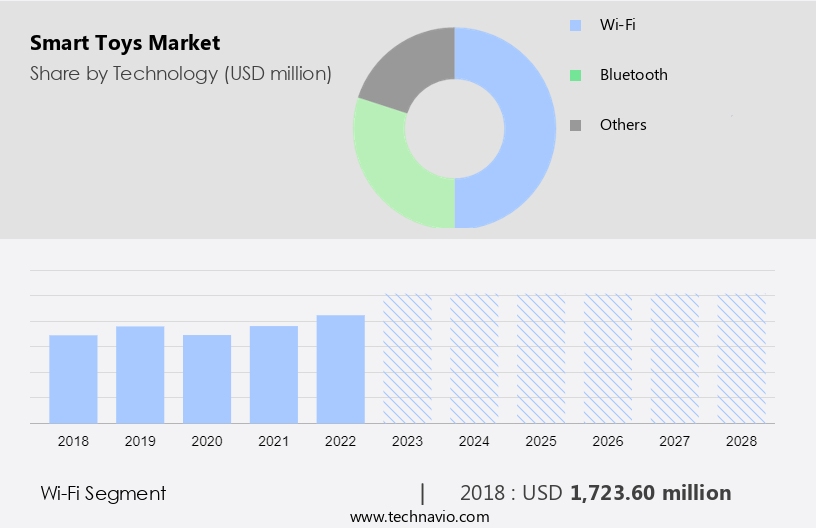
  • Technology
    • Wi-Fi
    • Bluetooth
    • Others
  • Distribution Channel
    • Offline
    • Online
  • Geography
    • North America
      • US
    • Europe
      • Germany
      • UK
    • APAC
      • China
      • Japan
    • Middle East and Africa
    • South America

By Technology Insights

The wi-fi segment is estimated to witness significant growth during the forecast period. In the realm of modern education and entertainment, the market for smart toys integrating Artificial Intelligence (AI) is experiencing substantial growth. These innovative toys, which incorporate elements of Science, Technology, Engineering, and Math (STEM), are designed to engage and educate children in a fun and interactive way. One notable example is SmartGurlz, a line of AI-driven dolls that teach coding and programming skills. Wi-Fi connectivity is a fundamental aspect of these smart toys, enabling high-speed data transmission within a confined area. Wi-Fi's extensive coverage and swift data transfer capabilities surpass those of Bluetooth and Near Field Communication (NFC), making it the preferred choice for smart toys.

However, this Internet connectivity poses potential privacy concerns. Once connected, smart toys collect and transmit data to manufacturers or developers, raising questions about data security and privacy. As the demand for AI-infused smart toys continues to escalate, it is essential for parents and educators to prioritize online safety and privacy. Implementing strong passwords, limiting data access, and regularly updating software are some effective measures to ensure the protection of personal information.  However, it is crucial to address privacy concerns and ensure the secure handling of collected data to maintain trust and confidence in these innovative products.

Smart Toys Market Size

Get a glance at the market share of various segments Request Free Sample

The Wi-Fi segment accounted for USD 1.72 billion in 2018 and showed a gradual increase during the forecast period.

Regional Insights

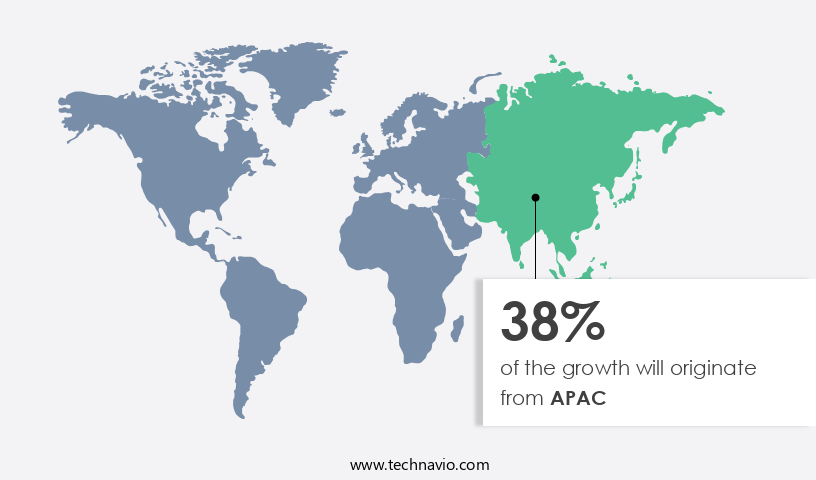
APAC is estimated to contribute 38% to the growth of the global market during the forecast period. Technavio's analysts have elaborately explained the regional trends and drivers that shape the market during the forecast period.

Smart Toys Market Share by Geography

For more insights on the market share of various regions Request Free Sample

In North America, the market is experiencing significant growth, with the United States and Canada being the primary contributors to the region's revenue. The region's affinity for modern technology and innovation drives a high demand for interactive and digitally enhanced toys. Major end-users of the market include individual purchasers such as parents and children, millennials, schools, and childcare facilities. companies in North America are expanding their businesses in the smart toys segment due to the region's early adoption of technology. Additionally, the region's high per capita income and standard of living enable consumers to afford new technology-driven gadgets, including smart toys and games. Further, connectivity and interactive features are key elements of smart toys, providing an educational experience for children and entertainment for all ages. As a result, the market for these toys is poised for continued expansion in North America.

Market Dynamics

Our researchers analyzed the data with 2023 as the base year, along with the key drivers, trends, and challenges. A holistic analysis of drivers will help companies refine their marketing strategies to gain a competitive advantage.

Market Driver

The adoption of STEM toys for children's skills enhancement is the key driver of the market. Smart toys equipped with Wi-Fi and Bluetooth capabilities are revolutionizing children's playtime experience. These interactive toys, powered by artificial intelligence and sensors, encourage critical thinking and creativity among kids. Parents and educators can utilize these toys to teach professional skills, such as coding and programming, fostering digital literacy. Schools and parents can leverage STEM toys to improve cognitive abilities and promote logic, collaboration, problem-solving, and creativity in students. By integrating technology into traditional play, smart toys offer a unique blend of education and entertainment.

Market Trends

The emergence of 3D printing is the upcoming trend in the market. The advent of 3D printing technology poses a significant challenge for manufacturers and licensors in the market. With this technology becoming increasingly accessible, consumers have the ability to create customized toys with their preferred characters and complex shapes. However, this also raises concerns regarding copyright and trademark infringements.

Hasbro is one such example, granting licenses to 3D printing companies to use specific assets and differentiate their products from other licensed merchandise in the market. The ITU highlights the importance of implementing effective intellectual property protection measures to safeguard the interests of manufacturers and license providers.

Market Challenge

The high availability of substitutes is a key challenge affecting the market growth. Smart toys, which offer digital engagement through interactive games and educational robots, are gaining traction among tech-savvy youngsters. However, their premium prices may deter price-conscious consumers, particularly in economies with limited purchasing power. In contrast, traditional toys and video games, which are more affordable alternatives, continue to thrive. The popularity of video games, fueled by advancements in technology and the rise of esports, is on the rise and is expected to persist during the forecast period. Smart toys, with features such as RFID and NFC, offer offline and online experiences, making them attractive to consumers seeking both convenience and education.

Exclusive Customer Landscape

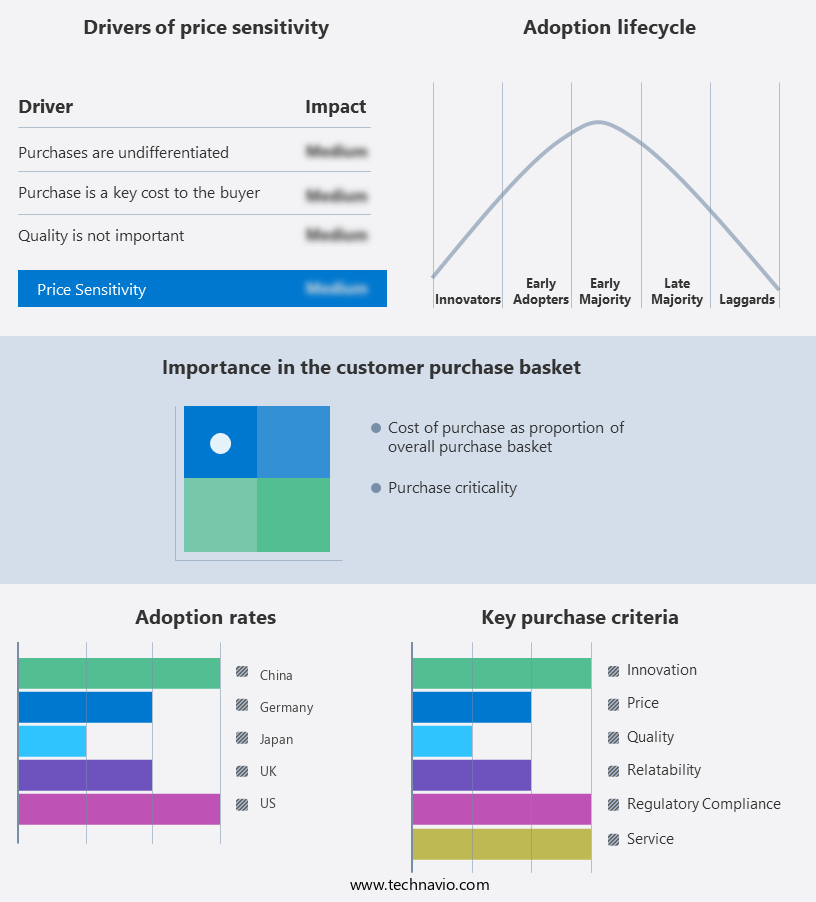
The market forecasting report includes the adoption lifecycle of the market, covering from the innovator's stage to the laggard's stage. It focuses on adoption rates in different regions based on penetration. Furthermore, the report also includes key purchase criteria and drivers of price sensitivity to help companies evaluate and develop their market growth analysis strategies.

Smart Toys Market Share by Geography

 Customer Landscape

Key Companies & Market Insights

Companies are implementing various strategies, such as strategic alliances, partnerships, mergers and acquisitions, geographical expansion, and product/service launches, to enhance their presence in the market.

Activision Blizzard Inc. - The company offers smart toys that includes diverse game categories, including action, adventure, action sports, racing, role playing, simulation, first-person action, music-based gaming, and strategy.

The market research and growth report includes detailed analyses of the competitive landscape of the market and information about key companies, including:

  • Digital Dream Labs
  • Genesis
  • geobra Brandstatter Stiftung and Co. KG
  • Hasbro Inc.
  • Innovation First International Inc.
  • LEGO System AS
  • Makeblock Co. Ltd.
  • Mattel Inc.
  • Ozo EDU Inc.
  • Primo Toys
  • RN Chidakashi Technologies Inc.
  • Silverlit Toys Manufactory Ltd.
  • Sony Group Corp.
  • Sphero Inc.
  • Spin Master Corp.
  • UBTECH Robotics Inc.
  • VTech Holdings Ltd.
  • WowWee Group Ltd.
  • ZURU Inc.

Qualitative and quantitative analysis of companies has been conducted to help clients understand the wider business environment as well as the strengths and weaknesses of key market players. Data is qualitatively analyzed to categorize companies as pure play, category-focused, industry-focused, and diversified; it is quantitatively analyzed to categorize companies as dominant, leading, strong, tentative, and weak.

Research Analyst Overview

The smart toys industry is experiencing significant growth due to the integration of artificial intelligence (AI) and the Internet of Things (IoT) in educational toys. These innovative products offer an interactive and engaging experience for children, blending traditional play with digital elements. STEM-based toys, which focus on science, technology, engineering, and math, are particularly popular. Education-based toys have become a favorite among parents, as they aim to promote digital literacy and enhance the learning experience for tech-savvy youngsters. Gamification, AI algorithms, and robotics are key features in these toys, providing cause-and-effect interactions and social media integration. Middle-class family populations are driving the demand for smart toys, with brands like Fisher-Price, Mattel Creations, and Hot Wheels leading the way.

Further, e-commerce portals, app stores, and platforms like Rarible and Velan Studios are making it easier for parents to purchase and download content for their children's smart toys. PlayStation 4 and PlayStation 5 are also entering the market with AI-powered toys, expanding the possibilities for interactive play. Offline and online experiences are merging in smart toys, with RFID and NFC technologies enabling seamless integration between physical and digital worlds. Parents appreciate the educational value of these toys, as they offer a balance between traditional play and digital engagement.

Market Scope

Report Coverage

Details

Page number

164

Base year

2023

Historic period

2018-2022

Forecast period

2024-2028

Growth momentum & CAGR

Accelerate at a CAGR of 17.61%

Market growth 2024-2028

USD 7.39 billion

Market structure

Fragmented

YoY growth 2023-2024(%)

13.4

Regional analysis

North America, Europe, APAC, Middle East and Africa, and South America

Performing market contribution

APAC at 38%

Key countries

US, China, Japan, UK, and Germany

Competitive landscape

Leading Companies, Market Positioning of Companies, Competitive Strategies, and Industry Risks

Key companies profiled

Activision Blizzard Inc., Digital Dream Labs, Genesis, geobra Brandstatter Stiftung and Co. KG, Hasbro Inc., Innovation First International Inc., LEGO System AS, Makeblock Co. Ltd., Mattel Inc., Ozo EDU Inc., Primo Toys, RN Chidakashi Technologies Inc., Silverlit Toys Manufactory Ltd., Sony Group Corp., Sphero Inc., Spin Master Corp., UBTECH Robotics Inc., VTech Holdings Ltd., WowWee Group Ltd., and ZURU Inc.

Market dynamics

Parent market analysis, market growth inducers and obstacles, market forecast, fast-growing and slow-growing segment analysis, COVID-19 impact and recovery analysis and future consumer dynamics, market condition analysis for the forecast period

Customization purview

If our market report has not included the data that you are looking for, you can reach out to our analysts and get segments customized.

Request Free Sample

What are the Key Data Covered in this Market Research and Growth Report?

  • CAGR of the market during the forecast period
  • Detailed information on factors that will drive the market growth and forecasting between 2024 and 2028
  • Precise estimation of the size of the market  and its contribution of the market in focus to the parent market
  • Accurate predictions about upcoming market growth and trends and changes in consumer behaviour
  • Growth of the market across North America, Europe, APAC, Middle East and Africa, and South America
  • Thorough analysis of the market's competitive landscape and detailed information about companies
  • Comprehensive analysis of factors that will challenge the growth of market companies

We can help! Our analysts can customize this market research report to meet your requirements. Get in touch

1 Executive Summary

  • 1.1 Market overview
    • Executive Summary - Chart on Market Overview
    • Executive Summary - Data Table on Market Overview
    • Executive Summary - Chart on Global Market Characteristics
    • Executive Summary - Chart on Market by Geography
    • Executive Summary - Chart on Market Segmentation by Technology
    • Executive Summary - Chart on Market Segmentation by Distribution Channel
    • Executive Summary - Chart on Incremental Growth
    • Executive Summary - Data Table on Incremental Growth
    • Executive Summary - Chart on Company Market Positioning

2 Market Landscape

  • 2.1 Market ecosystem
    • Parent Market
    • Data Table on - Parent Market
  • 2.2 Market characteristics
    • Market characteristics analysis
  • 2.3 Value chain analysis
    • Value Chain Analysis

3 Market Sizing

  • 3.1 Market definition
    • Offerings of companies included in the market definition
  • 3.2 Market segment analysis
    • Market segments
  • 3.3 Market size 2023
    • 3.4 Market outlook: Forecast for 2023-2028
      • Chart on Global - Market size and forecast 2023-2028 ($ million)
      • Data Table on Global - Market size and forecast 2023-2028 ($ million)
      • Chart on Global Market: Year-over-year growth 2023-2028 (%)
      • Data Table on Global Market: Year-over-year growth 2023-2028 (%)

    4 Historic Market Size

    • 4.1 Global Smart Toys Market 2018 - 2022
      • Historic Market Size - Data Table on Global Smart Toys Market 2018 - 2022 ($ million)
    • 4.2 Technology segment analysis 2018 - 2022
      • Historic Market Size - Technology Segment 2018 - 2022 ($ million)
    • 4.3 Distribution Channel segment analysis 2018 - 2022
      • Historic Market Size - Distribution Channel Segment 2018 - 2022 ($ million)
    • 4.4 Geography segment analysis 2018 - 2022
      • Historic Market Size - Geography Segment 2018 - 2022 ($ million)
    • 4.5 Country segment analysis 2018 - 2022
      • Historic Market Size - Country Segment 2018 - 2022 ($ million)

    5 Five Forces Analysis

    • 5.1 Five forces summary
      • Five forces analysis - Comparison between 2023 and 2028
    • 5.2 Bargaining power of buyers
      • Bargaining power of buyers - Impact of key factors 2023 and 2028
    • 5.3 Bargaining power of suppliers
      • Bargaining power of suppliers - Impact of key factors in 2023 and 2028
    • 5.4 Threat of new entrants
      • Threat of new entrants - Impact of key factors in 2023 and 2028
    • 5.5 Threat of substitutes
      • Threat of substitutes - Impact of key factors in 2023 and 2028
    • 5.6 Threat of rivalry
      • Threat of rivalry - Impact of key factors in 2023 and 2028
    • 5.7 Market condition
      • Chart on Market condition - Five forces 2023 and 2028

    6 Market Segmentation by Technology

    • 6.1 Market segments
      • Chart on Technology - Market share 2023-2028 (%)
      • Data Table on Technology - Market share 2023-2028 (%)
    • 6.2 Comparison by Technology
      • Chart on Comparison by Technology
      • Data Table on Comparison by Technology
    • 6.3 Wi-Fi - Market size and forecast 2023-2028
      • Chart on Wi-Fi - Market size and forecast 2023-2028 ($ million)
      • Data Table on Wi-Fi - Market size and forecast 2023-2028 ($ million)
      • Chart on Wi-Fi - Year-over-year growth 2023-2028 (%)
      • Data Table on Wi-Fi - Year-over-year growth 2023-2028 (%)
    • 6.4 Bluetooth - Market size and forecast 2023-2028
      • Chart on Bluetooth - Market size and forecast 2023-2028 ($ million)
      • Data Table on Bluetooth - Market size and forecast 2023-2028 ($ million)
      • Chart on Bluetooth - Year-over-year growth 2023-2028 (%)
      • Data Table on Bluetooth - Year-over-year growth 2023-2028 (%)
    • 6.5 Others - Market size and forecast 2023-2028
      • Chart on Others - Market size and forecast 2023-2028 ($ million)
      • Data Table on Others - Market size and forecast 2023-2028 ($ million)
      • Chart on Others - Year-over-year growth 2023-2028 (%)
      • Data Table on Others - Year-over-year growth 2023-2028 (%)
    • 6.6 Market opportunity by Technology
      • Market opportunity by Technology ($ million)
      • Data Table on Market opportunity by Technology ($ million)

    7 Market Segmentation by Distribution Channel

    • 7.1 Market segments
      • Chart on Distribution Channel - Market share 2023-2028 (%)
      • Data Table on Distribution Channel - Market share 2023-2028 (%)
    • 7.2 Comparison by Distribution Channel
      • Chart on Comparison by Distribution Channel
      • Data Table on Comparison by Distribution Channel
    • 7.3 Offline - Market size and forecast 2023-2028
      • Chart on Offline - Market size and forecast 2023-2028 ($ million)
      • Data Table on Offline - Market size and forecast 2023-2028 ($ million)
      • Chart on Offline - Year-over-year growth 2023-2028 (%)
      • Data Table on Offline - Year-over-year growth 2023-2028 (%)
    • 7.4 Online - Market size and forecast 2023-2028
      • Chart on Online - Market size and forecast 2023-2028 ($ million)
      • Data Table on Online - Market size and forecast 2023-2028 ($ million)
      • Chart on Online - Year-over-year growth 2023-2028 (%)
      • Data Table on Online - Year-over-year growth 2023-2028 (%)
    • 7.5 Market opportunity by Distribution Channel
      • Market opportunity by Distribution Channel ($ million)
      • Data Table on Market opportunity by Distribution Channel ($ million)

    8 Customer Landscape

    • 8.1 Customer landscape overview
      • Analysis of price sensitivity, lifecycle, customer purchase basket, adoption rates, and purchase criteria

    9 Geographic Landscape

    • 9.1 Geographic segmentation
      • Chart on Market share by geography 2023-2028 (%)
      • Data Table on Market share by geography 2023-2028 (%)
    • 9.2 Geographic comparison
      • Chart on Geographic comparison
      • Data Table on Geographic comparison
    • 9.3 North America - Market size and forecast 2023-2028
      • Chart on North America - Market size and forecast 2023-2028 ($ million)
      • Data Table on North America - Market size and forecast 2023-2028 ($ million)
      • Chart on North America - Year-over-year growth 2023-2028 (%)
      • Data Table on North America - Year-over-year growth 2023-2028 (%)
    • 9.4 Europe - Market size and forecast 2023-2028
      • Chart on Europe - Market size and forecast 2023-2028 ($ million)
      • Data Table on Europe - Market size and forecast 2023-2028 ($ million)
      • Chart on Europe - Year-over-year growth 2023-2028 (%)
      • Data Table on Europe - Year-over-year growth 2023-2028 (%)
    • 9.5 APAC - Market size and forecast 2023-2028
      • Chart on APAC - Market size and forecast 2023-2028 ($ million)
      • Data Table on APAC - Market size and forecast 2023-2028 ($ million)
      • Chart on APAC - Year-over-year growth 2023-2028 (%)
      • Data Table on APAC - Year-over-year growth 2023-2028 (%)
    • 9.6 Middle East and Africa - Market size and forecast 2023-2028
      • Chart on Middle East and Africa - Market size and forecast 2023-2028 ($ million)
      • Data Table on Middle East and Africa - Market size and forecast 2023-2028 ($ million)
      • Chart on Middle East and Africa - Year-over-year growth 2023-2028 (%)
      • Data Table on Middle East and Africa - Year-over-year growth 2023-2028 (%)
    • 9.7 South America - Market size and forecast 2023-2028
      • Chart on South America - Market size and forecast 2023-2028 ($ million)
      • Data Table on South America - Market size and forecast 2023-2028 ($ million)
      • Chart on South America - Year-over-year growth 2023-2028 (%)
      • Data Table on South America - Year-over-year growth 2023-2028 (%)
    • 9.8 US - Market size and forecast 2023-2028
      • Chart on US - Market size and forecast 2023-2028 ($ million)
      • Data Table on US - Market size and forecast 2023-2028 ($ million)
      • Chart on US - Year-over-year growth 2023-2028 (%)
      • Data Table on US - Year-over-year growth 2023-2028 (%)
    • 9.9 China - Market size and forecast 2023-2028
      • Chart on China - Market size and forecast 2023-2028 ($ million)
      • Data Table on China - Market size and forecast 2023-2028 ($ million)
      • Chart on China - Year-over-year growth 2023-2028 (%)
      • Data Table on China - Year-over-year growth 2023-2028 (%)
    • 9.10 Japan - Market size and forecast 2023-2028
      • Chart on Japan - Market size and forecast 2023-2028 ($ million)
      • Data Table on Japan - Market size and forecast 2023-2028 ($ million)
      • Chart on Japan - Year-over-year growth 2023-2028 (%)
      • Data Table on Japan - Year-over-year growth 2023-2028 (%)
    • 9.11 UK - Market size and forecast 2023-2028
      • Chart on UK - Market size and forecast 2023-2028 ($ million)
      • Data Table on UK - Market size and forecast 2023-2028 ($ million)
      • Chart on UK - Year-over-year growth 2023-2028 (%)
      • Data Table on UK - Year-over-year growth 2023-2028 (%)
    • 9.12 Germany - Market size and forecast 2023-2028
      • Chart on Germany - Market size and forecast 2023-2028 ($ million)
      • Data Table on Germany - Market size and forecast 2023-2028 ($ million)
      • Chart on Germany - Year-over-year growth 2023-2028 (%)
      • Data Table on Germany - Year-over-year growth 2023-2028 (%)
    • 9.13 Market opportunity by geography
      • Market opportunity by geography ($ million)
      • Data Tables on Market opportunity by geography ($ million)

    10 Drivers, Challenges, and Opportunity/Restraints

    • 10.1 Market drivers
      • 10.2 Market challenges
        • 10.3 Impact of drivers and challenges
          • Impact of drivers and challenges in 2023 and 2028
        • 10.4 Market opportunities/restraints

          11 Competitive Landscape

          • 11.1 Overview
            • 11.2 Competitive Landscape
              • Overview on criticality of inputs and factors of differentiation
            • 11.3 Landscape disruption
              • Overview on factors of disruption
            • 11.4 Industry risks
              • Impact of key risks on business

            12 Competitive Analysis

            • 12.1 Companies profiled
              • Companies covered
            • 12.2 Market positioning of companies
              • Matrix on companies position and classification
            • 12.3 Activision Blizzard Inc.
              • Activision Blizzard Inc. - Overview
              • Activision Blizzard Inc. - Business segments
              • Activision Blizzard Inc. - Key news
              • Activision Blizzard Inc. - Key offerings
              • Activision Blizzard Inc. - Segment focus
            • 12.4 Hasbro Inc.
              • Hasbro Inc. - Overview
              • Hasbro Inc. - Business segments
              • Hasbro Inc. - Key offerings
              • Hasbro Inc. - Segment focus
            • 12.5 LEGO System AS
              • LEGO System AS - Overview
              • LEGO System AS - Product / Service
              • LEGO System AS - Key news
              • LEGO System AS - Key offerings
            • 12.6 Makeblock Co. Ltd.
              • Makeblock Co. Ltd. - Overview
              • Makeblock Co. Ltd. - Product / Service
              • Makeblock Co. Ltd. - Key offerings
            • 12.7 Mattel Inc.
              • Mattel Inc. - Overview
              • Mattel Inc. - Business segments
              • Mattel Inc. - Key news
              • Mattel Inc. - Key offerings
              • Mattel Inc. - Segment focus
            • 12.8 Silverlit Toys Manufactory Ltd.
              • Silverlit Toys Manufactory Ltd. - Overview
              • Silverlit Toys Manufactory Ltd. - Product / Service
              • Silverlit Toys Manufactory Ltd. - Key offerings
            • 12.9 Sony Group Corp.
              • Sony Group Corp. - Overview
              • Sony Group Corp. - Business segments
              • Sony Group Corp. - Key news
              • Sony Group Corp. - Key offerings
              • Sony Group Corp. - Segment focus
            • 12.10 Spin Master Corp.
              • Spin Master Corp. - Overview
              • Spin Master Corp. - Business segments
              • Spin Master Corp. - Key offerings
              • Spin Master Corp. - Segment focus
            • 12.11 UBTECH Robotics Inc.
              • UBTECH Robotics Inc. - Overview
              • UBTECH Robotics Inc. - Product / Service
              • UBTECH Robotics Inc. - Key news
              • UBTECH Robotics Inc. - Key offerings
            • 12.12 VTech Holdings Ltd.
              • VTech Holdings Ltd. - Overview
              • VTech Holdings Ltd. - Business segments
              • VTech Holdings Ltd. - Key news
              • VTech Holdings Ltd. - Key offerings
              • VTech Holdings Ltd. - Segment focus

            13 Appendix

            • 13.1 Scope of the report
              • 13.2 Inclusions and exclusions checklist
                • Inclusions checklist
                • Exclusions checklist
              • 13.3 Currency conversion rates for US$
                • Currency conversion rates for US$
              • 13.4 Research methodology
                • Research methodology
              • 13.5 Data procurement
                • Information sources
              • 13.6 Data validation
                • Data validation
              • 13.7 Validation techniques employed for market sizing
                • Validation techniques employed for market sizing
              • 13.8 Data synthesis
                • Data synthesis
              • 13.9 360 degree market analysis
                • 360 degree market analysis
              • 13.10 List of abbreviations
                • List of abbreviations

              Research Methodology

              Technavio presents a detailed picture of the market by way of study, synthesis, and summation of data from multiple sources. The analysts have presented the various facets of the market with a particular focus on identifying the key industry influencers. The data thus presented is comprehensive, reliable, and the result of extensive research, both primary and secondary.

              INFORMATION SOURCES

              Primary sources

              • Manufacturers and suppliers
              • Channel partners
              • Industry experts
              • Strategic decision makers

              Secondary sources

              • Industry journals and periodicals
              • Government data
              • Financial reports of key industry players
              • Historical data
              • Press releases

              DATA ANALYSIS

              Data Synthesis

              • Collation of data
              • Estimation of key figures
              • Analysis of derived insights

              Data Validation

              • Triangulation with data models
              • Reference against proprietary databases
              • Corroboration with industry experts

              REPORT WRITING

              Qualitative

              • Market drivers
              • Market challenges
              • Market trends
              • Five forces analysis

              Quantitative

              • Market size and forecast
              • Market segmentation
              • Geographical insights
              • Competitive landscape

              Interested in this report?

              Get your sample now to see our research methodology and insights!

              Download Now

              Frequently Asked Questions

              Smart Toys market growth will increase by $ 7392.3 mn during 2024-2028 .

              The Smart Toys market is expected to grow at a CAGR of 17.61% during 2024-2028 .

              Smart Toys market is segmented by Technology( Wi-Fi, Bluetooth, Others) Distribution Channel( Offline, Online)

              Activision Blizzard Inc., Digital Dream Labs, Genesis, geobra Brandstatter Stiftung and Co. KG, Hasbro Inc., Innovation First International Inc., LEGO System AS, Makeblock Co. Ltd., Mattel Inc., Ozo EDU Inc., Primo Toys, RN Chidakashi Technologies Inc., Silverlit Toys Manufactory Ltd., Sony Group Corp., Sphero Inc., Spin Master Corp., UBTECH Robotics Inc., VTech Holdings Ltd., WowWee Group Ltd., ZURU Inc. are a few of the key vendors in the Smart Toys market.

              APAC will register the highest growth rate of 38% among the other regions. Therefore, the Smart Toys market in APAC is expected to garner significant business opportunities for the vendors during the forecast period.

              US, China, Japan, UK, Germany

              • Adoption of STEM toys for children's skills enhancementSmart toys allow children to think critically and creatively about technology is the driving factor this market.
              • thereby developing their analytical skills. With smart interaction and behavioral learning is the driving factor this market.
              • these toys are expected to play an important role in developing professional skills among children is the driving factor this market.
              • such as coding is the driving factor this market.
              • programming is the driving factor this market.
              • and even engineering. For instance is the driving factor this market.
              • Mattel provides Barbie Robotics Engineer is the driving factor this market.
              • which has six free coding lessons for kids. Smart toys can be programmed and controlled by parents and children. Vendors is the driving factor this market.
              • schools is the driving factor this market.
              • and parents can provide experiential is the driving factor this market.
              • hands-on learning to students using STEM toys. STEM toys can be used to enhance the cognitive skills of students and can also be used to promote logic is the driving factor this market.
              • collaboration is the driving factor this market.
              • problem-solving is the driving factor this market.
              • and creative skills among students. Parents are increasingly opting for smart construction kits is the driving factor this market.
              • as they enhance the imagination and the motor skill of individuals. In addition is the driving factor this market.
              • the demand for modular kits that correspond to various STEM subjects is increasing in the market. STEM toys are increasingly being adopted in the age groups of 4-8 years and 8 years and above.  In the future is the driving factor this market.
              • jobs in STEM disciplines are expected to experience a sharp increase. Hence is the driving factor this market.
              • an increasing number of parents are focusing on equipping kids with smart toys and making them future-ready. Compared with traditional toys and games is the driving factor this market.
              • smart toys are estimated to experience high sales. This is because more parents seek products that can aid the intellectual development of their children. This is expected to be a prominent factor driving the market during the forecast period.   is the driving factor this market.

              The Smart Toys market vendors should focus on grabbing business opportunities from the Wi-Fi segment as it accounted for the largest market share in the base year.