Smart Connected Clothing Market Analysis North America, Europe, APAC, South America, Middle East and Africa - China, Japan, India, France, South Korea, Germany, UK, Italy, US, Canada - Size and Forecast 2024-2028

Smart Connected Clothing Market Analysis North America, Europe, APAC, South America, Middle East and Africa - China, Japan, India, France, South Korea, Germany, UK, Italy, US, Canada - Size and Forecast 2024-2028

Published: Nov 2024 184 Pages SKU: IRTNTR72634

Market Overview at a Glance

$6.56 B
Market Opportunity
26.1%
CAGR
20.3
YoY growth 2023-2024(%)

Smart Connected Clothing Market Size 2024-2028

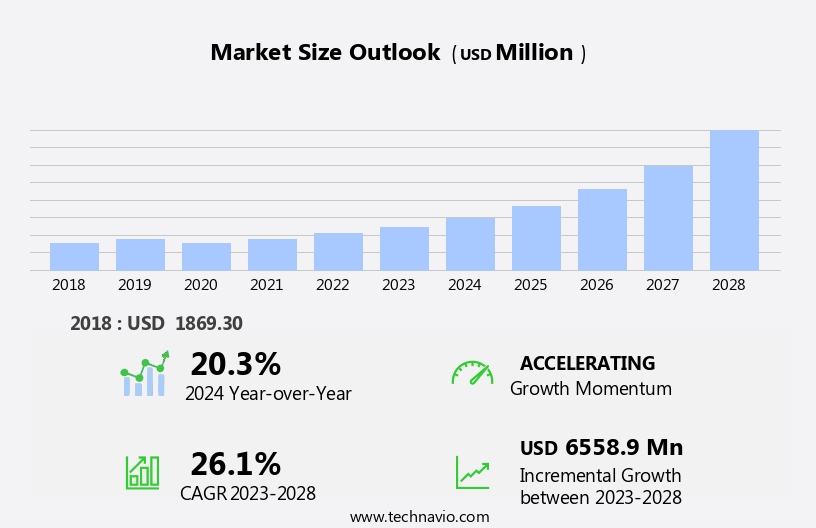
The smart connected clothing market size is forecast to increase by USD 6.56 billion at a CAGR of 26.1% between 2023 and 2028.

  • The market is experiencing significant growth driven by technology innovation and product premiumization. Advanced technologies such as wearable sensors, Bluetooth connectivity, and energy harvesting are enabling the development of intelligent garments that offer enhanced functionality and convenience. These garments can monitor vital signs, track workouts, and even provide weather alerts, making them an attractive proposition for consumers. Moreover, growing product promotion through digital marketing and social media channels is expanding the market reach and increasing consumer awareness. Brands are leveraging influencer marketing and targeted social media campaigns to showcase the benefits of smart clothing and build a loyal customer base.
  • However, the market is not without challenges. The availability of alternative smart devices, such as smartwatches and fitness bands, is intensifying competition and putting pressure on pricing. To succeed in this dynamic market, companies need to focus on differentiating their offerings through unique features, superior design, and effective marketing strategies. By staying abreast of the latest trends and consumer preferences, companies can capitalize on the growing demand for smart clothing and navigate the challenges effectively.

What will be the Size of the Smart Connected Clothing Market during the forecast period?

Smart Connected Clothing Market Size

 Request Free Sample

  • The smart clothing industry is experiencing significant growth as wearable sensor technology advances and merges with mobile health and fitness coaching solutions. Smart clothing integrates fitness tracking apps, biometric monitoring, and IoT integration to offer personalized fitness plans, remote health monitoring, and lifestyle management. The future of fashion lies in the fusion of comfort and style with performance optimization, body mapping, and temperature control. Athletes and fitness enthusiasts benefit from smart clothing's athletic performance optimization, sleep tracking, and productivity enhancement. Innovations in sports science, such as smart fabric, fitness data insights, and body data, enable real-time performance analysis and adjustments.
  • Data security is a crucial consideration, ensuring that sensitive health information remains confidential. Smartwatch connectivity and fitness tracker integration expand the market's reach, offering convenience and accessibility to users. Environmental monitoring, exercise tracking, and fitness data visualization further enhance the user experience. The smart clothing industry continues to evolve, with wearable computing, sensor technology, and wearable design shaping the future of health and wellness.

How is this Smart Connected Clothing Industry segmented?

The smart connected clothing industry research report provides comprehensive data (region-wise segment analysis), with forecasts and estimates in "USD million" for the period 2024-2028, as well as historical data from 2018-2022 for the following segments.

  • Distribution Channel
    • Offline
    • Online
  • End-user
    • Men
    • Women
    • Children
  • Geography
    • North America
      • Europe
        • France
      • APAC
        • China
        • India
        • Japan
      • South America
        • Middle East and Africa

        By Distribution Channel Insights

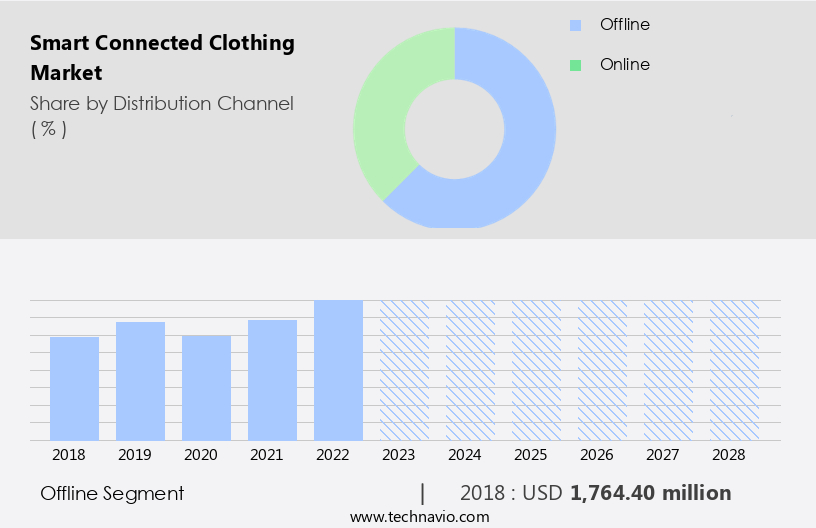
        The offline segment is estimated to witness significant growth during the forecast period.

        The market is expanding its reach through various distribution channels to engage consumers. Direct distribution, with manufacturers selling directly to consumers via e-commerce platforms and brand-owned retail stores, offers greater control over branding and customer experience. Indirect distribution, including wholesalers and retailers, broadens market access. Retailers, such as specialized boutiques and large chain stores, provide consumers with the opportunity to physically interact with smart connected clothing before purchase, facilitating sales. Textile technology, integrated into tank tops, shorts, jackets, and other apparel, enhances personal well-being by tracking fitness metrics, muscle activity, heart rate, sleep quality, and more. User-friendliness, seamless integration with smartwatches and mobile apps, and haptic feedback ensure convenience and comfort.

        Energy harvesting, microcontrollers, and AI enable real-time health monitoring, injury risk assessment, and performance enhancement. Smart clothing, including passive options, caters to athletes, fitness enthusiasts, and workers, promoting a healthy lifestyle and continuous health monitoring. The market's evolution reflects a proactive approach to personalized insights, form, and activity levels, making wearable technology an integral part of daily life.

        Smart Connected Clothing Market Size

        Get a glance at the market report of share of various segments Request Free Sample

        The Offline segment was valued at USD 1.76 billion in 2018 and showed a gradual increase during the forecast period.

        Regional Analysis

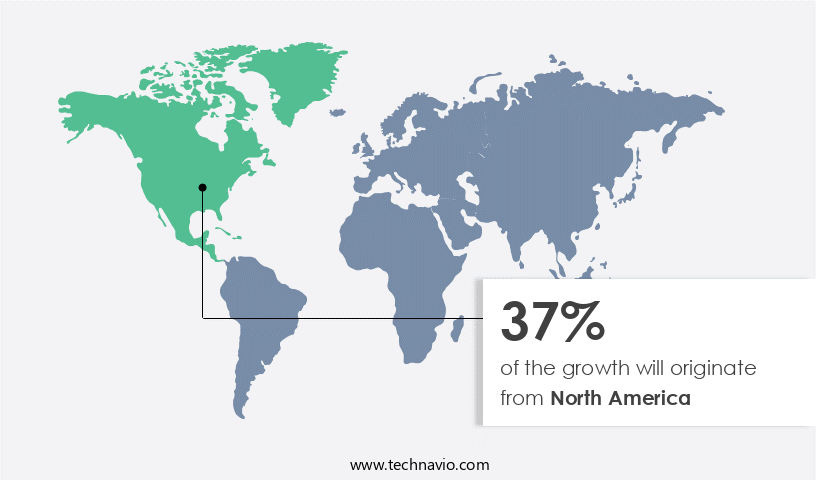
        North America is estimated to contribute 37% to the growth of the global market during the forecast period.Technavio’s analysts have elaborately explained the regional trends and drivers that shape the market during the forecast period.

        Smart Connected Clothing Market Share by Geography

        For more insights on the market size of various regions, Request Free Sample

        The market is witnessing significant growth due to the integration of textile technology into everyday apparel. This innovation caters to personal well-being and fitness enthusiasts by offering real-time data on health metrics such as heart rate, muscle activity, and sleep quality through embedded sensors. The seamless integration of microcontrollers and energy harvesting technology enables fitness tracking and posture monitoring, enhancing performance and promoting a healthy lifestyle. The market is not limited to sports & fitness; it extends to daily life, with smart clothing offering convenience and continuous health monitoring. Wearable devices like smartwatches and fitness trackers have paved the way for the acceptance of smart apparel, providing personalized insights and injury risk alerts.

        The user-friendliness of these garments, including comfort and haptic feedback, has gained popularity among consumers. From a business perspective, the market's growth is driven by the efficient supply chain management, good Internet connectivity infrastructure, and the increasing number of market companies. The demand side is fueled by higher Internet penetration, the widespread adoption of smartphones and other Internet-enabled devices, and the end-user preference for smart clothing. The emergence of passive smart clothing and the integration of AI and machine learning algorithms are expected to further boost the market's growth. Smart clothing, including tank tops, shorts, shirts, jackets, and innerwear, offers form-fitting designs and improved battery performance, making it an essential part of the fitness ecosystem.

        The market's expansion is expected to bring about increased competition, with market participants focusing on functionality, lifestyle management, and health goals to attract consumers. The integration of wearable technology into clothing is revolutionizing the way we approach fitness, injury prevention, and overall well-being.

        Market Dynamics

        Our researchers analyzed the data with 2023 as the base year, along with the key drivers, trends, and challenges. A holistic analysis of drivers will help companies refine their marketing strategies to gain a competitive advantage.

        What are the key market drivers leading to the rise in the adoption of Smart Connected Clothing Industry?

        • Technology innovation leading to product premiumization is the key driver of the market. 

        • The market is fueled by technological innovations, particularly in the realm of connectivity technologies. Over the past decade, groundbreaking advancements have emerged, revolutionizing the industry. Notable technologies driving this transformation include wireless technology, Bluetooth motion sensors, thermal sensors, infrared (IR) technology, near frequency communication (NFC), pulse oximetry technology, and electrocardiogram (ECG) technology. These foundational technologies are integrated into various clothing items such as skirts, shirts, jeans, and accessories, giving rise to the concept of smart connected clothing.
        • companies in this market are keen on incorporating the latest features into their smart clothing through connectivity technologies. This strategy allows them to command a premium price for their products, resulting in substantial profit margins.

        What are the market trends shaping the Smart Connected Clothing Industry?

        • Growing product promotion through digital marketing and social media is the upcoming market trend. 

        • The market has experienced significant shifts in marketing strategies due to advancements in Internet technology and digital applications. Traditional marketing methods, such as print media and radio communication, have been overshadowed by digital marketing campaigns and promotional activities. Leading digital platforms, including YouTube, Facebook, LinkedIn, Instagram, and Pinterest, have become essential tools for product marketing and customer engagement. Social media's ability to reach a vast and diverse audience has made it a preferred platform for companies in the market.
        • Key players in the global smart connected clothing industry maintain a strong digital and social media presence to connect with consumers and promote their offerings effectively.

        What challenges does the Smart Connected Clothing Industry face during its growth?

        • Availability of alternative smart devices is a key challenge affecting the industry growth. 

        • The market faces a significant challenge from the availability of affordable alternative devices such as fitness bands and smartwatches. The price disparity between these devices and a single piece of smart clothing is substantial. Leading companies in the smartwatch industry, including Apple and Samsung, promote their products as more cost-effective than smart apparel. Additionally, companies like Garmin and Fitbit offer numerous features in their smart devices, making them a more attractive option for consumers.
        • Consequently, the affordability of these alternatives discourages potential buyers from investing in expensive smart clothing. As a result, The market encounters a stiff price competition from these devices.

        Exclusive Customer Landscape

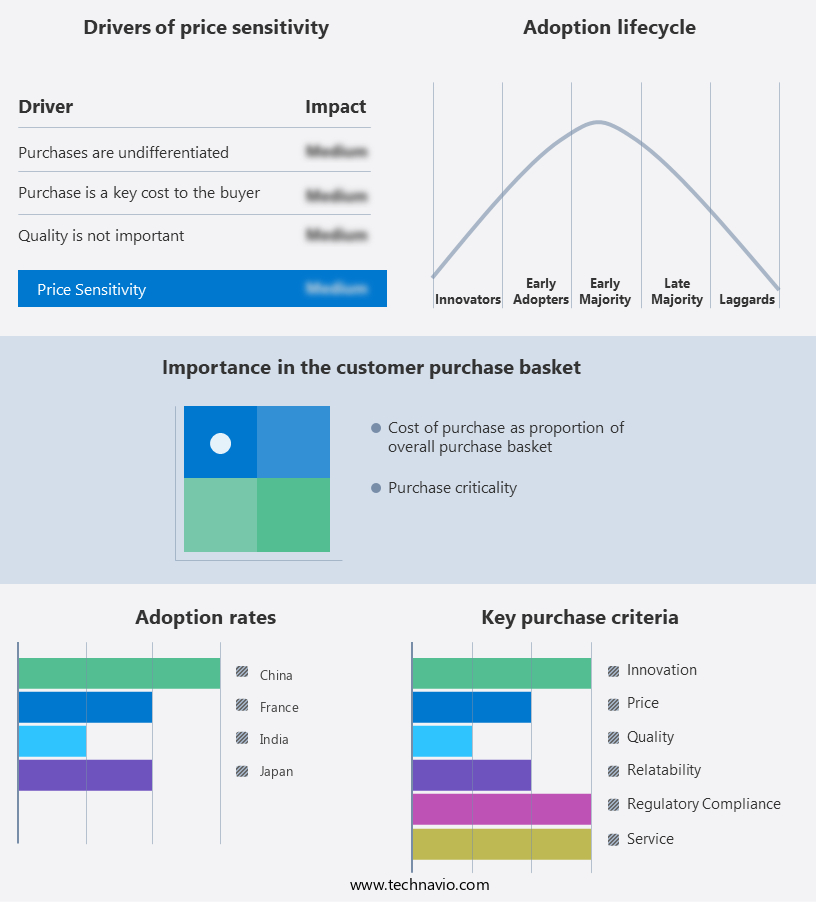
        The smart connected clothing market forecasting report includes the adoption lifecycle of the market, covering from the innovator’s stage to the laggard’s stage. It focuses on adoption rates in different regions based on penetration. Furthermore, the smart connected clothing market report also includes key purchase criteria and drivers of price sensitivity to help companies evaluate and develop their market growth analysis strategies.

        Smart Connected Clothing Market Share by Geography

         Customer Landscape

        Key Companies & Market Insights

        Companies are implementing various strategies, such as strategic alliances, smart connected clothing market forecast, partnerships, mergers and acquisitions, geographical expansion, and product/service launches, to enhance their presence in the industry.

        AiQ Smart Clothing Inc. - This company specializes in advanced, interconnected apparel, including the Base Upper Body Garment solution, Bioman Plus. Bioman Plus is a versatile foundation for an expansive array of intelligent clothing innovations. By seamlessly integrating technology into fabric, this base garment enhances functionality and comfort for various applications.

        The industry research and growth report includes detailed analyses of the competitive landscape of the market and information about key companies, including:

        • AiQ Smart Clothing Inc.
        • Athos
        • DuPont de Nemours Inc.
        • Hexoskin
        • Interactive Wear AG
        • Kolon Industries Inc.
        • Myontec Oy
        • Myzone Group
        • Noble Biomaterials Inc.
        • Ohmatex AS
        • OTEX Specialty Narrow Fabrics
        • Outlast Technologies GmbH
        • Owlet Inc.
        • Schoeller Textil AG
        • Sensoria Inc.
        • Toyobo Co. Ltd.
        • Vista Medical Ltd.
        • Vulpes Electronics GmbH
        • Wearable X

        Qualitative and quantitative analysis of companies has been conducted to help clients understand the wider business environment as well as the strengths and weaknesses of key industry players. Data is qualitatively analyzed to categorize companies as pure play, category-focused, industry-focused, and diversified; it is quantitatively analyzed to categorize companies as dominant, leading, strong, tentative, and weak.

        Research Analyst Overview

        The market is experiencing significant growth as textile technology advances and consumers seek innovative ways to enhance their personal well-being. This market encompasses a wide range of products, from tank tops embedded with sensors to jackets and innerwear, all designed to provide users with personalized insights into their physical activity, biometric data, and overall health. The sports and fitness sector has been a major driver of this market, with athletes and fitness enthusiasts embracing the benefits of smart apparel. These garments offer real-time data on fitness metrics such as heart rate, oxygen saturation, and activity levels, enabling users to optimize their workout routines and improve their performance.

        The integration of sensors, microcontrollers, and connectivity technologies into clothing has led to the development of seamless, user-friendly smart wear. These garments offer haptic feedback, comfort, and convenience, making them an attractive option for individuals looking to incorporate technology into their daily life. The fitness ecosystem is also evolving, with smartwatches and fitness trackers increasingly being integrated with smart clothing. This integration offers continuous health monitoring, allowing users to take a proactive approach to their health and well-being. Energy harvesting technologies are also gaining traction in the smart clothing market, enabling these garments to operate independently of external power sources.

        This feature is particularly important for worker safety, as it ensures that safety sensors and other critical functions remain operational even in remote locations. The use of electronic textiles and biometric data in smart clothing offers significant potential for performance enhancement and injury risk reduction. For example, muscle stretch sensors can help athletes optimize their form during workouts, while real-time health monitoring can alert users to potential injuries before they become serious. The integration of AI and machine learning algorithms into smart clothing is also a key trend, enabling these garments to provide personalized insights and recommendations based on individual user data.

        This feature is particularly appealing to fitness enthusiasts, who can use the data to optimize their training regimens and achieve their health goals. The market for smart clothing is expected to continue growing, driven by advancements in textile technology and the increasing demand for wearable devices that offer convenience, functionality, and real-time data. As this market evolves, it is likely that we will see further innovations in areas such as battery performance, user-friendliness, and seamless integration with mobile apps and other wearable technologies. In summary, the smart clothing market is experiencing significant growth as consumers seek innovative ways to enhance their personal well-being and optimize their fitness routines.

        The integration of sensors, connectivity technologies, and AI into clothing is driving the development of user-friendly, convenient, and functional smart wear that offers real-time data and personalized insights. The market is expected to continue growing, driven by advancements in textile technology and the increasing demand for wearable devices that offer performance enhancement, injury risk reduction, and convenience.

        Market Scope

        Report Coverage

        Details

        Page number

        184

        Base year

        2023

        Historic period

        2018-2022

        Forecast period

        2024-2028

        Growth momentum & CAGR

        Accelerate at a CAGR of 26.1%

        Market growth 2024-2028

        USD 6558.9 million

        Market structure

        Fragmented

        YoY growth 2023-2024(%)

        20.3

        Key countries

        China, Japan, India, and France

        Competitive landscape

        Leading Companies, Market Positioning of Companies, Competitive Strategies, and Industry Risks

        Request Free Sample

        What are the Key Data Covered in this Smart Connected Clothing Market Research and Growth Report?

        • CAGR of the Smart Connected Clothing industry during the forecast period
        • Detailed information on factors that will drive the growth and forecasting between 2024 and 2028
        • Precise estimation of the size of the market and its contribution of the industry in focus to the parent market
        • Accurate predictions about upcoming growth and trends and changes in consumer behaviour
        • Growth of the market across North America, Europe, APAC, South America, and Middle East and Africa
        • Thorough analysis of the market’s competitive landscape and detailed information about companies
        • Comprehensive analysis of factors that will challenge the smart connected clothing market growth of industry companies

        We can help! Our analysts can customize this smart connected clothing market research report to meet your requirements.

        Get in touch


        1 Executive Summary

        • 1.1 Market overview
          • Executive Summary - Chart on Market Overview
          • Executive Summary - Data Table on Market Overview
          • Executive Summary - Chart on Global Market Characteristics
          • Executive Summary - Chart on Market by Geography
          • Executive Summary - Chart on Market Segmentation by Distribution Channel
          • Executive Summary - Chart on Market Segmentation by End-user
          • Executive Summary - Chart on Incremental Growth
          • Executive Summary - Data Table on Incremental Growth
          • Executive Summary - Chart on Company Market Positioning

        2 Technavio Analysis

        • 2.1 Analysis of price sensitivity, lifecycle, customer purchase basket, adoption rates, and purchase criteria
          • Analysis of price sensitivity, lifecycle, customer purchase basket, adoption rates, and purchase criteria
        • 2.2 Criticality of inputs and Factors of differentiation
          • Overview on criticality of inputs and factors of differentiation
        • 2.3 Factors of disruption
          • Overview on factors of disruption
        • 2.4 Impact of drivers and challenges
          • Impact of drivers and challenges in 2023 and 2028

        3 Market Landscape

        • 3.1 Market ecosystem
          • Parent Market
          • Data Table on - Parent Market
        • 3.2 Market characteristics
          • Market characteristics analysis
        • 3.3 Value chain analysis
          • Value Chain Analysis

        4 Market Sizing

        • 4.1 Market definition
          • Offerings of companies included in the market definition
        • 4.2 Market segment analysis
          • Market segments
        • 4.3 Market size 2023
          • 4.4 Market outlook: Forecast for 2023-2028
            • Chart on Global - Market size and forecast 2023-2028 ($ million)
            • Data Table on Global - Market size and forecast 2023-2028 ($ million)
            • Chart on Global Market: Year-over-year growth 2023-2028 (%)
            • Data Table on Global Market: Year-over-year growth 2023-2028 (%)

          5 Historic Market Size

          • 5.1 Global Smart Connected Clothing Market 2018 - 2022
            • Historic Market Size - Data Table on Global Smart Connected Clothing Market 2018 - 2022 ($ million)
          • 5.2 Distribution Channel segment analysis 2018 - 2022
            • Historic Market Size - Distribution Channel Segment 2018 - 2022 ($ million)
          • 5.3 End-user segment analysis 2018 - 2022
            • Historic Market Size - End-user Segment 2018 - 2022 ($ million)
          • 5.4 Geography segment analysis 2018 - 2022
            • Historic Market Size - Geography Segment 2018 - 2022 ($ million)
          • 5.5 Country segment analysis 2018 - 2022
            • Historic Market Size - Country Segment 2018 - 2022 ($ million)

          6 Qualitative Analysis

          • 6.1 Impact of AI on Global Smart Connected Clothing Market

            7 Five Forces Analysis

            • 7.1 Five forces summary
              • Five forces analysis - Comparison between 2023 and 2028
            • 7.2 Bargaining power of buyers
              • Bargaining power of buyers - Impact of key factors 2023 and 2028
            • 7.3 Bargaining power of suppliers
              • Bargaining power of suppliers - Impact of key factors in 2023 and 2028
            • 7.4 Threat of new entrants
              • Threat of new entrants - Impact of key factors in 2023 and 2028
            • 7.5 Threat of substitutes
              • Threat of substitutes - Impact of key factors in 2023 and 2028
            • 7.6 Threat of rivalry
              • Threat of rivalry - Impact of key factors in 2023 and 2028
            • 7.7 Market condition
              • Chart on Market condition - Five forces 2023 and 2028

            8 Market Segmentation by Distribution Channel

            • 8.1 Market segments
              • Chart on Distribution Channel - Market share 2023-2028 (%)
              • Data Table on Distribution Channel - Market share 2023-2028 (%)
            • 8.2 Comparison by Distribution Channel
              • Chart on Comparison by Distribution Channel
              • Data Table on Comparison by Distribution Channel
            • 8.3 Offline - Market size and forecast 2023-2028
              • Chart on Offline - Market size and forecast 2023-2028 ($ million)
              • Data Table on Offline - Market size and forecast 2023-2028 ($ million)
              • Chart on Offline - Year-over-year growth 2023-2028 (%)
              • Data Table on Offline - Year-over-year growth 2023-2028 (%)
            • 8.4 Online - Market size and forecast 2023-2028
              • Chart on Online - Market size and forecast 2023-2028 ($ million)
              • Data Table on Online - Market size and forecast 2023-2028 ($ million)
              • Chart on Online - Year-over-year growth 2023-2028 (%)
              • Data Table on Online - Year-over-year growth 2023-2028 (%)
            • 8.5 Market opportunity by Distribution Channel
              • Market opportunity by Distribution Channel ($ million)
              • Data Table on Market opportunity by Distribution Channel ($ million)

            9 Market Segmentation by End-user

            • 9.1 Market segments
              • Chart on End-user - Market share 2023-2028 (%)
              • Data Table on End-user - Market share 2023-2028 (%)
            • 9.2 Comparison by End-user
              • Chart on Comparison by End-user
              • Data Table on Comparison by End-user
            • 9.3 Men - Market size and forecast 2023-2028
              • Chart on Men - Market size and forecast 2023-2028 ($ million)
              • Data Table on Men - Market size and forecast 2023-2028 ($ million)
              • Chart on Men - Year-over-year growth 2023-2028 (%)
              • Data Table on Men - Year-over-year growth 2023-2028 (%)
            • 9.4 Women - Market size and forecast 2023-2028
              • Chart on Women - Market size and forecast 2023-2028 ($ million)
              • Data Table on Women - Market size and forecast 2023-2028 ($ million)
              • Chart on Women - Year-over-year growth 2023-2028 (%)
              • Data Table on Women - Year-over-year growth 2023-2028 (%)
            • 9.5 Children - Market size and forecast 2023-2028
              • Chart on Children - Market size and forecast 2023-2028 ($ million)
              • Data Table on Children - Market size and forecast 2023-2028 ($ million)
              • Chart on Children - Year-over-year growth 2023-2028 (%)
              • Data Table on Children - Year-over-year growth 2023-2028 (%)
            • 9.6 Market opportunity by End-user
              • Market opportunity by End-user ($ million)
              • Data Table on Market opportunity by End-user ($ million)

            10 Customer Landscape

            • 10.1 Customer landscape overview
              • Analysis of price sensitivity, lifecycle, customer purchase basket, adoption rates, and purchase criteria

            11 Geographic Landscape

            • 11.1 Geographic segmentation
              • Chart on Market share by geography 2023-2028 (%)
              • Data Table on Market share by geography 2023-2028 (%)
            • 11.2 Geographic comparison
              • Chart on Geographic comparison
              • Data Table on Geographic comparison
            • 11.3 North America - Market size and forecast 2023-2028
              • Chart on North America - Market size and forecast 2023-2028 ($ million)
              • Data Table on North America - Market size and forecast 2023-2028 ($ million)
              • Chart on North America - Year-over-year growth 2023-2028 (%)
              • Data Table on North America - Year-over-year growth 2023-2028 (%)
            • 11.4 Europe - Market size and forecast 2023-2028
              • Chart on Europe - Market size and forecast 2023-2028 ($ million)
              • Data Table on Europe - Market size and forecast 2023-2028 ($ million)
              • Chart on Europe - Year-over-year growth 2023-2028 (%)
              • Data Table on Europe - Year-over-year growth 2023-2028 (%)
            • 11.5 APAC - Market size and forecast 2023-2028
              • Chart on APAC - Market size and forecast 2023-2028 ($ million)
              • Data Table on APAC - Market size and forecast 2023-2028 ($ million)
              • Chart on APAC - Year-over-year growth 2023-2028 (%)
              • Data Table on APAC - Year-over-year growth 2023-2028 (%)
            • 11.6 South America - Market size and forecast 2023-2028
              • Chart on South America - Market size and forecast 2023-2028 ($ million)
              • Data Table on South America - Market size and forecast 2023-2028 ($ million)
              • Chart on South America - Year-over-year growth 2023-2028 (%)
              • Data Table on South America - Year-over-year growth 2023-2028 (%)
            • 11.7 Middle East and Africa - Market size and forecast 2023-2028
              • Chart on Middle East and Africa - Market size and forecast 2023-2028 ($ million)
              • Data Table on Middle East and Africa - Market size and forecast 2023-2028 ($ million)
              • Chart on Middle East and Africa - Year-over-year growth 2023-2028 (%)
              • Data Table on Middle East and Africa - Year-over-year growth 2023-2028 (%)
            • 11.8 China - Market size and forecast 2023-2028
              • Chart on China - Market size and forecast 2023-2028 ($ million)
              • Data Table on China - Market size and forecast 2023-2028 ($ million)
              • Chart on China - Year-over-year growth 2023-2028 (%)
              • Data Table on China - Year-over-year growth 2023-2028 (%)
            • 11.9 Japan - Market size and forecast 2023-2028
              • Chart on Japan - Market size and forecast 2023-2028 ($ million)
              • Data Table on Japan - Market size and forecast 2023-2028 ($ million)
              • Chart on Japan - Year-over-year growth 2023-2028 (%)
              • Data Table on Japan - Year-over-year growth 2023-2028 (%)
            • 11.10 India - Market size and forecast 2023-2028
              • Chart on India - Market size and forecast 2023-2028 ($ million)
              • Data Table on India - Market size and forecast 2023-2028 ($ million)
              • Chart on India - Year-over-year growth 2023-2028 (%)
              • Data Table on India - Year-over-year growth 2023-2028 (%)
            • 11.11 France - Market size and forecast 2023-2028
              • Chart on France - Market size and forecast 2023-2028 ($ million)
              • Data Table on France - Market size and forecast 2023-2028 ($ million)
              • Chart on France - Year-over-year growth 2023-2028 (%)
              • Data Table on France - Year-over-year growth 2023-2028 (%)
            • 11.12 South Korea - Market size and forecast 2023-2028
              • Chart on South Korea - Market size and forecast 2023-2028 ($ million)
              • Data Table on South Korea - Market size and forecast 2023-2028 ($ million)
              • Chart on South Korea - Year-over-year growth 2023-2028 (%)
              • Data Table on South Korea - Year-over-year growth 2023-2028 (%)
            • 11.13 Germany - Market size and forecast 2023-2028
              • Chart on Germany - Market size and forecast 2023-2028 ($ million)
              • Data Table on Germany - Market size and forecast 2023-2028 ($ million)
              • Chart on Germany - Year-over-year growth 2023-2028 (%)
              • Data Table on Germany - Year-over-year growth 2023-2028 (%)
            • 11.14 UK - Market size and forecast 2023-2028
              • Chart on UK - Market size and forecast 2023-2028 ($ million)
              • Data Table on UK - Market size and forecast 2023-2028 ($ million)
              • Chart on UK - Year-over-year growth 2023-2028 (%)
              • Data Table on UK - Year-over-year growth 2023-2028 (%)
            • 11.15 Italy - Market size and forecast 2023-2028
              • Chart on Italy - Market size and forecast 2023-2028 ($ million)
              • Data Table on Italy - Market size and forecast 2023-2028 ($ million)
              • Chart on Italy - Year-over-year growth 2023-2028 (%)
              • Data Table on Italy - Year-over-year growth 2023-2028 (%)
            • 11.16 US - Market size and forecast 2023-2028
              • Chart on US - Market size and forecast 2023-2028 ($ million)
              • Data Table on US - Market size and forecast 2023-2028 ($ million)
              • Chart on US - Year-over-year growth 2023-2028 (%)
              • Data Table on US - Year-over-year growth 2023-2028 (%)
            • 11.17 Canada - Market size and forecast 2023-2028
              • Chart on Canada - Market size and forecast 2023-2028 ($ million)
              • Data Table on Canada - Market size and forecast 2023-2028 ($ million)
              • Chart on Canada - Year-over-year growth 2023-2028 (%)
              • Data Table on Canada - Year-over-year growth 2023-2028 (%)
            • 11.18 Market opportunity by geography
              • Market opportunity by geography ($ million)
              • Data Tables on Market opportunity by geography ($ million)

            12 Drivers, Challenges, and Opportunity/Restraints

            • 12.1 Market drivers
              • 12.2 Market challenges
                • 12.3 Impact of drivers and challenges
                  • Impact of drivers and challenges in 2023 and 2028
                • 12.4 Market opportunities/restraints

                  13 Competitive Landscape

                  • 13.1 Overview
                    • 13.2 Competitive Landscape
                      • Overview on criticality of inputs and factors of differentiation
                    • 13.3 Landscape disruption
                      • Overview on factors of disruption
                    • 13.4 Industry risks
                      • Impact of key risks on business

                    14 Competitive Analysis

                    • 14.1 Companies profiled
                      • Companies covered
                    • 14.2 Company ranking index
                      • Company ranking index
                    • 14.3 Market positioning of companies
                      • Matrix on companies position and classification
                    • 14.4 AiQ Smart Clothing Inc.
                      • AiQ Smart Clothing Inc. - Overview
                      • AiQ Smart Clothing Inc. - Product / Service
                      • AiQ Smart Clothing Inc. - Key offerings
                      • SWOT
                    • 14.5 Athos
                      • Athos - Overview
                      • Athos - Product / Service
                      • Athos - Key offerings
                      • SWOT
                    • 14.6 DuPont de Nemours Inc.
                      • DuPont de Nemours Inc. - Overview
                      • DuPont de Nemours Inc. - Business segments
                      • DuPont de Nemours Inc. - Key news
                      • DuPont de Nemours Inc. - Key offerings
                      • DuPont de Nemours Inc. - Segment focus
                      • SWOT
                    • 14.7 Hexoskin
                      • Hexoskin - Overview
                      • Hexoskin - Product / Service
                      • Hexoskin - Key offerings
                      • SWOT
                    • 14.8 Myontec Oy
                      • Myontec Oy - Overview
                      • Myontec Oy - Product / Service
                      • Myontec Oy - Key offerings
                      • SWOT
                    • 14.9 Myzone Group
                      • Myzone Group - Overview
                      • Myzone Group - Product / Service
                      • Myzone Group - Key offerings
                      • SWOT
                    • 14.10 Owlet Inc.
                      • Owlet Inc. - Overview
                      • Owlet Inc. - Product / Service
                      • Owlet Inc. - Key offerings
                      • SWOT
                    • 14.11 Sensoria Inc.
                      • Sensoria Inc. - Overview
                      • Sensoria Inc. - Product / Service
                      • Sensoria Inc. - Key offerings
                      • SWOT
                    • 14.12 Vulpes Electronics GmbH
                      • Vulpes Electronics GmbH - Overview
                      • Vulpes Electronics GmbH - Product / Service
                      • Vulpes Electronics GmbH - Key offerings
                      • SWOT
                    • 14.13 Wearable X
                      • Wearable X - Overview
                      • Wearable X - Product / Service
                      • Wearable X - Key offerings
                      • SWOT

                    15 Appendix

                    • 15.1 Scope of the report
                      • 15.2 Inclusions and exclusions checklist
                        • Inclusions checklist
                        • Exclusions checklist
                      • 15.3 Currency conversion rates for US$
                        • Currency conversion rates for US$
                      • 15.4 Research methodology
                        • Research methodology
                      • 15.5 Data procurement
                        • Information sources
                      • 15.6 Data validation
                        • Data validation
                      • 15.7 Validation techniques employed for market sizing
                        • Validation techniques employed for market sizing
                      • 15.8 Data synthesis
                        • Data synthesis
                      • 15.9 360 degree market analysis
                        • 360 degree market analysis
                      • 15.10 List of abbreviations
                        • List of abbreviations

                      Research Methodology

                      Technavio presents a detailed picture of the market by way of study, synthesis, and summation of data from multiple sources. The analysts have presented the various facets of the market with a particular focus on identifying the key industry influencers. The data thus presented is comprehensive, reliable, and the result of extensive research, both primary and secondary.

                      INFORMATION SOURCES

                      Primary sources

                      • Manufacturers and suppliers
                      • Channel partners
                      • Industry experts
                      • Strategic decision makers

                      Secondary sources

                      • Industry journals and periodicals
                      • Government data
                      • Financial reports of key industry players
                      • Historical data
                      • Press releases

                      DATA ANALYSIS

                      Data Synthesis

                      • Collation of data
                      • Estimation of key figures
                      • Analysis of derived insights

                      Data Validation

                      • Triangulation with data models
                      • Reference against proprietary databases
                      • Corroboration with industry experts

                      REPORT WRITING

                      Qualitative

                      • Market drivers
                      • Market challenges
                      • Market trends
                      • Five forces analysis

                      Quantitative

                      • Market size and forecast
                      • Market segmentation
                      • Geographical insights
                      • Competitive landscape

                      Interested in this report?

                      Get your sample now to see our research methodology and insights!

                      Download Now

                      Frequently Asked Questions

                      Smart Connected Clothing market growth will increase by $ 6558.9 mn during 2024-2028.

                      The Smart Connected Clothing market is expected to grow at a CAGR of 26.1% during 2024-2028.

                      Smart Connected Clothing market is segmented by Distribution Channel( Offline, Online) End-user( Men, Women, Children)

                      AiQ Smart Clothing Inc., Athos, DuPont de Nemours Inc., Hexoskin, Interactive Wear AG, Kolon Industries Inc., Myontec Oy, Myzone Group, Noble Biomaterials Inc., Ohmatex AS, OTEX Specialty Narrow Fabrics, Outlast Technologies GmbH, Owlet Inc., Schoeller Textil AG, Sensoria Inc., Toyobo Co. Ltd., Vista Medical Ltd., Vulpes Electronics GmbH, Wearable X are a few of the key vendors in the Smart Connected Clothing market.

                      North America will register the highest growth rate of 37% among the other regions. Therefore, the Smart Connected Clothing market in North America is expected to garner significant business opportunities for the vendors during the forecast period.

                      China, Japan, India, France

                      • Technology innovation leading to product premiumizationThe market is driven by innovations in connectivity technologies. The world has witnessed an emergence of potential technologies in the last decade. Some of the leading technologies that have brought revolutionary changes across the industry are wireless technology is the driving factor this market.
                      • Bluetooth motion sensors is the driving factor this market.
                      • thermal sensors is the driving factor this market.
                      • infrared (IR) is the driving factor this market.
                      • near frequency communication (NFC) is the driving factor this market.
                      • pulse oximetry technology is the driving factor this market.
                      • and electrocardiogram (ECG) technology. These technologies are used as the foundational ideas in the concept of smart connected clothing such as skirts is the driving factor this market.
                      • shirts is the driving factor this market.
                      • jeans is the driving factor this market.
                      • and clothing accessories. Thus is the driving factor this market.
                      • technological innovation forms the basis for the manufacturing of smart connected clothing. Most vendors in the global smart connected clothing market are focusing on incorporating the latest features in their smart clothing through connectivity technologies is the driving factor this market.
                      • which helps them to sell their products at a premium price is the driving factor this market.
                      • and this enables the vendors to earn a high profit margin on these clothing products. Thus is the driving factor this market.
                      • such factors are expected to drive the growth of the market in focus during the forecast period. is the driving factor this market.

                      The Smart Connected Clothing market vendors should focus on grabbing business opportunities from the Offline segment as it accounted for the largest market share in the base year.
                      RIA - Research AI Assistant
                      Ask RIA