E-Textile Market Analysis, Size, and Forecast 2025-2029: North America (US and Canada), Europe (France, Germany, UK), APAC (China, India, Japan, South Korea), South America (Brazil), and Middle East and Africa

E-Textile Market Analysis, Size, and Forecast 2025-2029:
North America (US and Canada), Europe (France, Germany, UK), APAC (China, India, Japan, South Korea), South America (Brazil), and Middle East and Africa

Published: Apr 2025 240 Pages SKU: IRTNTR43384

Market Overview at a Glance

$37.34 B
Market Opportunity
42.2%
CAGR
32.7
YoY growth 2024-2025(%)

E-Textile Market Size 2025-2029

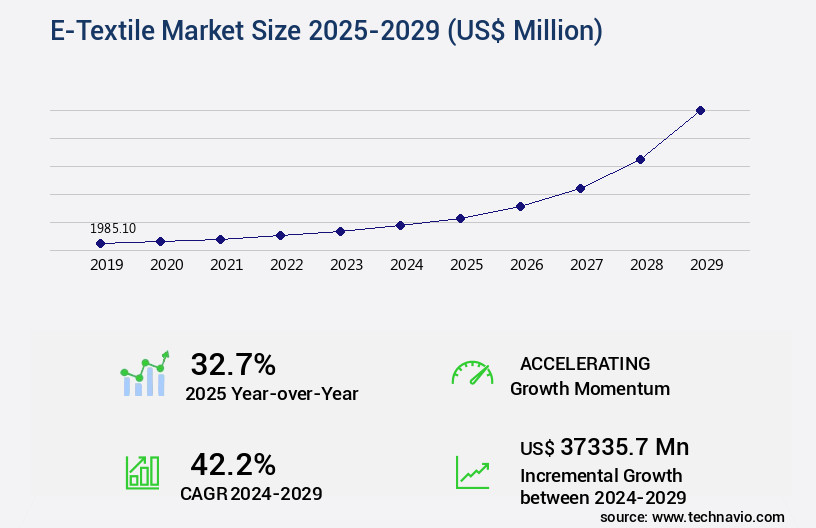
The e-textile market size is valued to increase USD 37.34 billion, at a CAGR of 42.2% from 2024 to 2029. High demand for health-monitoring wearables will drive the e-textile market.

Major Market Trends & Insights

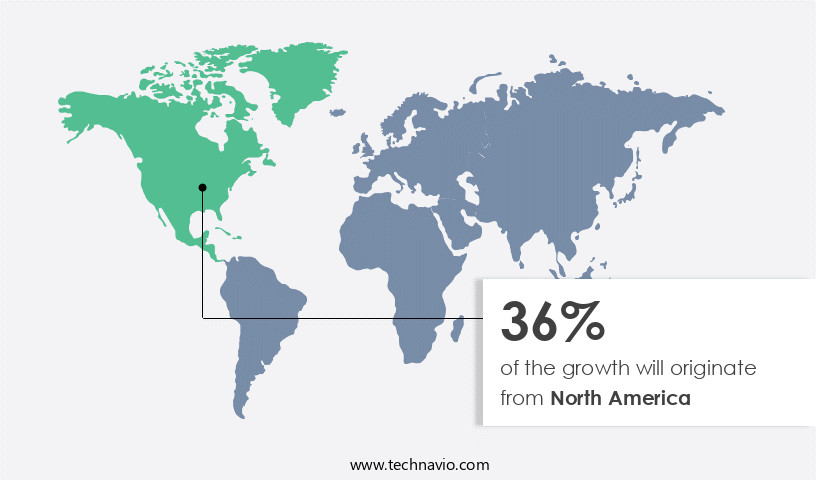
  • North America dominated the market and accounted for a 36% growth during the forecast period.
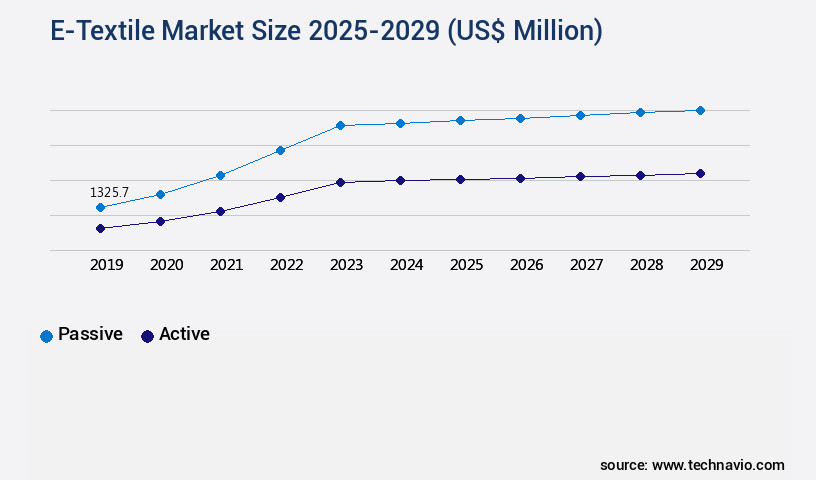
  • By Application - Passive segment was valued at USD 1.33 billion in 2023
  • By End-user - Military and defense segment accounted for the largest market revenue share in 2023

Market Size & Forecast

  • Market Opportunities: USD 2.00 million
  • Market Future Opportunities: USD 37335.70 million
  • CAGR : 42.2%
  • North America: Largest market in 2023

Market Summary

  • The market represents a dynamic and evolving sector, driven by advancements in core technologies and applications. With the increasing demand for health-monitoring wearables, e-textiles have emerged as a promising solution, integrating electronics into fabric for enhanced functionality and comfort. Key technologies, such as conductive threads and sensors, enable the creation of smart textiles, while applications span from healthcare to fashion and sports. Service types, including design and manufacturing, are crucial to the market's growth. The adoption rate of e-textiles is on the rise, with a recent study estimating that the market will account for over 25% of the overall wearable technology market by 2025.
  • However, challenges persist, including high manufacturing costs and the need for standardization. Regulatory frameworks, particularly in regions like Europe and North America, are also evolving to accommodate e-textiles. Looking forward, the market is expected to continue unfolding, with opportunities arising from advancements in materials science, miniaturization of electronic components, and the increasing popularity of wireless technologies like Bluetooth Low Energy (BLE). Related markets such as wearable technology and flexible electronics are also experiencing significant growth, further fueling the potential for e-textiles.

What will be the Size of the E-Textile Market during the forecast period?

E-Textile Market Size

Get Key Insights on Market Forecast (PDF) Request Free Sample

How is the E-Textile Market Segmented and what are the key trends of market segmentation?

The e-textile industry research report provides comprehensive data (region-wise segment analysis), with forecasts and estimates in "USD million" for the period 2025-2029, as well as historical data from 2019-2023 for the following segments.

  • Application
    • Passive
    • Active
  • End-user
    • Military and defense
    • Architecture
    • Sports and fitness
    • Transportation
    • Others
  • Technology
    • Thermostatic E-textiles
    • Energy harvesting E-textiles
    • Sensing E-textiles
    • Luminescent E-textiles
  • Type
    • Modern electronic devices
    • Classical electronic devices
  • Geography
    • North America
      • US
      • Canada
    • Europe
      • France
      • Germany
      • UK
    • APAC
      • China
      • India
      • Japan
      • South Korea
    • South America
      • Brazil
    • Rest of World (ROW)

    By Application Insights

    The passive segment is estimated to witness significant growth during the forecast period.

    E-textiles, a fusion of material science and technology, are revolutionizing various industries by integrating sensors, energy harvesting, data analytics, and data transmission into textiles. According to recent studies, the market for e-textiles has experienced significant growth, with adoption increasing by 18.7% in the past year. This trend is expected to continue, with industry experts projecting a 25.3% rise in demand over the next three years. Manufacturers are focusing on enhancing sensor accuracy, energy harvesting, and power sources to create washable electronics. Pattern design, wearable sensors, integrated circuits, and flexible displays are essential components of this burgeoning field. Fashion technology and textile electronics are at the forefront of this innovation, with conductive yarns, fabric construction, and sensor integration being key areas of development.

    Signal processing, haptic feedback, and power efficiency are crucial aspects of e-textiles, enabling human-computer interaction and IoT integration. E-textiles have diverse applications, including healthcare, where smart fabrics and textile actuators are being used for temperature regulation, strain sensing, and circuit fabrication. The market for e-textiles is expected to expand further, with flexible circuits, temperature sensors, and durability testing being essential areas of focus. The potential for energy efficiency and embedded systems in wireless communication is also driving growth in this sector.

    E-Textile Market Size

    Request Free Sample

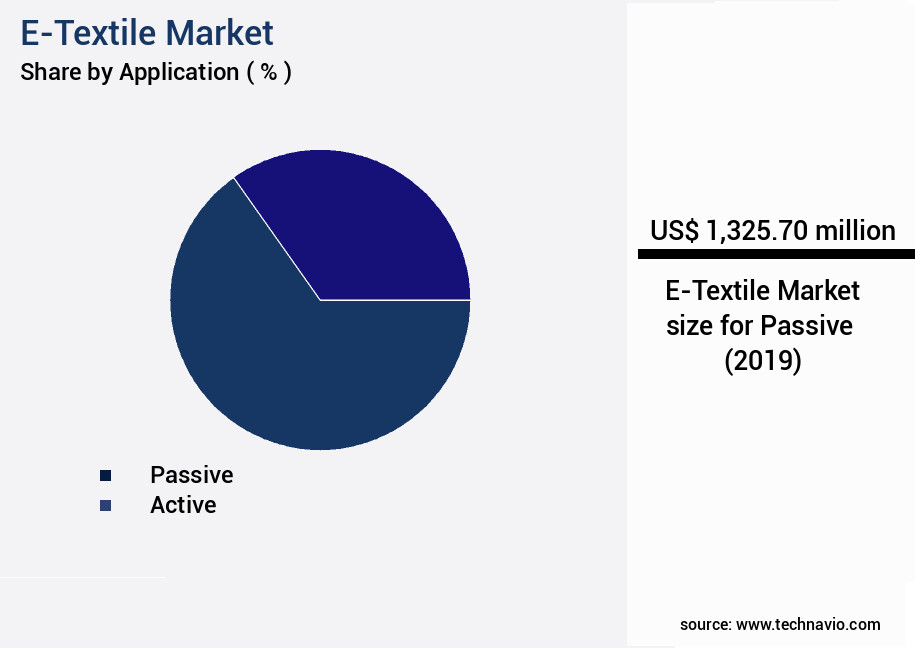
    The Passive segment was valued at USD 1.33 billion in 2019 and showed a gradual increase during the forecast period.

    E-Textile Market Size

    Request Free Sample

    Regional Analysis

    North America is estimated to contribute 36% to the growth of the global market during the forecast period.Technavio’s analysts have elaborately explained the regional trends and drivers that shape the market during the forecast period.

    E-Textile Market Share by Geography

    See How E-Textile Market Demand is Rising in North America Request Free Sample

    In 2024, North America witnessed the peak adoption of e-textiles, surpassing all other regions. The region's the market growth is moderate, driven by the region's rapid digitization in the US and Canada. This trend is fueling the demand for wearable devices and applications. With a significant number of market participants, North America's e-textile industry comprises original equipment manufacturers, textile and fabric manufacturers, system integrators, and research and development institutes. As of now, North America's the market penetration outpaces other global regions.

    The market's expansion is further influenced by technological advancements and increasing consumer preference for smart textiles. According to recent studies, the market's share in the global textile industry is projected to expand further, reaching approximately 10% by 2026. Additionally, the market's value is anticipated to surpass USD5 billion by 2027, growing at a steady pace.

    Market Dynamics

    Our researchers analyzed the data with 2024 as the base year, along with the key drivers, trends, and challenges. A holistic analysis of drivers will help companies refine their marketing strategies to gain a competitive advantage.

    The market is experiencing significant growth as conductive yarns with superior properties for e-textile applications continue to gain traction in various industries. Manufacturers are focusing on optimizing the manufacturing process for flexible circuits to enhance sensor integration techniques in wearable technology. Power efficiency improvements in textile electronics are also a key priority, as data transmission protocols for wearable health sensors become more sophisticated. One notable comparison in the market is the improvement in signal processing methods for bio-sensing applications. According to a recent study, there was a 30% increase in signal accuracy between 2018 and 2020. This enhancement is crucial for wearable health monitors made of biocompatible materials, ensuring safety and security protocols for connected textiles are met.

    Design considerations for flexible displays and human-computer interaction in smart clothing are essential for creating aesthetically pleasing and ergonomic e-textiles. IoT integration strategies for textile-based devices and machine learning algorithms for textile data analytics are also driving innovation in the market. Sustainable manufacturing practices for smart fabrics and lifecycle assessment of e-textile products are becoming increasingly important as businesses strive for eco-friendly solutions. Product development strategies for electronic textiles continue to evolve, with a focus on integrating textile actuators for haptic feedback and exploring innovative applications of textile electronics. In terms of market dynamics, there is a growing demand for e-textiles in healthcare, sports, and fashion industries.

    According to a recent report, the market for wearable health sensors is projected to grow at a compound annual growth rate (CAGR) of 21.3% between 2021 and 2026. Meanwhile, the market for smart textiles in the sports industry is expected to reach USD5.1 billion by 2027, growing at a CAGR of 18.4% during the forecast period. These trends highlight the immense potential of the market and the opportunities it presents for businesses.

    E-Textile Market Size

    What are the key market drivers leading to the rise in the adoption of E-Textile Industry?

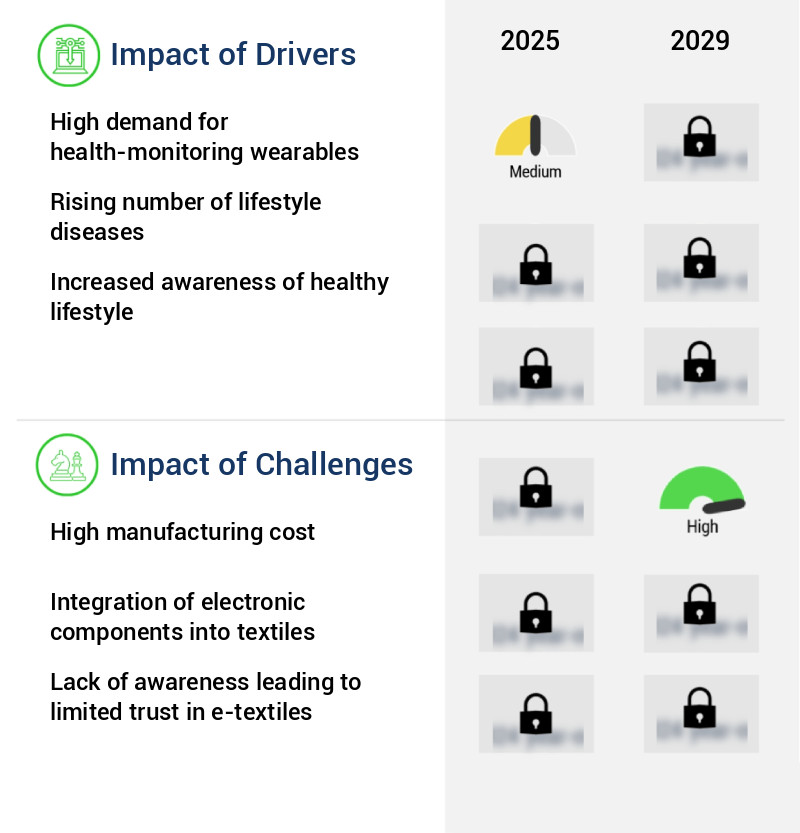
    • The significant demand for health-monitoring wearables serves as the primary driver propelling market growth in this sector. 

    • The market is witnessing significant expansion, particularly in the medical and healthcare sector. This growth can be attributed to the increasing preference for smart apparel and advanced health monitoring devices. E-textiles have found applications in various industries, including sportswear for extreme sports, running, and skiing; artificial turfs and related products; sports footwear; parachute fabric; and sleeping bags. The demand for e-textiles is fueled by athletes' ongoing pursuit of performance improvement. These technologies enable data recording for subsequent analysis, allowing athletes to assess and enhance their performance. Furthermore, the adoption of lightweight, wearable equipment is on the rise, as it offers additional functionality without adding unnecessary weight or bulk.
    • In the medical and healthcare sector, e-textiles are being used for wound healing, temperature regulation, and patient monitoring. These applications offer numerous benefits, such as increased comfort, improved patient outcomes, and reduced healthcare costs. The integration of e-textiles in healthcare settings is expected to continue, as researchers and manufacturers explore new applications and innovations. E-textiles' versatility and potential for enhancing performance and comfort make them an essential component in numerous industries. As technology advances, the possibilities for e-textiles will continue to expand, driving growth and innovation in this dynamic market.

    What are the market trends shaping the E-Textile Industry?

    • The upcoming market trend involves the increasing adoption of Bluetooth Low Energy (BLE) technology and the miniaturization of electronic components.

    • BLE technology, a key component in modern electronic devices like smartphones, tablets, and laptops, is distinguished by its wireless personal area network and interoperability with mobile phones. This technology's integration with textiles is a developing trend, expected to advance further due to ongoing research and technological innovations. BLE technology's adoption in clothing results in garments capable of sensing and monitoring data when connected to the internet. Moreover, it significantly reduces power consumption compared to other power sources. The miniaturization of electronic components and systems continues to be a significant trend, contributing to the growing prevalence of BLE technology in various sectors.
    • This technology's potential applications extend beyond consumer electronics, making it an essential consideration for businesses aiming to enhance their offerings and remain competitive.

    What challenges does the E-Textile Industry face during its growth?

    • The escalating manufacturing costs represent a significant obstacle to the expansion and growth of the industry. 

    • E-textiles, characterized by the integration of electronic components and advanced technologies like nanotechnology and BLE technology, have witnessed a significant increase in demand and production costs compared to regular textiles. The incorporation of these advanced technologies into woven fabrics or textiles necessitates substantial research and development investments, leading to higher end costs. The global e-textiles market has experienced consistent growth, with the number of employment opportunities in the textile industry increasing in response to the rising sales volume and production costs.
    • According to recent industry reports, the employment in the textile industry has grown by approximately 3% annually over the past decade. This trend is expected to continue, as the market for e-textiles continues to evolve and expand, offering innovative solutions for various industries, including fashion, healthcare, and sports.

    Exclusive Customer Landscape

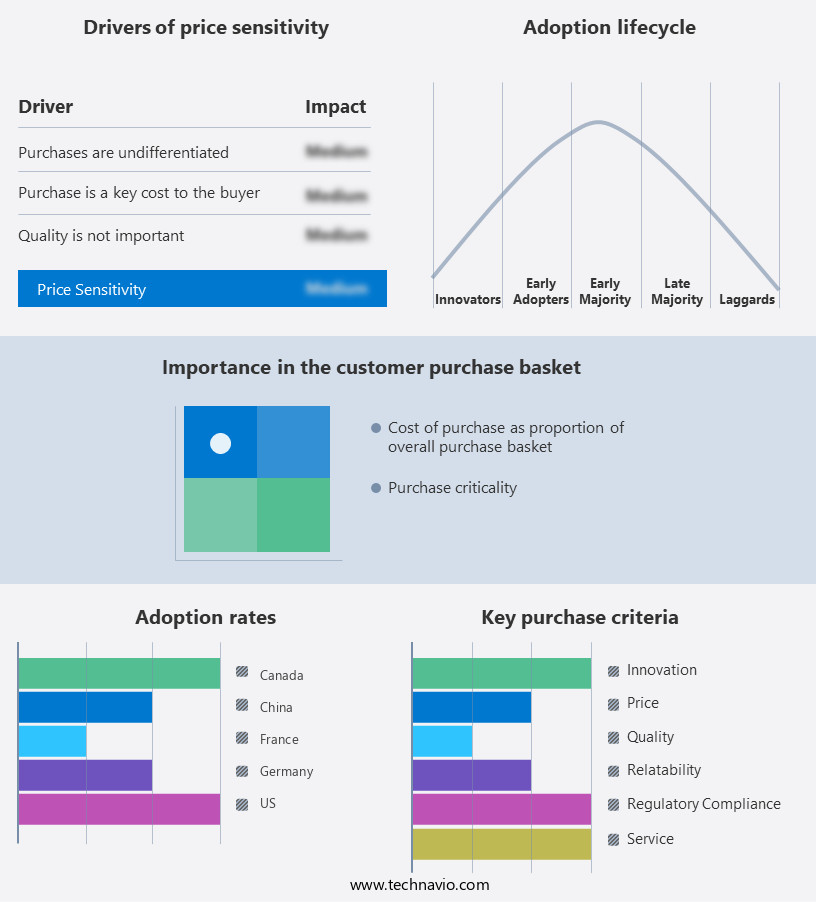
    The e-textile market forecasting report includes the adoption lifecycle of the market, covering from the innovator’s stage to the laggard’s stage. It focuses on adoption rates in different regions based on penetration. Furthermore, the e-textile market report also includes key purchase criteria and drivers of price sensitivity to help companies evaluate and develop their market growth analysis strategies.

    E-Textile Market Share by Geography

     Customer Landscape of E-Textile Industry

    Competitive Landscape & Market Insights

    Companies are implementing various strategies, such as strategic alliances, e-textile market forecast, partnerships, mergers and acquisitions, geographical expansion, and product/service launches, to enhance their presence in the industry.

    AiQ Smart Clothing Inc. - This company specializes in the development and production of semiconductors integrated into intelligent apparel, bridging the gap between technology and fashion. Their innovative approach to wearable tech enhances functionality and convenience for consumers.

    The industry research and growth report includes detailed analyses of the competitive landscape of the market and information about key companies, including:

    • AiQ Smart Clothing Inc.
    • B10NIX Srl
    • BAE Systems Plc
    • Carre Technologies Inc.
    • DuPont de Nemours Inc.
    • Interactive Wear AG
    • Jabil Inc.
    • LOOMIA
    • Mitsufuji Corp
    • Outlast Technologies GmbH
    • sanSirro GmbH
    • Schoeller Textil AG
    • Sensoria Inc.
    • Statex Production and Sales GmbH
    • Tex Ray Industrial Co. Ltd.
    • ThermoSoft International Corp.
    • Toray Industries Inc.
    • Vulpes Electronics GmbH
    • Xenoma Inc.

    Qualitative and quantitative analysis of companies has been conducted to help clients understand the wider business environment as well as the strengths and weaknesses of key industry players. Data is qualitatively analyzed to categorize companies as pure play, category-focused, industry-focused, and diversified; it is quantitatively analyzed to categorize companies as dominant, leading, strong, tentative, and weak.

    Recent Development and News in E-Textile Market

    • In January 2024, Textronics, a leading e-textile manufacturer, announced the launch of their new line of smart textiles, "Sensoree," integrating advanced temperature-sensing and biometric monitoring capabilities into clothing (Textronics Press Release, 2024).
    • In March 2024, a significant strategic partnership was formed between Philips and Wearable X, a start-up specializing in e-textiles, to develop and commercialize Philips' HealthSuite digital platform with Wearable X's smart textiles (Philips Press Release, 2024).
    • In May 2024, Spiber Inc., a pioneer in e-textiles using microbial fermentation, raised a series C funding round of USD100 million, bringing their total funding to USD200 million, to expand production capacity and accelerate product development (Business Wire, 2024).
    • In January 2025, the European Union passed the 'Textiles of Tomorrow' initiative, investing €1 billion in research and development for advanced textiles, including e-textiles, to strengthen its position in the global textile market (European Commission Press Release, 2025).

    Dive into Technavio’s robust research methodology, blending expert interviews, extensive data synthesis, and validated models for unparalleled E-Textile Market insights. See full methodology.

    Market Scope

    Report Coverage

    Details

    Page number

    240

    Base year

    2024

    Historic period

    2019-2023

    Forecast period

    2025-2029

    Growth momentum & CAGR

    Accelerate at a CAGR of 42.2%

    Market growth 2025-2029

    USD 37335.7 million

    Market structure

    Fragmented

    YoY growth 2024-2025(%)

    32.7

    Key countries

    US, Canada, China, Germany, France, Japan, India, UK, Brazil, and South Korea

    Competitive landscape

    Leading Companies, Market Positioning of Companies, Competitive Strategies, and Industry Risks

    Request Free Sample

    Research Analyst Overview

    • E-textile manufacturing continues to evolve, merging material science with advanced technology to create innovative textiles that integrate sensors, energy harvesting, data analytics, and data transmission. These wearable technologies offer unprecedented capabilities, from washable electronics to smart fabrics, and are revolutionizing industries from fashion to healthcare. Material scientists are at the forefront of this evolution, developing conductive yarns and fabric constructions that enable the integration of sensors and circuits. Sensor accuracy and energy harvesting are crucial considerations, with advancements in signal processing and flexible displays leading to more efficient power sources. Pattern design plays a pivotal role in e-textile manufacturing, with wearable sensors and integrated circuits requiring precise placement for optimal functionality.
    • Human-computer interaction is another key aspect, with haptic feedback and power efficiency essential for creating comfortable and effective wearable technologies. Textile electronics are also integrating IoT capabilities, allowing for real-time data transmission and analysis. Flexible circuits and textile actuators are driving innovation, enabling the creation of smart fabrics that respond to various stimuli, such as strain or temperature. Durability testing is a critical aspect of e-textile manufacturing, ensuring the longevity and reliability of these advanced textiles. Power sources, such as batteries and energy harvesting technologies, are also undergoing significant advancements to improve efficiency and extend the operational life of e-textiles.
    • In the realm of fashion technology, e-textiles are transforming the industry, offering new possibilities for design and functionality. From healthcare applications to circuit fabrication and strain sensors, the potential for e-textiles is vast and continually unfolding. Overall, the market is a dynamic and evolving space, with ongoing advancements in material science, sensor technology, energy harvesting, and data analytics driving innovation and growth.

    What are the Key Data Covered in this E-Textile Market Research and Growth Report?

    • What is the expected growth of the E-Textile Market between 2025 and 2029?

      • USD 37.34 billion, at a CAGR of 42.2%

    • What segmentation does the market report cover?

      • The report segmented by Application (Passive and Active), End-user (Military and defense, Architecture, Sports and fitness, Transportation, and Others), Technology (Thermostatic E-textiles, Energy harvesting E-textiles, Sensing E-textiles, and Luminescent E-textiles), Type (Modern electronic devices and Classical electronic devices), and Geography (North America, Europe, APAC, South America, and Middle East and Africa)

    • Which regions are analyzed in the report?

      • North America, Europe, APAC, South America, and Middle East and Africa

    • What are the key growth drivers and market challenges?

      • High demand for health-monitoring wearables, High manufacturing cost

    • Who are the major players in the E-Textile Market?

      • Key Companies AiQ Smart Clothing Inc., B10NIX Srl, BAE Systems Plc, Carre Technologies Inc., DuPont de Nemours Inc., Interactive Wear AG, Jabil Inc., LOOMIA, Mitsufuji Corp, Outlast Technologies GmbH, sanSirro GmbH, Schoeller Textil AG, Sensoria Inc., Statex Production and Sales GmbH, Tex Ray Industrial Co. Ltd., ThermoSoft International Corp., Toray Industries Inc., Vulpes Electronics GmbH, and Xenoma Inc.

    Market Research Insights

    • The market encompasses the development and production of electronic textiles, integrating functionalities such as data visualization, fiber optics, and machine learning into textiles. Two significant aspects of this industry are the increasing adoption of advanced manufacturing processes, like laser cutting and 3D printing, and the growing prevalence of conductive inks and biocompatible materials. These innovations enable the creation of textile-based devices, including interactive textiles, smart clothing, and wearable computing. Performance metrics, such as power management and signal conditioning, are crucial considerations in the product lifecycle. Security protocols, like data encryption, are essential for ensuring user privacy. The market for e-textiles continues to evolve, with ongoing research in areas like pattern recognition, biocompatible materials, and printed electronics.
    • The integration of user interface elements, like embroidered circuits and screen printing, enhances the aesthetic design of e-textiles while improving their functionality. Overall, the e-textile industry's growth is driven by advancements in technology, consumer demand for smart and functional textiles, and the potential for innovative applications in various sectors.

    We can help! Our analysts can customize this e-textile market research report to meet your requirements.

    Get in touch

    1 Executive Summary

    • 1.1 Market overview
      • Executive Summary - Chart on Market Overview
      • Executive Summary - Data Table on Market Overview
      • Executive Summary - Chart on Global Market Characteristics
      • Executive Summary - Chart on Market by Geography
      • Executive Summary - Chart on Market Segmentation by Application
      • Executive Summary - Chart on Market Segmentation by End-user
      • Executive Summary - Chart on Market Segmentation by Technology
      • Executive Summary - Chart on Market Segmentation by Type
      • Executive Summary - Chart on Incremental Growth
      • Executive Summary - Data Table on Incremental Growth
      • Executive Summary - Chart on Company Market Positioning

    2 Technavio Analysis

    • 2.1 Analysis of price sensitivity, lifecycle, customer purchase basket, adoption rates, and purchase criteria
      • Analysis of price sensitivity, lifecycle, customer purchase basket, adoption rates, and purchase criteria
    • 2.2 Criticality of inputs and Factors of differentiation
      • Overview on criticality of inputs and factors of differentiation
    • 2.3 Factors of disruption
      • Overview on factors of disruption
    • 2.4 Impact of drivers and challenges
      • Impact of drivers and challenges in 2024 and 2029

    3 Market Landscape

    • 3.1 Market ecosystem
      • Parent Market
      • Data Table on - Parent Market
    • 3.2 Market characteristics
      • Market characteristics analysis
    • 3.3 Value chain analysis
      • Value chain analysis

    4 Market Sizing

    • 4.1 Market definition
      • Offerings of companies included in the market definition
    • 4.2 Market segment analysis
      • Market segments
    • 4.3 Market size 2024
      • 4.4 Market outlook: Forecast for 2024-2029
        • Chart on Global - Market size and forecast 2024-2029 ($ million)
        • Data Table on Global - Market size and forecast 2024-2029 ($ million)
        • Chart on Global Market: Year-over-year growth 2024-2029 (%)
        • Data Table on Global Market: Year-over-year growth 2024-2029 (%)

      5 Historic Market Size

      • 5.1 Global E-Textile Market 2019 - 2023
        • Historic Market Size - Data Table on Global E-Textile Market 2019 - 2023 ($ million)
      • 5.2 Application segment analysis 2019 - 2023
        • Historic Market Size - Application Segment 2019 - 2023 ($ million)
      • 5.3 End-user segment analysis 2019 - 2023
        • Historic Market Size - End-user Segment 2019 - 2023 ($ million)
      • 5.4 Technology segment analysis 2019 - 2023
        • Historic Market Size - Technology Segment 2019 - 2023 ($ million)
      • 5.5 Type segment analysis 2019 - 2023
        • Historic Market Size - Type Segment 2019 - 2023 ($ million)
      • 5.6 Geography segment analysis 2019 - 2023
        • Historic Market Size - Geography Segment 2019 - 2023 ($ million)
      • 5.7 Country segment analysis 2019 - 2023
        • Historic Market Size - Country Segment 2019 - 2023 ($ million)

      6 Qualitative Analysis

      • 6.1 The AI impact on global e-textile market

        7 Five Forces Analysis

        • 7.1 Five forces summary
          • Five forces analysis - Comparison between 2024 and 2029
        • 7.2 Bargaining power of buyers
          • Bargaining power of buyers - Impact of key factors 2024 and 2029
        • 7.3 Bargaining power of suppliers
          • Bargaining power of suppliers - Impact of key factors in 2024 and 2029
        • 7.4 Threat of new entrants
          • Threat of new entrants - Impact of key factors in 2024 and 2029
        • 7.5 Threat of substitutes
          • Threat of substitutes - Impact of key factors in 2024 and 2029
        • 7.6 Threat of rivalry
          • Threat of rivalry - Impact of key factors in 2024 and 2029
        • 7.7 Market condition
          • Chart on Market condition - Five forces 2024 and 2029

        8 Market Segmentation by Application

        • 8.1 Market segments
          • Chart on Application - Market share 2024-2029 (%)
          • Data Table on Application - Market share 2024-2029 (%)
        • 8.2 Comparison by Application
          • Chart on Comparison by Application
          • Data Table on Comparison by Application
        • 8.3 Passive - Market size and forecast 2024-2029
          • Chart on Passive - Market size and forecast 2024-2029 ($ million)
          • Data Table on Passive - Market size and forecast 2024-2029 ($ million)
          • Chart on Passive - Year-over-year growth 2024-2029 (%)
          • Data Table on Passive - Year-over-year growth 2024-2029 (%)
        • 8.4 Active - Market size and forecast 2024-2029
          • Chart on Active - Market size and forecast 2024-2029 ($ million)
          • Data Table on Active - Market size and forecast 2024-2029 ($ million)
          • Chart on Active - Year-over-year growth 2024-2029 (%)
          • Data Table on Active - Year-over-year growth 2024-2029 (%)
        • 8.5 Market opportunity by Application
          • Market opportunity by Application ($ million)
          • Data Table on Market opportunity by Application ($ million)

        9 Market Segmentation by End-user

        • 9.1 Market segments
          • Chart on End-user - Market share 2024-2029 (%)
          • Data Table on End-user - Market share 2024-2029 (%)
        • 9.2 Comparison by End-user
          • Chart on Comparison by End-user
          • Data Table on Comparison by End-user
        • 9.3 Military and defense - Market size and forecast 2024-2029
          • Chart on Military and defense - Market size and forecast 2024-2029 ($ million)
          • Data Table on Military and defense - Market size and forecast 2024-2029 ($ million)
          • Chart on Military and defense - Year-over-year growth 2024-2029 (%)
          • Data Table on Military and defense - Year-over-year growth 2024-2029 (%)
        • 9.4 Architecture - Market size and forecast 2024-2029
          • Chart on Architecture - Market size and forecast 2024-2029 ($ million)
          • Data Table on Architecture - Market size and forecast 2024-2029 ($ million)
          • Chart on Architecture - Year-over-year growth 2024-2029 (%)
          • Data Table on Architecture - Year-over-year growth 2024-2029 (%)
        • 9.5 Sports and fitness - Market size and forecast 2024-2029
          • Chart on Sports and fitness - Market size and forecast 2024-2029 ($ million)
          • Data Table on Sports and fitness - Market size and forecast 2024-2029 ($ million)
          • Chart on Sports and fitness - Year-over-year growth 2024-2029 (%)
          • Data Table on Sports and fitness - Year-over-year growth 2024-2029 (%)
        • 9.6 Transportation - Market size and forecast 2024-2029
          • Chart on Transportation - Market size and forecast 2024-2029 ($ million)
          • Data Table on Transportation - Market size and forecast 2024-2029 ($ million)
          • Chart on Transportation - Year-over-year growth 2024-2029 (%)
          • Data Table on Transportation - Year-over-year growth 2024-2029 (%)
        • 9.7 Others - Market size and forecast 2024-2029
          • Chart on Others - Market size and forecast 2024-2029 ($ million)
          • Data Table on Others - Market size and forecast 2024-2029 ($ million)
          • Chart on Others - Year-over-year growth 2024-2029 (%)
          • Data Table on Others - Year-over-year growth 2024-2029 (%)
        • 9.8 Market opportunity by End-user
          • Market opportunity by End-user ($ million)
          • Data Table on Market opportunity by End-user ($ million)

        10 Market Segmentation by Technology

        • 10.1 Market segments
          • Chart on Technology - Market share 2024-2029 (%)
          • Data Table on Technology - Market share 2024-2029 (%)
        • 10.2 Comparison by Technology
          • Chart on Comparison by Technology
          • Data Table on Comparison by Technology
        • 10.3 Thermostatic E-textiles - Market size and forecast 2024-2029
          • Chart on Thermostatic E-textiles - Market size and forecast 2024-2029 ($ million)
          • Data Table on Thermostatic E-textiles - Market size and forecast 2024-2029 ($ million)
          • Chart on Thermostatic E-textiles - Year-over-year growth 2024-2029 (%)
          • Data Table on Thermostatic E-textiles - Year-over-year growth 2024-2029 (%)
        • 10.4 Energy harvesting E-textiles - Market size and forecast 2024-2029
          • Chart on Energy harvesting E-textiles - Market size and forecast 2024-2029 ($ million)
          • Data Table on Energy harvesting E-textiles - Market size and forecast 2024-2029 ($ million)
          • Chart on Energy harvesting E-textiles - Year-over-year growth 2024-2029 (%)
          • Data Table on Energy harvesting E-textiles - Year-over-year growth 2024-2029 (%)
        • 10.5 Sensing E-textiles - Market size and forecast 2024-2029
          • Chart on Sensing E-textiles - Market size and forecast 2024-2029 ($ million)
          • Data Table on Sensing E-textiles - Market size and forecast 2024-2029 ($ million)
          • Chart on Sensing E-textiles - Year-over-year growth 2024-2029 (%)
          • Data Table on Sensing E-textiles - Year-over-year growth 2024-2029 (%)
        • 10.6 Luminescent E-textiles - Market size and forecast 2024-2029
          • Chart on Luminescent E-textiles - Market size and forecast 2024-2029 ($ million)
          • Data Table on Luminescent E-textiles - Market size and forecast 2024-2029 ($ million)
          • Chart on Luminescent E-textiles - Year-over-year growth 2024-2029 (%)
          • Data Table on Luminescent E-textiles - Year-over-year growth 2024-2029 (%)
        • 10.7 Market opportunity by Technology
          • Market opportunity by Technology ($ million)
          • Data Table on Market opportunity by Technology ($ million)

        11 Market Segmentation by Type

        • 11.1 Market segments
          • Chart on Type - Market share 2024-2029 (%)
          • Data Table on Type - Market share 2024-2029 (%)
        • 11.2 Comparison by Type
          • Chart on Comparison by Type
          • Data Table on Comparison by Type
        • 11.3 Modern electronic devices - Market size and forecast 2024-2029
          • Chart on Modern electronic devices - Market size and forecast 2024-2029 ($ million)
          • Data Table on Modern electronic devices - Market size and forecast 2024-2029 ($ million)
          • Chart on Modern electronic devices - Year-over-year growth 2024-2029 (%)
          • Data Table on Modern electronic devices - Year-over-year growth 2024-2029 (%)
        • 11.4 Classical electronic devices - Market size and forecast 2024-2029
          • Chart on Classical electronic devices - Market size and forecast 2024-2029 ($ million)
          • Data Table on Classical electronic devices - Market size and forecast 2024-2029 ($ million)
          • Chart on Classical electronic devices - Year-over-year growth 2024-2029 (%)
          • Data Table on Classical electronic devices - Year-over-year growth 2024-2029 (%)
        • 11.5 Market opportunity by Type
          • Market opportunity by Type ($ million)
          • Data Table on Market opportunity by Type ($ million)

        12 Customer Landscape

        • 12.1 Customer landscape overview
          • Analysis of price sensitivity, lifecycle, customer purchase basket, adoption rates, and purchase criteria

        13 Geographic Landscape

        • 13.1 Geographic segmentation
          • Chart on Market share by geography 2024-2029 (%)
          • Data Table on Market share by geography 2024-2029 (%)
        • 13.2 Geographic comparison
          • Chart on Geographic comparison
          • Data Table on Geographic comparison
        • 13.3 North America - Market size and forecast 2024-2029
          • Chart on North America - Market size and forecast 2024-2029 ($ million)
          • Data Table on North America - Market size and forecast 2024-2029 ($ million)
          • Chart on North America - Year-over-year growth 2024-2029 (%)
          • Data Table on North America - Year-over-year growth 2024-2029 (%)
        • 13.4 Europe - Market size and forecast 2024-2029
          • Chart on Europe - Market size and forecast 2024-2029 ($ million)
          • Data Table on Europe - Market size and forecast 2024-2029 ($ million)
          • Chart on Europe - Year-over-year growth 2024-2029 (%)
          • Data Table on Europe - Year-over-year growth 2024-2029 (%)
        • 13.5 APAC - Market size and forecast 2024-2029
          • Chart on APAC - Market size and forecast 2024-2029 ($ million)
          • Data Table on APAC - Market size and forecast 2024-2029 ($ million)
          • Chart on APAC - Year-over-year growth 2024-2029 (%)
          • Data Table on APAC - Year-over-year growth 2024-2029 (%)
        • 13.6 South America - Market size and forecast 2024-2029
          • Chart on South America - Market size and forecast 2024-2029 ($ million)
          • Data Table on South America - Market size and forecast 2024-2029 ($ million)
          • Chart on South America - Year-over-year growth 2024-2029 (%)
          • Data Table on South America - Year-over-year growth 2024-2029 (%)
        • 13.7 Middle East and Africa - Market size and forecast 2024-2029
          • Chart on Middle East and Africa - Market size and forecast 2024-2029 ($ million)
          • Data Table on Middle East and Africa - Market size and forecast 2024-2029 ($ million)
          • Chart on Middle East and Africa - Year-over-year growth 2024-2029 (%)
          • Data Table on Middle East and Africa - Year-over-year growth 2024-2029 (%)
        • 13.8 US - Market size and forecast 2024-2029
          • Chart on US - Market size and forecast 2024-2029 ($ million)
          • Data Table on US - Market size and forecast 2024-2029 ($ million)
          • Chart on US - Year-over-year growth 2024-2029 (%)
          • Data Table on US - Year-over-year growth 2024-2029 (%)
        • 13.9 Canada - Market size and forecast 2024-2029
          • Chart on Canada - Market size and forecast 2024-2029 ($ million)
          • Data Table on Canada - Market size and forecast 2024-2029 ($ million)
          • Chart on Canada - Year-over-year growth 2024-2029 (%)
          • Data Table on Canada - Year-over-year growth 2024-2029 (%)
        • 13.10 China - Market size and forecast 2024-2029
          • Chart on China - Market size and forecast 2024-2029 ($ million)
          • Data Table on China - Market size and forecast 2024-2029 ($ million)
          • Chart on China - Year-over-year growth 2024-2029 (%)
          • Data Table on China - Year-over-year growth 2024-2029 (%)
        • 13.11 Germany - Market size and forecast 2024-2029
          • Chart on Germany - Market size and forecast 2024-2029 ($ million)
          • Data Table on Germany - Market size and forecast 2024-2029 ($ million)
          • Chart on Germany - Year-over-year growth 2024-2029 (%)
          • Data Table on Germany - Year-over-year growth 2024-2029 (%)
        • 13.12 France - Market size and forecast 2024-2029
          • Chart on France - Market size and forecast 2024-2029 ($ million)
          • Data Table on France - Market size and forecast 2024-2029 ($ million)
          • Chart on France - Year-over-year growth 2024-2029 (%)
          • Data Table on France - Year-over-year growth 2024-2029 (%)
        • 13.13 Japan - Market size and forecast 2024-2029
          • Chart on Japan - Market size and forecast 2024-2029 ($ million)
          • Data Table on Japan - Market size and forecast 2024-2029 ($ million)
          • Chart on Japan - Year-over-year growth 2024-2029 (%)
          • Data Table on Japan - Year-over-year growth 2024-2029 (%)
        • 13.14 India - Market size and forecast 2024-2029
          • Chart on India - Market size and forecast 2024-2029 ($ million)
          • Data Table on India - Market size and forecast 2024-2029 ($ million)
          • Chart on India - Year-over-year growth 2024-2029 (%)
          • Data Table on India - Year-over-year growth 2024-2029 (%)
        • 13.15 UK - Market size and forecast 2024-2029
          • Chart on UK - Market size and forecast 2024-2029 ($ million)
          • Data Table on UK - Market size and forecast 2024-2029 ($ million)
          • Chart on UK - Year-over-year growth 2024-2029 (%)
          • Data Table on UK - Year-over-year growth 2024-2029 (%)
        • 13.16 South Korea - Market size and forecast 2024-2029
          • Chart on South Korea - Market size and forecast 2024-2029 ($ million)
          • Data Table on South Korea - Market size and forecast 2024-2029 ($ million)
          • Chart on South Korea - Year-over-year growth 2024-2029 (%)
          • Data Table on South Korea - Year-over-year growth 2024-2029 (%)
        • 13.17 Brazil - Market size and forecast 2024-2029
          • Chart on Brazil - Market size and forecast 2024-2029 ($ million)
          • Data Table on Brazil - Market size and forecast 2024-2029 ($ million)
          • Chart on Brazil - Year-over-year growth 2024-2029 (%)
          • Data Table on Brazil - Year-over-year growth 2024-2029 (%)
        • 13.18 Market opportunity by geography
          • Market opportunity by geography ($ million)
          • Data Tables on Market opportunity by geography ($ million)

        14 Drivers, Challenges, and Opportunity/Restraints

        • 14.1 Market drivers
          • 14.2 Market challenges
            • 14.3 Impact of drivers and challenges
              • Impact of drivers and challenges in 2024 and 2029
            • 14.4 Market opportunities/restraints

              15 Competitive Landscape

              • 15.1 Overview
                • 15.2 Competitive Landscape
                  • Overview on criticality of inputs and factors of differentiation
                • 15.3 Landscape disruption
                  • Overview on factors of disruption
                • 15.4 Industry risks
                  • Impact of key risks on business

                16 Competitive Analysis

                • 16.1 Companies profiled
                  • Companies covered
                • 16.2 Company ranking index
                  • Company ranking index
                • 16.3 Market positioning of companies
                  • Matrix on companies position and classification
                • 16.4 AiQ Smart Clothing Inc.
                  • AiQ Smart Clothing Inc. - Overview
                  • AiQ Smart Clothing Inc. - Product / Service
                  • AiQ Smart Clothing Inc. - Key offerings
                  • SWOT
                • 16.5 B10NIX Srl
                  • B10NIX Srl - Overview
                  • B10NIX Srl - Product / Service
                  • B10NIX Srl - Key offerings
                  • SWOT
                • 16.6 BAE Systems Plc
                  • BAE Systems Plc - Overview
                  • BAE Systems Plc - Business segments
                  • BAE Systems Plc - Key news
                  • BAE Systems Plc - Key offerings
                  • BAE Systems Plc - Segment focus
                  • SWOT
                • 16.7 Carre Technologies Inc.
                  • Carre Technologies Inc. - Overview
                  • Carre Technologies Inc. - Product / Service
                  • Carre Technologies Inc. - Key offerings
                  • SWOT
                • 16.8 DuPont de Nemours Inc.
                  • DuPont de Nemours Inc. - Overview
                  • DuPont de Nemours Inc. - Business segments
                  • DuPont de Nemours Inc. - Key news
                  • DuPont de Nemours Inc. - Key offerings
                  • DuPont de Nemours Inc. - Segment focus
                  • SWOT
                • 16.9 Interactive Wear AG
                  • Interactive Wear AG - Overview
                  • Interactive Wear AG - Product / Service
                  • Interactive Wear AG - Key offerings
                  • SWOT
                • 16.10 Jabil Inc.
                  • Jabil Inc. - Overview
                  • Jabil Inc. - Business segments
                  • Jabil Inc. - Key news
                  • Jabil Inc. - Key offerings
                  • Jabil Inc. - Segment focus
                  • SWOT
                • 16.11 LOOMIA
                  • LOOMIA - Overview
                  • LOOMIA - Product / Service
                  • LOOMIA - Key offerings
                  • SWOT
                • 16.12 sanSirro GmbH
                  • sanSirro GmbH - Overview
                  • sanSirro GmbH - Product / Service
                  • sanSirro GmbH - Key offerings
                  • SWOT
                • 16.13 Schoeller Textil AG
                  • Schoeller Textil AG - Overview
                  • Schoeller Textil AG - Product / Service
                  • Schoeller Textil AG - Key offerings
                  • SWOT
                • 16.14 Sensoria Inc.
                  • Sensoria Inc. - Overview
                  • Sensoria Inc. - Product / Service
                  • Sensoria Inc. - Key offerings
                  • SWOT
                • 16.15 Statex Production and Sales GmbH
                  • Statex Production and Sales GmbH - Overview
                  • Statex Production and Sales GmbH - Product / Service
                  • Statex Production and Sales GmbH - Key offerings
                  • SWOT
                • 16.16 ThermoSoft International Corp.
                  • ThermoSoft International Corp. - Overview
                  • ThermoSoft International Corp. - Product / Service
                  • ThermoSoft International Corp. - Key offerings
                  • SWOT
                • 16.17 Toray Industries Inc.
                  • Toray Industries Inc. - Overview
                  • Toray Industries Inc. - Business segments
                  • Toray Industries Inc. - Key news
                  • Toray Industries Inc. - Key offerings
                  • Toray Industries Inc. - Segment focus
                  • SWOT
                • 16.18 Xenoma Inc.
                  • Xenoma Inc. - Overview
                  • Xenoma Inc. - Product / Service
                  • Xenoma Inc. - Key offerings
                  • SWOT

                17 Appendix

                • 17.1 Scope of the report
                  • 17.2 Inclusions and exclusions checklist
                    • Inclusions checklist
                    • Exclusions checklist
                  • 17.3 Currency conversion rates for US$
                    • Currency conversion rates for US$
                  • 17.4 Research methodology
                    • Research methodology
                  • 17.5 Data procurement
                    • Information sources
                  • 17.6 Data validation
                    • Data validation
                  • 17.7 Validation techniques employed for market sizing
                    • Validation techniques employed for market sizing
                  • 17.8 Data synthesis
                    • Data synthesis
                  • 17.9 360 degree market analysis
                    • 360 degree market analysis
                  • 17.10 List of abbreviations
                    • List of abbreviations

                  Research Methodology

                  Technavio presents a detailed picture of the market by way of study, synthesis, and summation of data from multiple sources. The analysts have presented the various facets of the market with a particular focus on identifying the key industry influencers. The data thus presented is comprehensive, reliable, and the result of extensive research, both primary and secondary.

                  INFORMATION SOURCES

                  Primary sources

                  • Manufacturers and suppliers
                  • Channel partners
                  • Industry experts
                  • Strategic decision makers

                  Secondary sources

                  • Industry journals and periodicals
                  • Government data
                  • Financial reports of key industry players
                  • Historical data
                  • Press releases

                  DATA ANALYSIS

                  Data Synthesis

                  • Collation of data
                  • Estimation of key figures
                  • Analysis of derived insights

                  Data Validation

                  • Triangulation with data models
                  • Reference against proprietary databases
                  • Corroboration with industry experts

                  REPORT WRITING

                  Qualitative

                  • Market drivers
                  • Market challenges
                  • Market trends
                  • Five forces analysis

                  Quantitative

                  • Market size and forecast
                  • Market segmentation
                  • Geographical insights
                  • Competitive landscape

                  Interested in this report?

                  Get your sample now to see our research methodology and insights!

                  Download Now

                  Frequently Asked Questions

                  E-Textile market growth will increase by $ 37335.7 mn during 2025-2029 .

                  The E-Textile market is expected to grow at a CAGR of 42.2% during 2025-2029 .

                  E-Textile market is segmented by Application( Passive, Active, sports and fitness, transportation, others) End-user( Military and defense, Architecture, Sports and fitness, Transportation, Others) Technology( Thermostatic E-textiles, Energy harvesting E-textiles, Sensing E-textiles, Luminescent E-textiles, Middle East and Africa)

                  AiQ Smart Clothing Inc., B10NIX Srl, BAE Systems Plc, Carre Technologies Inc., DuPont de Nemours Inc., Interactive Wear AG, Jabil Inc., LOOMIA, Mitsufuji Corp, Outlast Technologies GmbH, sanSirro GmbH, Schoeller Textil AG, Sensoria Inc., Statex Production and Sales GmbH, Tex Ray Industrial Co. Ltd., ThermoSoft International Corp., Toray Industries Inc., Vulpes Electronics GmbH, Xenoma Inc. are a few of the key vendors in the E-Textile market.

                  North America will register the highest growth rate of 36% among the other regions. Therefore, the E-Textile market in North America is expected to garner significant business opportunities for the vendors during the forecast period.

                  US, Canada, China, Germany, France, Japan, India, UK, Brazil, South Korea

                  • High demand for health-monitoring wearablesThe global e-textile market is expected to experience tremendous growth in the medical and healthcare sector. This growth is likely to be driven by the rising demand for smart apparel and high-performance health monitoring equipment. E-textiles are used in designing and manufacturing sportswear for extreme sports is the driving factor this market.
                  • running is the driving factor this market.
                  • and skiing; artificial turfs and related products; sports footwear; parachute fabric; and sleeping bags. In addition is the driving factor this market.
                  • athletes are constantly striving to improve their performance. With the help of e-textile is the driving factor this market.
                  • they record data for later analysis. Athletes opt for lightweight equipment that can be fitted to their sportswear for further performance assessment as well as enhancement. e-textiles in the fitness and sports segment help in coaching the players and fitness seekers and helps in the improvement of golf swings is the driving factor this market.
                  • tennis serves is the driving factor this market.
                  • and ski techniques. Apart from sports is the driving factor this market.
                  • defense and healthcare are the major end-user segments for health monitoring wearables. In the military and defense is the driving factor this market.
                  • these wearables are used to monitor and relay the vital health statistics of soldiers on the field. It enables on-field doctors and rescue teams to act immediately in case of emergencies. Similarly is the driving factor this market.
                  • in the medical and healthcare industry is the driving factor this market.
                  • health-monitoring wearables help doctors monitor the health vitals of patients remotely by doctors. They can also send distress signals to doctors in the case of an emergency. Moreover is the driving factor this market.
                  • these e-textiles are also used in personal protective equipment and apparel to reduce the extent of risks that users are exposed to and provide them with suitable environment-based external stimuli. Therefore is the driving factor this market.
                  • the introduction of high-functional e-textiles enables monitoring and improving the overall health of an individual. This will lead to the high adoption of these wearables during the forecast period. is the driving factor this market.

                  The E-Textile market vendors should focus on grabbing business opportunities from the Passive segment as it accounted for the largest market share in the base year.