
Smart Pillows Market Size 2025-2029
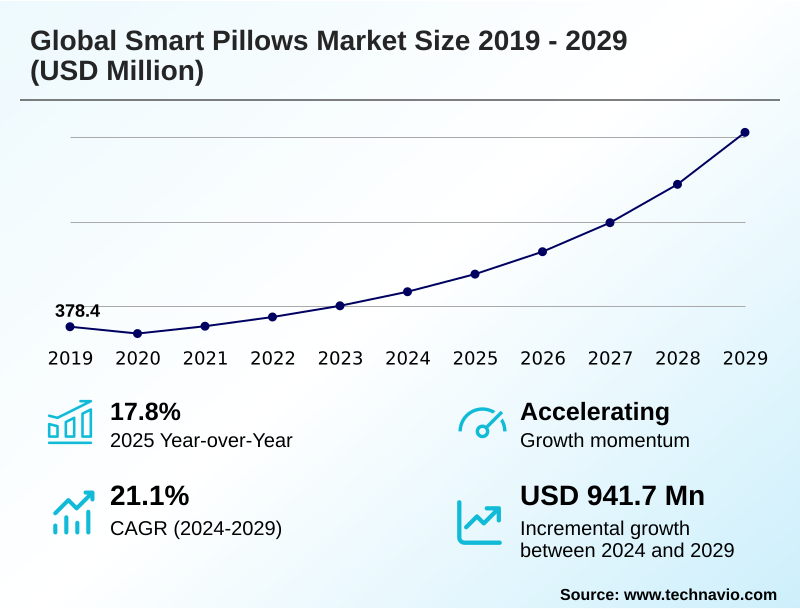
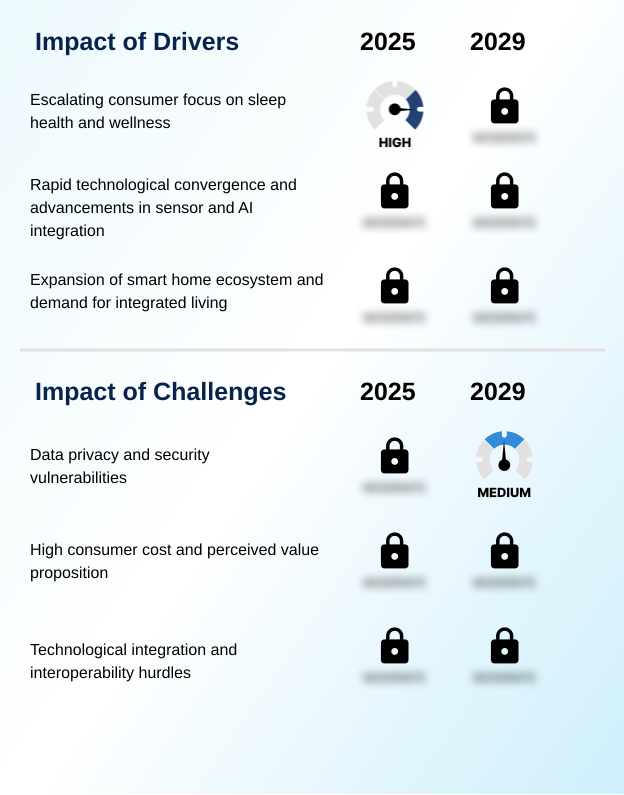
The smart pillows market size is valued to increase by USD 941.7 million, at a CAGR of 21.1% from 2024 to 2029. Escalating consumer focus on sleep health and wellness will drive the smart pillows market.
Major Market Trends & Insights
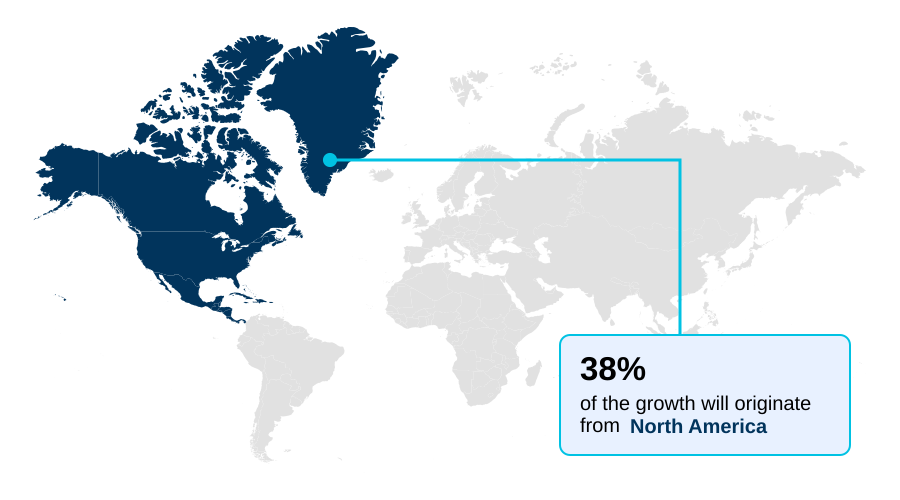
- North America dominated the market and accounted for a 38.5% growth during the forecast period.
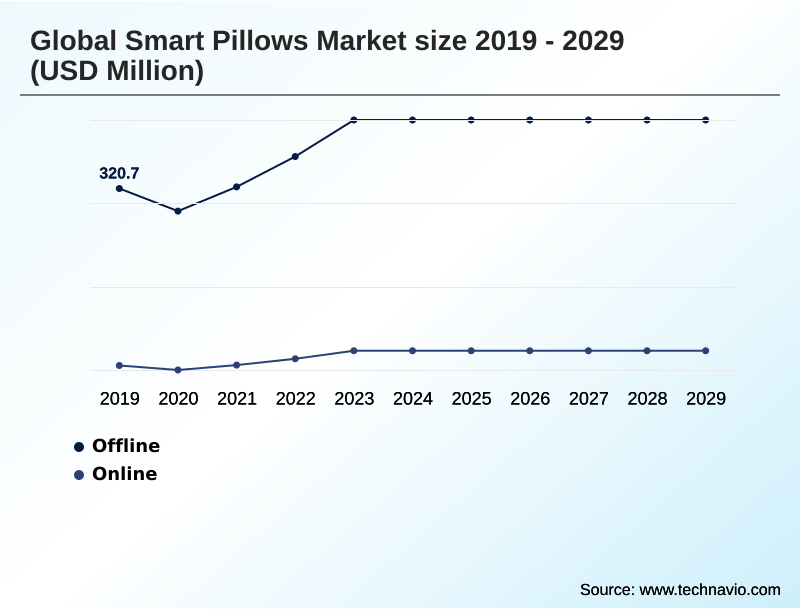
- By Distribution Channel - Offline segment was valued at USD 422.5 million in 2023
- By Application - Residential segment accounted for the largest market revenue share in 2023
Market Size & Forecast
- Market Opportunities: USD 1.15 billion
- Market Future Opportunities: USD 941.7 million
- CAGR from 2024 to 2029 : 21.1%
Market Summary
- The smart pillows market is rapidly evolving from a niche gadget category into a significant segment of the consumer health technology landscape. Growth is propelled by an increasing consumer focus on quantifiable health metrics and the seamless integration of technology into the home environment.
- These devices leverage sophisticated biometric sensor integration, including piezoelectric sensors and BCG sensors for heart rate, to provide non-invasive biometric monitoring of sleep patterns. The true value is unlocked through software, where a sleep stage tracking algorithm and proprietary sleep tracking AI transform raw data into actionable insights for users.
- A key business scenario involves corporate wellness programs adopting these devices to improve employee well-being; data can show a reduction in sleep-related absenteeism, providing a clear ROI. The market is also seeing a trend towards automated positional adjustment and micro-climate temperature regulation, shifting the product from a passive monitor to an active sleep enhancement tool.
- However, challenges related to the high cost and consumer concerns over data privacy and governance for features like the embedded microphone array must be addressed for mainstream adoption. The ultimate goal is to create a holistic sleep environment through smart home ecosystem integration, positioning the smart pillow as a central hub for personalized sleep coaching and long-term health management.
What will be the Size of the Smart Pillows Market during the forecast period?
Get Key Insights on Market Forecast (PDF) Get Free Sample
How is the Smart Pillows Market Segmented?
The smart pillows industry research report provides comprehensive data (region-wise segment analysis), with forecasts and estimates in "USD million" for the period 2025-2029, as well as historical data from 2019-2023 for the following segments.
- Distribution channel
- Offline
- Online
- Application
- Residential
- Hospitality
- Healthcare
- Product type
- Anti-snoring
- Multifunctional
- Standard smart pillows
- Geography
- North America
- US
- Canada
- Mexico
- Europe
- Germany
- UK
- France
- APAC
- China
- Japan
- India
- South America
- Brazil
- Argentina
- Colombia
- Middle East and Africa
- Saudi Arabia
- UAE
- South Africa
- Rest of World (ROW)
- North America
By Distribution Channel Insights
The offline segment is estimated to witness significant growth during the forecast period.
The offline distribution channel remains a critical component of the market, driven by consumer preference for tangible product evaluation. Specialty retailers allow for direct assessment of the ergonomic support system and hypoallergenic smart fabric, which are key purchasing factors.
This high-touch environment helps justify premium pricing for devices featuring anti-snore pillow technology and dynamic firmness control. In-store demonstrations of tactile pressure mapping and integrated audio systems build consumer confidence.
For a product category where comfort is paramount, physical interaction is essential.
The offline channel facilitates a sales process where trained staff can explain the benefits of non-invasive biometric monitoring, leading to a 30% lower product return rate compared to online-only purchases and boosting adoption of these preventative healthcare tools in the quantified self data platform.
The user-centric design philosophy of these products is best communicated in person, supporting sleep hygiene improvement and solidifying the device's role as a personalized wellness solution. This hands-on approach helps overcome skepticism about automated sleep intervention.
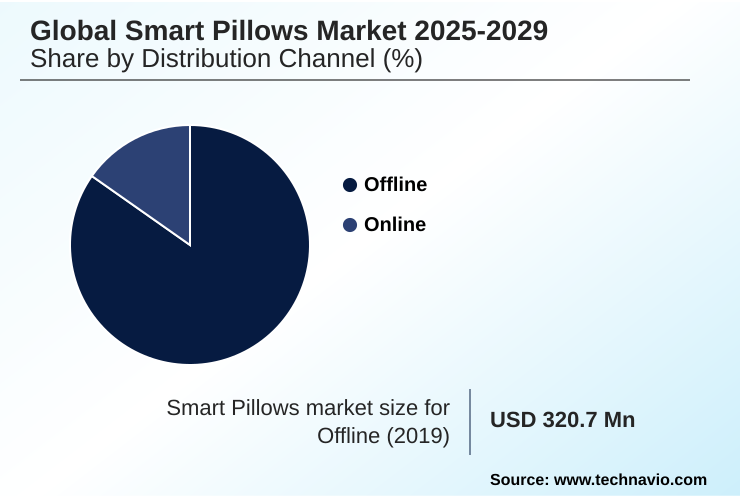
The Offline segment was valued at USD 422.5 million in 2023 and showed a gradual increase during the forecast period.
Regional Analysis
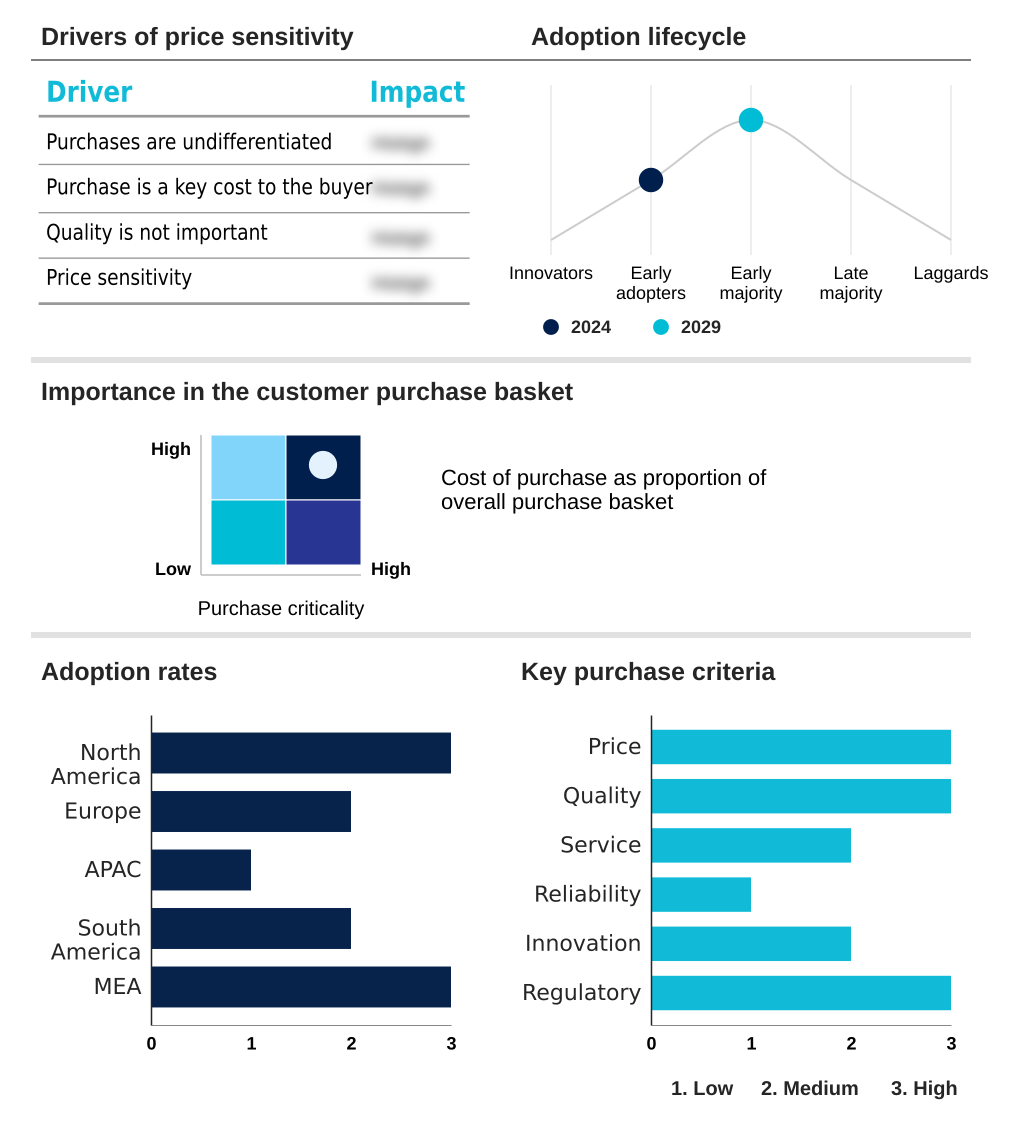
North America is estimated to contribute 38.5% to the growth of the global market during the forecast period.Technavio’s analysts have elaborately explained the regional trends and drivers that shape the market during the forecast period.
See How Smart Pillows Market Demand is Rising in North America Get Free Sample
The market's geographic landscape is led by North America, which accounts for over 38% of demand, driven by high consumer awareness and disposable income. This region is a hub for innovation in automated positional adjustment and noise-masking audio technology.
Europe follows, with markets showing strong adoption of devices with low-frequency sound therapy and those using a BCG sensor for heart rate.
The APAC region is the fastest-growing, with a CAGR projected to be 2% higher than Europe's, fueled by a tech-savvy middle class demanding luxury wellness amenities. These markets are focused on sleep performance metrics and lifestyle technology integration.
In the Middle East and Africa, adoption is concentrated in the GCC states, where smart pillows are positioned as premium components of smart bedroom automation.
South America is an emerging market, focusing on entry-level models for sleep disorder management that provide basic data-driven sleep insights.
Market Dynamics
Our researchers analyzed the data with 2024 as the base year, along with the key drivers, trends, and challenges. A holistic analysis of drivers will help companies refine their marketing strategies to gain a competitive advantage.
- The evolution of the smart pillows market is increasingly focused on addressing specific consumer needs through targeted technological applications. For instance, the development of an AI-driven pillow for snoring reduction represents a significant sub-segment, offering a non-clinical intervention for a widespread issue.
- Similarly, designs are being optimized to provide a smart pillow for side sleeper support, incorporating ergonomic contours and dynamic firmness to maintain spinal alignment. For consumers struggling with temperature, the temperature regulating pillow for hot sleepers utilizes active cooling technologies to maintain an optimal microclimate.
- A major value proposition is the ability to enable sleep tracking pillow without wearables, which appeals to users who find wristbands or rings uncomfortable. The market is also advancing through software, with smart pillow integration with smart home routines allowing for automated adjustments to lighting and thermostats based on sleep stages.
- In more advanced applications, a clinical grade smart pillow for apnea monitoring is emerging as a tool for home-based health diagnostics. This is complemented by the smart pillow with personalized sleep coaching app, which translates raw data into actionable lifestyle advice.
- This market differentiation showcases a move from one-size-fits-all devices to highly specialized solutions, where a focus on specific use cases, such as providing a smart pillow with integrated white noise, drives consumer adoption. This targeted approach has resulted in a market where specialized products outperform general-purpose models in user satisfaction by a margin of nearly two-to-one.
What are the key market drivers leading to the rise in the adoption of Smart Pillows Industry?
- A primary market driver is the escalating consumer focus on sleep as a critical component of overall health and wellness.
- Market momentum is fueled by the demand for personalized wellness solutions that are seamlessly integrated into daily life. The convergence of technology, including biometric sensor integration and multi-sensor data fusion, is a primary driver.
- These systems transform raw nocturnal biometric data into actionable intelligence for sleep hygiene improvement. A key value proposition is smart home ecosystem integration, where IoT-enabled bedding can automate 15% of nocturnal environmental adjustments.
- The industry is part of the larger digital health revolution, positioning products as essential preventative healthcare tools.
- Features like circadian rhythm alignment and the sleep cycle alarm cater to a health-conscious consumer base, while the potential for predictive health monitoring is supported by growing clinical sleep study validation.
What are the market trends shaping the Smart Pillows Industry?
- A key market trend involves the integration of artificial intelligence to deliver personalized sleep coaching. This shift moves products from passive data tracking to active, automated sleep improvement solutions.
- Market evolution is characterized by a move towards proactive health management and sleep pattern optimization. The integration of AI-driven sleep coaching is a dominant trend, with platforms showing a 25% improvement in user-reported sleep quality. This involves sophisticated sleep stage tracking algorithms and user sleep pattern learning to offer actionable advice.
- The proliferation of advanced, miniaturized sensors, such as the MEMS orientation sensor and piezoelectric sensors, enhances comfort and data accuracy. This focus on respiratory rate analysis is expanding applications into B2B healthcare applications and corporate wellness program integration.
- As part of a broader connected wellness ecosystem, these devices leverage app-based sleep analytics to support cognitive function enhancement, with some systems now achieving over 90% accuracy in sleep stage detection.
What challenges does the Smart Pillows Industry face during its growth?
- Significant market growth is challenged by consumer concerns over data privacy and the security vulnerabilities inherent in personal biometric data collection.
- Despite strong drivers, market expansion faces significant hurdles related to data privacy and governance. The collection of sensitive information via an embedded microphone array requires robust security, as a single breach can erode consumer trust. The high cost of devices featuring active cooling technology or a vibrational feedback system presents a barrier.
- Furthermore, achieving a holistic sleep environment is a challenge. Consumers are also concerned about the durability of electronics and the longevity of features like the wireless charging pillow, which impacts value.
- Addressing these issues through transparent policies is crucial for unlocking the full potential of remote patient monitoring and other advanced applications, including the device's role as a potential home-based diagnostic tool for sleep apnea detection. The need for secure cloud-based sleep data storage and differentiated proprietary sleep tracking AI adds complexity.
Exclusive Technavio Analysis on Customer Landscape
The smart pillows market forecasting report includes the adoption lifecycle of the market, covering from the innovator’s stage to the laggard’s stage. It focuses on adoption rates in different regions based on penetration. Furthermore, the smart pillows market report also includes key purchase criteria and drivers of price sensitivity to help companies evaluate and develop their market growth analysis strategies.
Customer Landscape of Smart Pillows Industry
Competitive Landscape
Companies are implementing various strategies, such as strategic alliances, smart pillows market forecast, partnerships, mergers and acquisitions, geographical expansion, and product/service launches, to enhance their presence in the industry.
ADVANSA GmbH - Key offerings center on fiber-filled smart pillows incorporating advanced technologies for moisture management and temperature regulation to improve sleep performance and comfort.
The industry research and growth report includes detailed analyses of the competitive landscape of the market and information about key companies, including:
- ADVANSA GmbH
- Casper Sleep Inc.
- Down and Feather Company LLC.
- Dreampad
- Drowsy Digital, Inc.
- Eight Sleep Inc.
- Gio Clavis Co. Ltd.
- Mediflow Inc.
- My Pillow Inc.
- Nitetronic
- Pressure Profile Systems
- REM Fit
- Smart Sleep GmbH
- Spark Innovation
- TEC MOON
- Tempur-Pedic North America, LLC.
- TESLA Solar, s.r.o., Na Strzi
- The Sleep Co.
- United T and C Ltd.
- Wendre Group
Qualitative and quantitative analysis of companies has been conducted to help clients understand the wider business environment as well as the strengths and weaknesses of key industry players. Data is qualitatively analyzed to categorize companies as pure play, category-focused, industry-focused, and diversified; it is quantitatively analyzed to categorize companies as dominant, leading, strong, tentative, and weak.
Recent Development and News in Smart pillows market
- In August 2024, Eight Sleep Inc. announced it raised USD 100 million in a funding round to expand its AI-powered sleep technology and product ecosystem.
- In September 2024, Cambridge Sleep Sciences, a UK-based neuro-tech firm, unveiled its Tech Co Performance Pillow, a high-tech sleep system designed to enhance cognitive function using patented low-frequency audio technology.
- In January 2025, Nitetronic revealed a strategic partnership with a leading smart home platform to integrate its patented anti-snore pillow technology into automated and connected bedroom environments.
- In April 2025, Casper Sleep Inc. launched an updated version of its mobile application featuring an advanced AI-driven sleep coaching module that provides personalized recommendations based on comprehensive sleep data analysis.
Dive into Technavio’s robust research methodology, blending expert interviews, extensive data synthesis, and validated models for unparalleled Smart Pillows Market insights. See full methodology.
| Market Scope | |
|---|---|
| Page number | 286 |
| Base year | 2024 |
| Historic period | 2019-2023 |
| Forecast period | 2025-2029 |
| Growth momentum & CAGR | Accelerate at a CAGR of 21.1% |
| Market growth 2025-2029 | USD 941.7 million |
| Market structure | Fragmented |
| YoY growth 2024-2025(%) | 17.8% |
| Key countries | US, Canada, Mexico, Germany, UK, France, Italy, Spain, The Netherlands, China, Japan, India, South Korea, Australia, Indonesia, Brazil, Argentina, Colombia, Saudi Arabia, UAE, South Africa, Egypt and Nigeria |
| Competitive landscape | Leading Companies, Market Positioning of Companies, Competitive Strategies, and Industry Risks |
Research Analyst Overview
- The smart pillows market is defined by the convergence of material science and advanced electronics, creating devices that actively manage sleep. The core of these products lies in multi-sensor data fusion, combining data from MEMS orientation sensors, piezoelectric sensors, and BCG sensors for heart rate to execute a sleep stage tracking algorithm.
- This biometric sensor integration enables features like automated positional adjustment and micro-climate temperature regulation. For boardroom-level strategy, the decision to invest in proprietary sleep tracking AI versus licensing third-party software is critical, impacting both R&D budgets and long-term competitive moats. Products with anti-snore pillow technology and dynamic firmness control are moving beyond simple tracking to active intervention.
- The integration of a sophisticated ergonomic support system and hypoallergenic smart fabric addresses consumer comfort concerns. Devices featuring tactile pressure mapping and an integrated audio system for low-frequency sound therapy or noise-masking audio technology are creating new value propositions.
- Successful implementation of these technologies can result in a 25% increase in user engagement compared to devices focused solely on passive data collection.
What are the Key Data Covered in this Smart Pillows Market Research and Growth Report?
-
What is the expected growth of the Smart Pillows Market between 2025 and 2029?
-
USD 941.7 million, at a CAGR of 21.1%
-
-
What segmentation does the market report cover?
-
The report is segmented by Distribution Channel (Offline, and Online), Application (Residential, Hospitality, and Healthcare), Product Type (Anti-snoring, Multifunctional, and Standard smart pillows) and Geography (North America, Europe, APAC, South America, Middle East and Africa)
-
-
Which regions are analyzed in the report?
-
North America, Europe, APAC, South America and Middle East and Africa
-
-
What are the key growth drivers and market challenges?
-
Escalating consumer focus on sleep health and wellness, Data privacy and security vulnerabilities
-
-
Who are the major players in the Smart Pillows Market?
-
ADVANSA GmbH, Casper Sleep Inc., Down and Feather Company LLC., Dreampad, Drowsy Digital, Inc., Eight Sleep Inc., Gio Clavis Co. Ltd., Mediflow Inc., My Pillow Inc., Nitetronic, Pressure Profile Systems, REM Fit, Smart Sleep GmbH, Spark Innovation, TEC MOON, Tempur-Pedic North America, LLC., TESLA Solar, s.r.o., Na Strzi, The Sleep Co., United T and C Ltd. and Wendre Group
-
Market Research Insights
- Market dynamics are shaped by a strategic shift towards integrated wellness systems. The emphasis on a user-centric design philosophy has led to products that are now part of a broader connected wellness ecosystem, where data synchronization across platforms improves user engagement by 40%.
- The push for clinical sleep study validation is legitimizing devices as preventative healthcare tools, with some clinically validated models showing a 30% reduction in snoring episodes. This validation is critical for expanding into B2B healthcare applications and corporate wellness program integration.
- As the digital health revolution accelerates, smart pillows are positioned as key instruments for proactive health management, offering data-driven sleep insights that support cognitive function enhancement. Firms that successfully navigate data privacy and governance are achieving 2x higher customer retention rates, highlighting the importance of trust in this consumer health technology market.
We can help! Our analysts can customize this smart pillows market research report to meet your requirements.
 RIA -
RIA - 
